Approach of Remote Sensing and GIS Techniques of Land Use and Land Cover Mapping –Patna Municipal Corporation, (PMC) Patna, Bihar, India
Mohammad Yasir Ahmad1
*
 and Nikhat Hassan Munim2
http://dx.doi.org/10.12944/CWE.15.2.25
The approach of Remote Sensing (RS) and Geographical Information System (GIS) for the preparation of land use land cover (LULC) mapping is an essential aspect of planning and development activities for earth resource management. This paper investigates land use land cover (LULC) map of Patna Municipal Corporation (PMC), Patna, Bihar, India. The City Patna (PMC) is a fast developing city and emerging economic centre in Bihar. The population of the city (PMC) is growing day by day, and rapid migration from the different parts of the Bihar resulted from rapid urbanization. We offer RS and GIS techniques delineated different LULC of the PMC study area. LULC was done through False Color Composite (FCC) Satellite Image, Resourcesat-2A Linear Imaging Self Scanning Sensor IV (LISS-IV) with 5.8-meter spatial resolution data of the year 2018. The supervised classification and maximum likelihood classification were used to classified LISS IV images. The LULC map was created five different classes identified water bodies, agriculture land, fallow land, wasteland, built-up land, and vegetation of the study area. The advantages of MLC method in which a pixel with the maximum likelihood is classified into the corresponding class based on a probability function determines the variance and covariance of each theme. The LULC result showed that maximum area under PMC was covered with a built-up area of 70.80 Sq. Km. is higher than the others because of the rapidly growing population. Agriculture land, fallow land, and vegetation occupied area of 31.7 Sq.Km., while the wasteland constituted around 11.86 Sq. Km and water bodies covered around 5.8 Sq.Km. The accuracy was done through field verification and Satellite (Google) image.
The primary objective of this research work to implement the use of Remote sensing and GIS technique to detect the LULC category of the PMC area. This study, the approach of Remote Sensing and GIS techniques will give the benefits in future LULC development plans due to its advantages in time, cost benefits, reliability over the traditional ground techniques.
Copy the following to cite this article:
Ahmad M. Y, Munim N. H. Approach of Remote Sensing and GIS Techniques of Land Use and Land Cover Mapping –Patna Municipal Corporation, (PMC) Patna, Bihar, India. Curr World Environ 2020; 15(2).
DOI:http://dx.doi.org/10.12944/CWE.15.2.25Copy the following to cite this URL:
Ahmad M. Y, Munim N. H. Approach of Remote Sensing and GIS Techniques of Land Use and Land Cover Mapping –Patna Municipal Corporation, (PMC) Patna, Bihar, India. Curr World Environ 2020; 15(2). Available from: https://bit.ly/3aypwpS
Download article (pdf) Citation Manager Publish History

Introduction
The approach of Remote Sensing (RS) and Geographical Information System (GIS) for the preparation of land use land cover (LULC) mapping is an essential aspect of planning and development activities for land resource management. The study City Patna (PMC) is a fast developing city and emerging economic epicentre in Bihar. The population of the city (PMC) is growing day by day, and rapid migration from the different parts of the Bihar resulted from rapid urbanization.1 So, these profound changes can cause long-term dynamics with climate change.
The approach of RS & GIS in LULC mapping is essential due to its advantages in time, cost benefits, reliability over the traditional ground methods. Large areas can be imaged quickly and repetitively, and also image interpretation is faster and less expensive than conducting ground surveys.2
The fast development of our economic sector and population explosion has caused significant changes to our Earth’s land cover resources over the last two centuries, and there is a sign that these changes will increase in the future. Patna Municipal Corporation area is developing by unplanned, uncontrolled and unregulated activities, leading to the urban sprawl.3 Since 1981, due to the absence of planning interventions, with rapid growth resulted in haphazard development led to the degradation of open space under the PMC area.1 For the best use of land, it is vital to examine the existing LULC features, and their increasing needs due to population explosion, economic expansion and new lifestyles.4
These studies were carried out for LULC mapping through False Color Composite (FCC) Satellite Image, Resourcesat-2A Linear Imaging Self Scanning Sensor IV (LISS-IV) with 5.8-meter spatial resolution data of the year 2018. The supervised classification and maximum likelihood classifier (MLC) algorithm were used to classified LISS IV images.5 The LULC map was generated five different classes identified water bodies, agriculture land/ fallow land, wasteland, built-up land, and vegetation of the study area. The advantages of MLC method in which a pixel with the maximum likelihood is classified into the corresponding class based on a probability function determines the variance and covariance of each theme.5 The other classifier is available for land use land cover mapping is the minimum distance classifier where the mean vector for each LULC category is determined from the average digital number (DN) in each band for each class.6 But this technique also overlooks the different degrees of variation. The parallelepiped classifier estimates the maximum and minimum DN in each band based on the lowest and highest values on each axis and accuracy of classification depends on the selection of the highest and lowest values of each class.6
The primary objective of this research work to implement the use of Remote sensing and GIS technique to detect the LULC category of the entire PMC area. This study, the approach of Remote Sensing and GIS techniques will give the benefits in future LULC development plans due to its advantages in time, cost benefits, reliability over the traditional ground techniques.
Study Area
Patna is the capital of Bihar state. It exists on the south bank of the river Ganga. The study area lies between 25° 33’22” and 25° 39’20” N Latitude and between 85° 04’50” and 85° 16’03.55” E Longitude falling in Survey of India toposheet nos. 72G/2 & 72G/6 on the plains of the Ganga basin at the height of 174 feet (53 m approx.) above the sea level.
The total area under the Patna Municipal Corporation (PMC) is 109.218 sq. Km. The seventy-two wards PMC along with Patliputra Housing Colony which accommodates a population of about 6,87,828 individuals as per the 2011 census.7 A location map, Satellite Imagery LISS IV data of 2018 is presented in (Fig.1).
 |
Figure 1: Location Map (IRS P6-LISS-1V Image/2018) |
Methodology
Space-borne Multi-temporal/ Multispectral data, as well as ancillary data, applied and developed land use and land cover mapping. Multispectral high-resolution satellite data Resourcesat-2A (LISS-IV) (Fig.2) data of 2018 (path 104 rows 053), acquired during April with 5.8 m spatial resolution, used to address temporal variability in LULC categories in this research work. Satellite data procured from the NRSC/NDC data centre/ User Order Processing System [UOPS].
Table 1: Technical Specification of LISS IV Data
|
Satellite |
Sensor |
Date of Acquisition |
Band/ Spectral Resolution |
Resolution (m) |
Path/Row |
|
Resourcesat-2A (IRS R2A) |
LISS IV |
02.04.2018 |
B2- 0.52-0.59 B3- 0.62-0.68 B4- 0.77-0.86 |
5.8 |
104/53 |
Remote Sensing and GIS Data Interpretation
Image Pre-processing
Pre-processing is the preliminary step to eliminate unwanted sources to restore the distorted or degraded images in the most original form/scene.6 In this study, LISS-IV data were registered with WGS 84 UTM projection, and the process was done through rectification.
Image Interpretation
Image interpretation such as tone, texture, slope, size, pattern, site, and association applied for the visual analysis of satellite data for the development of the LULC map.8 The satellite image has three bands (Band 2, 3, 4) in the region of Green, Red, and Near-Infrared, respectively, and the type of image was used FCC. Various tools, techniques, and methodologies adopted in this study for image classification briefly described below.
Image Enhancement
The techniques Image Enhancement applied to increase the better visual distinctions or interpretation, to increase the amount of information between features in an image or satellite data. The Enhancement techniques were used to improve the better contrast in all the features in a scene, especially water and land.6
Image Classification
The Image Classification procedure was applied to classify multispectral pixels sorting all the pixels in an image into several individual classes.6
Supervised Classification
We opted supervised technique, which starts with ground monitoring at specific locations in the study area. In supervised technique/classification, first identified the training area and developed a numeric or digital value of the spectral class where pixels classified into different LULC types.6
Maximum Likelihood Classifier
The LULC map was created five different classes with the help of a maximum likelihood Classifier technique. The advantages of this method are based on a probability function determines the variance and covariance of each theme.7 This method cannot be applied if the distribution of the population does not follow the normal distribution. The maximum likelihood is defined as follows.9
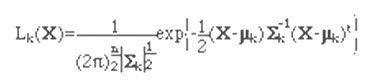
where n: number of bands
X: image data of n bands
Lk(X): likelihood of X belonging to class k
µk: mean vector of class k
∑k: variance-covariance matrix of class k
|∑k|: determinant of ∑k.
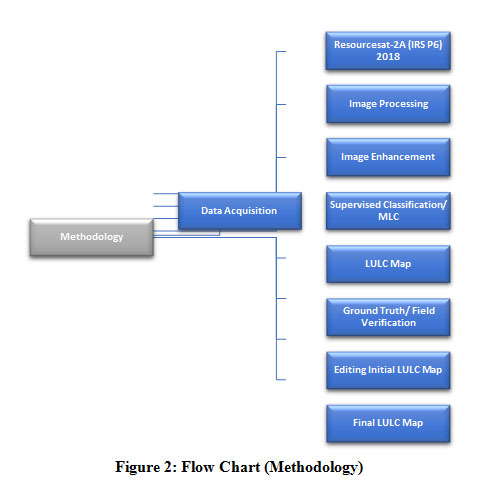 |
Figure 2: Flow Chart (Methodology) |
Results
The outcome of the LULC result shows that maximum area constitutes under the PMC area is the built-up land around 59.13 %, followed by agriculture/fallow land covers 21.18%. Whereas vegetation exists 10.52 %, wasteland covers 9.90%, and water bodies constitute around 4.32% of the entire study area. Since 1981, due to the absence of planning interventions, with rapid growth resulted in haphazard development led to the degradation of open space under the PMC area.1 For the best use of land, it is vital to examine the existing LULC features, and their increasing needs due to population explosion, economic expansion and new lifestyles.
Discussion
The supervised classification and maximum likelihood classifier (MLC) algorithm were used to classified LISS IV images. Multispectral high-resolution satellite data Resourcesat-2A (LISS-IV) (Fig.2) data of 2018 (path 104 rows 053), acquired during April 02.04.2018 with 5.8 m spatial resolution, used to address LULC categories in this research work. The advantages of MLC method in which a pixel with the maximum likelihood is classified into the corresponding class based on a probability function determines the variance and covariance of each theme.
In late 1990, the Google Earth was developed and later in October 2004 acquired keyhole to better serve its users. Satellite Imagery (Google) which displays composite images from a far distance of the Earth’s surface with transitions into different imagery after zooming of the same area with finer detail varies from one area to the next with date and time.10 The accuracy of the classified map was done through field verification, and satellite Image (Google) acquired dated 20.04.2020. A total of 95,147 pixels (Table-3) collected for the validation of classified results.
Table.2: Land use and Land cover class
|
Class Name |
Area under LULC (Sq. Km.) |
% Area LULC |
|
Water Bodies |
5.18 |
4.32 |
|
Agriculture/ Fallow Land |
21.18 |
17.71 |
|
Built-up Land |
70.80 |
59.13 |
|
Waste Land |
11.86 |
9.90 |
|
Vegetation |
10.52 |
8.80 |
|
Total |
119.54 |
100 |
Table 3: Validation of classified image
|
Class Name |
Pixels |
% of the image |
|
Water bodies |
4918 |
5.16 |
|
Agriculture/ Fallow Land |
17793 |
18.70 |
|
Built-up Land |
54579 |
57.36 |
|
Waste Land |
8606 |
9.04 |
|
Vegetation |
9251 |
9.72 |
|
TOTAL |
95147 |
100 |
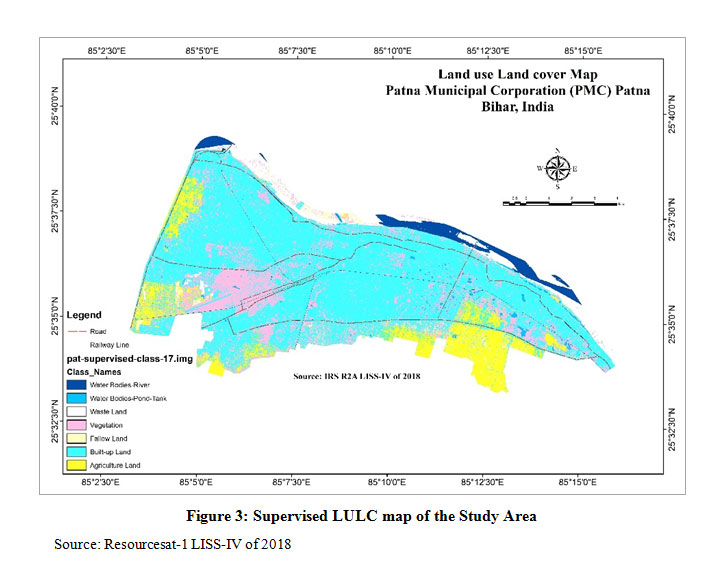 |
Figure 3: Supervised LULC map of the Study Area |
Conclusion
Patna Municipal Corporation area is developing by unplanned, uncontrolled and unregulated activities, leading to the urban sprawl. In this research work, LISS IV data was used to address LULC categories of the entire PMC area. For better accuracy of the results, applied maximum likelihood classification (MLC) algorithm in which a pixel was classified the maximum likelihood to the corresponding class based on a probability function determines the variance and covariance of each theme. The accuracy of the results also verified through the Satellite (Google) image as well as ground-truthing/ verification. Based on the findings and historical facts in the absence of proper LULC planning, PMC area has become haphazard due to uncontrolled planning. This analysis identified to make the use of RS and GIS applications with adequate preparation to support land use land cover resources in facing several problems at present.
Acknowledgements
The author would like to thank Magadh University for granting the Ph.D., research work. The Department of Environmental Science, A.N. College, Patna of the Magadh University, is highly appreciated for allowed the GIS laboratory work. The author is also profoundly grateful to the National Remote Sensing Center (NRSC), Indian Space Research Organisation (ISRO), Govt. of India for their guidance during the Satellite data procurement.
Funding Source
There is no funding support for this research work.
Conflict of Interest
The authors do not have any conflict of interest.
References
- Urban Development & Housing Department. Master Plan for Patna. http://urban.bih.nic.in/PMP/Patna-MP-Report-18-11-2014.pdf. Accessed December 16, 2018.
- Roy PS, Dwivedi RS, Vijayan D, eds. Remote Sensing Applications. 2nd ed. Hyderabad, National Remote Sensing Centre; 2010.
- Ashraf M, An Assessment of Land Use Land Cover Change Pattern in Patna Municipal Corporation over 25 Years (1989-2014) Using Remote Sensing and GIS Techniques, International Journal of Innovative Research in Science, Engineering and Technology 2014;3(10):1000146. DOI: 10.15680/IJIRSET.2014.0310053.
- Joseph G, Dhawan S, eds. Fundamentals of Remote Sensing. Hyderabad, Universities Press (India) Private Limited; 2003.
- Sood V, Gupta S, Gusain HS, Singh S, Spatial and quantitative comparison of topographically derived different classification algorithms using AWiFS data over Himalayas, India. Journal of the Indian Society of Remote Sensing 2018; 46(12):1991-2002.
- Kiefer RW, Lillesand TM, eds. Remote sensing and image interpretation. 4th ed. New York, John Wiley and Sons; 2004.
- Census of India. District Census Handbook, New Delhi, Director of Census Operations Bihar, 2011. https://censusindia.gov.in/2011census/dchb/DCHB_A/10/1028_PART_A_DCHB_PATNA.pdf. Published 2011. Accessed December 16, 2018.
- Sabins FF, eds. Remote Sensing Principles and Interpretation. 3rd ed. New York, W. H. Freeman and Company; 1996.
- Japan Association of Remote Sensing. Remote Sensing Notes. http://sar.kangwon.ac.kr/etc/rs_note/rsnote/cp11/cp11-7.htm Accessed July 20, 2020.
- Google Earth. Wikipedia. https://en.wikipedia.org/wiki/Google_Earth#History. Accessed July 20, 2020.
- Maheswari R, Rajkumar R. OM, Surendran A, Krishnamoorthy B. S. Monitoring changes in land use Land cover using Multi-Temporal Sensor Satellite Data. International Journal of Recent Scientific Research 2015;6(2):2867-2870.
- Mhmod M, Cal L, Zhuoguo M, Monitor and Study Horizontal and Verticals Changes at Land Surface in Wen Chuan Area from 1974 to 2010 Using Remote Sensing and GIS Technology, Journal of Remote Sensing & GIS 2015;4(3):1000146. DOI: 10.4172/2469-4134.1000146.
- National Remote Sensing Centre. Land use Land Cover Atlas of India, Hyderabad, Indian Space Research Organisation, Department of Space, Govt. of India, 2011(2-6).
- Singh HC, eds. Rural Environment Development and Planning, Allahabad, Chugh Publications; 1989.
- Vijayakumar N, Gurugnanam B, Arulbalaji K, Land use Land cover change detection in Thirumanimuttar Sub Basin, Cauvery River, Tamilnadu, International Journal of Science, Engineering and Technology Research 2015;4(4):680-683.
- Anderson JR, Hardy EE, Roach JT, Witmer RE, eds. A Land Use and Land Cover Classification System for Use with Remote Sensor Data. Washington, United States Government Printing Office; 1976. https://pubs.usgs.gov/pp/0964/report.pdf. Accessed November 15, 2018.
- Shih S.F. Satellite data and geographic information system for land use classification. Journal of irrigation and drainage engineering 1988;114(3): 505-519.
- Marsh WM, Grossa JJ, Environmental geography: science, land use, and earth systems. 3rd ed. New York, John Wiley and Sons; 2004.


