Assessment of Leachate Contaminated Groundwater Quality near Mandur Solid Waste Dumping Site, Bangalore
RaviKumar P1
, Shridhar D M1
and Prakash K L1
*

http://dx.doi.org/10.12944/CWE.15.2.06
Groundwater samples along with leachate were collected randomly around the municipal solid waste dumping at Mandur village, Bangalore. All the collected samples were analysed for analytical parameters like pH, hardness, electrical conductivity, total dissolved solids, alkalinity, calcium, magnesium, sodium, potassium, chloride, nitrate, sulphate, phosphate using Standard APHA methods during April 2018 (pre-monsoon period). It is apparent from the results that 25.93, 33.34, 14.82 and 81.48% of groundwater samples respectively recorded higher electrical conductivity (EC ≥ 1000 µS/cm), total dissolved solids ( TDS ≥ 500 mg/L), total hardness (TH ≥ 600 mg/L) and nitrate (NO3 ≥ 45 mg/L), attributed to an interaction between the leachate and groundwater samples near the core zone. Remaining parameters were well below their respective drinking water quality standard limit. The Sodium absorption ratio (SAR), Residual sodium carbonate (RSC) and percent sodium values illustrated the suitability of groundwater samples for agricultural practices. Though cluster analysis specified some sort of interaction to exist between leachate and few groundwater samples, analytical outcome of groundwater quality were against such interaction. Average concentration for various parameters in ground water samples were not much affected with leachate interaction. The unsuitability of groundwater for drinking purpose, removal of excess concentration and artificial recharge of groundwater by rainwater harvesting methods could reduce the groundwater pollution level.
Copy the following to cite this article:
Ravikumar P, Shridhar D. M, Prakash K. L. Assessment of Leachate Contaminated Groundwater Quality near Mandur Solid Waste Dumping Site, Bangalore. Curr World Environ 2020; 15(2). DOI:http://dx.doi.org/10.12944/CWE.15.2.06
Copy the following to cite this URL:
Ravikumar P, Shridhar D. M, Prakash K. L. Assessment of Leachate Contaminated Groundwater Quality near Mandur Solid Waste Dumping Site, Bangalore. Curr World Environ 2020; 15(2). Available from: https://bit.ly/30Ab2mo
Download article (pdf)
Citation Manager
Publish History

Introduction
In recent past, groundwater has become a foremost source of fresh water in India as evidenced by 61% of net irrigation and 60% of the irrigated crop production by ground water in the country in addition to 80% of the rural, and 50% of the urban and industrial requirements in India.1 Hence, the increased dependency of ground water and unobstructed withdrawal of ground water for irrigation purpose in arid and semi-arid regions in India has utterly curtailed the aquifers during the last four decades at one side.2 On the other hand, the groundwater pollution occurs quite certainly due to the existence of a negligible and undesirable constituent, pollutant or toxin in the ground water, through various man-made activities such as on-site sanitation systems, effluent from wastewater treatment plants, dripping sewers, petrol filling stations, landfills, or from over- application of fertilizers in cultivation besides natural arsenic or fluoride. Landfills and/or open dumping yards were the common practice for MSW disposal all over the world3 because of the relatively low-cost involvement and low-technical requirement.4 According to a study,5 total dumping rate across the globe was around 1.3 billion tonnes per annum and are projected to enhance to roughly 2.2 billion tonnes per annum by 2025. Additionally, a substantial quantity of around 30,000 and 50,000 tonnes of waste in a day respectively are reported to get generated in metro- and class 1 cities across India.
Alternatively, Leachate originating gradually from these solid waste dumping sites and its surrounding area has a greater possibility and potential to contaminate groundwater 6 -14 as they might have got loaded with organic and inorganic substances as their decomposition by-products.15,16 This has contributed to surface water contamination during rainy season followed by underground water contamination, majorly due to percolation of leachate resulting due to unscientific dumping in major cities/countries across the world.17, 18 Municipal / commercial and industrial solid wastes comprising hazardous substances, could rise the health hazards deriving from the leachate and landfill gases19 to local users (with children being more susceptible) and to the natural environment20 as well as social well-being. As a consequence, the effect of leachate on the surface and ground water has risen in the attraction of several studies in recent years.21 – 26 A exhaustive analysis is a pre-requisite to arrive at a sustainable and possible solution for mitigating the groundwater pollution due to solid waste disposal. This includes methods of waste disposal, characterization of leachate and groundwater quality, groundwater flow, lithological variation, and contaminant transport modelling, health and social issues of the people depending on the contaminated water, etc.27 If the leachate from Landfill sites are not systematically and scientifically collected, treated and securely disposed of, it may penetrate through soil reaching underground aquifers, acting as key sources of contamination for ground and surface water resources. This has claimed for stringent implementation of action plans for the protection of both surface and groundwater from getting contaminated with leachate percolation from open dump/landfill site. So, the present study concentrated on the characterization of leachate from abandoned Mandur landfill sites, Bangalore East taluk, Bangalore district, Karnataka and its influence on the ground water quality.
Study Area
Mandur village being part of Bangalore East Tehsil of Bangalore urban district in Karnataka, India, situated 15km away from sub-district headquarter Bangalore East, as well as district, headquarter Bangalore. The total geographical area of Mandur village is 527.07 hectares and its geographical location is 13.0829° N and 77.7381° E. Mandur has a total population size of 2,295 of which 1170 are males while 1125 are females as per Population Census 2011. There are around 533 households in Mandur village. Mandur village has a higher literacy rate compared to Karnataka. In 2011, the literacy rate of Mandur village was 82.16 % compared to 75.36 % of Karnataka. In Mandur Male literacy stands at 88.86 % while the female literacy rate was 75.23 %.
Mandur landfill site spread over 135 acres in Mandur village and garbage dumping was started during 2008 and dumping was stopped on 1st December 2014 after the protest by the villagers and environmentalists during 2014. Overall, the dump site was active nearly for six years and during which it received dumping of 1,800 tonnes of garbage out of, ~ 4,000 tonnes of waste generated per day in Bangalore city alone.
 |
Figure 1: Study area map showing groundwater and dumpsite location Click here to view Figure |
The major crops of Paddy, Ragi, Jowar, Bajra, Maize and Wheat were cultivating in the area besides pulses like Gram and Tur, oilseed like sunflower and groundnut, varieties of fruits and vegetables. Majority of the rainfall is contributed by Sout-west monsoon followed by North-east monsoon besides pre-monsoon showers. In general, district witness hot humid to semi-arid climatic conditions, with average temperature of ~ 23.1ËšC. Bangalore east taluk experienced an annual and seasonal normal rainfall of around 911mm.28 Red loamy and sandy soils are mainly seen in the Mandur village. Granitic and peninsular gneisses type of rocks underline major aquifers in the urban district. Ground water can be seen under phreatic / unconfined conditions and under semi-confined to confined conditions respectively in the weathered zone and fractured and jointed rock establishments; whose depth being more in the valley, can range up to 30 m in the shallow wells. The occurrence of Groundwater movement and recharge to aquifers is mainly under the control of several factors like fracture pattern and their degree of weathering, geo-morphological setup and amount of rainfall received. As per CGWB (2012) report, the depth to water levels vary between 5-10 mbgl and 2-5 mbgl respectively for pre- and post-monsoon seasons for Bangalore East taluk.
Methodology
The Preliminary survey was made out to identify the sampling point around the landfill site area. Overall 27 ground water samples were collected randomly from the places such as Mandur, Hittarahalli, Thiramanahalli, Budigere gate, Bidarahalli, Gundur, Huskur, Shringurapura; which fall under Mandur gram panchayath during April 2018 (Fig 1). Standard APHA Methods29 were employed during the collecting, preserving and transporting the ground water and leachate samples to laboratory. The quality of leachate and ground water was evaluated by analyzing physical and chemical characteristics; with field parameters such as pH, total dissolved solids, electrical conductivity being assessed in the field using HACH HQ30d multiparameter kit. Sodium and potassium were determined by flame photometric method (Systronics-128 model). Parameters like total hardness, total alkalinity, Calcium, Magnesium, bicarbonate and Chloride were determined by titrimetric method. SO4, NO3 and PO4 were analysed by spectrophotometric method using Visible spectrophotometer (SL-171 model). Fluoride was analysed by SPADN’s method using HACH DR/890 colorimeter. The details of standard methods employed for physico-chemical analysis of groundwater and leachate samples along with BIS permissible limit for drinking water30 and the analytical results are given in Table 1. Further, irrigational quality of groundwater was assessed by calculating parameters like SAR, percent sodium and RSC values. Statistical analysis like correlation and cluster analysis was performed using Minitab v15 software.
Results and Discussion
The analytical results of the ground water sample were presented in Table 1. Simultaneously, Correlation analysis was also performed to establish relationships between analysed parameters as variables (Table 2).
In the study area, the pH value ranged between 6.4 to 8.9, with a mean value of 7.5, while the pH of the leachate was found to be 8.4. The alkaline nature of leachate is an indicator of the mature stage of the dumping site.31 Four groundwater samples displayed pH above the BIS standard limit of 6.5-8.5 and one sample below the standard limit. The present study the pH is directly correlated with alkalinity, bicarbonate, and fluoride due to the high concentration of these parameter leads to increases in pH. The HCO3 is an alkaline buffering substance found in dentifrices, it indirectly affects the fluoride in the groundwater leads to the water turns to an alkaline condition.
Electrical conductivity in groundwater ranged from 290 to 1870 µS/cm (mean: 853.7 µS/cm) while it was 5160 µS/cm in the leachate sample. Seven groundwater samples showed higher electrical conductivity of over 1000 µS/cm. The high amount of the salt content present in the groundwater leads to the increases in the conductivity value. The Electrical conductivity is directly correlated with the TDS, Total hardness, Ca, Mg, Cl, Alkalinity, HCO-3, K+, PO43- and SO-4 (Table 2). Exceptionally high values for conductivity (viz., salt concentration) in the water is attributable to high levels of cations and anions such as potassium, chloride, sodium, sulphate, nitrate, etc. The cations and anions strongly correlated with the conductivity in the present study, illustrating good inter-relationship.
The total dissolved solids values exceeded the BIS desired limit of 500 mg/L in nine groundwater samples, as it extend from 185.6 to 1196.8 mg/L (mean: 546.4 mg/L) in the study area. Leachate samples showed very high TDS value of 3302.4 mg/L. Total dissolved solids are correlated with the TH, Ca, Mg, Cl, Alkalinity, HCO3, K+ and SO-4 (Table 2). The presences of the high inorganic ion in the groundwater lead to TDS values. The present of the salts and the rock structure in the aquifer is the main source of the entry of all the inorganic salts and ions concentration in the groundwater.
Total hardness values (viz., 110 to 700 mg/L; mean: 302.6 mg/L) exceeded the BIS standard limit of 600 mg/L in four groundwater samples while that of leachate sample was around 1994 mg/L. Total hardness is directly correlated with the Ca, Mg, Alkalinity, HCO-3, K+ and SO-4 content in the groundwater (Table 2). The inorganic salts and cations concentration are the main sources of the hardness in the groundwater. The main Ca and Mg ions form the complex in the groundwater result in increases in the salt concentration in the water. The bicarbonate, K+, SO‑4 are the predominance source of the hardness of the water in the ground.Total Alkalinity value vary from 30 to 320 mg/L (mean: 137.4 mg/L) in groundwater samples against 1570 mg/L in the leachate sample. Alkalinity is correlated with Bicarbonates, K+, PO43- and SO4- (Table 2). Alkalinity is mainly caused by carbonate, bicarbonate, and hydroxyl ions besides biodegradation processes of organic matter contributing to substantial amount of bicarbonate and inturn alkalinity.
Calcium and magnesium concentrations respectively vary between 24.0 to 172.0 mg/l (mean: 71.8 mg/L) and 5.6 to 84.2 mg/L (mean: 30.0 mg/L). Leachate samples showed higher calcium and magnesium concentration of 464 and 203.5 mg/L respectively. Both Calcium and magnesium concentration is directly correlated with Alkalinity, HCO3-, Cl, PO43-, K+, and SO4- (Table 2). Sodium and potassium concentration ranged between 14.0 to 441.5 mg/L (mean: 50.1 mg/L) and 0.6 to 5.8 mg/L (mean: 2.3 mg/L) against high sodium (viz., 213.96 mg/L) and potassium (viz., 220.62 mg/L) in leachate sample. Sodium is directly correlated with the SAR and % sodium in the water. The Sodium absorption ration and sodium percentage are a degree the relative proportion of sodium ion hazard in irrigation water, as the sodium ions tend to get rapted by clay particles, dislodging Mg2+ and Ca2+ ions in them, finally shrinking soil permeability along with insufficient inner drainage.
Concentration of Chloride and bicarbonate respectively ranged from 30.6 to 265.4 mg/L (mean: 109.7 mg/L) and 36.6 to 390.4 mg/L (mean: 167.6 mg/L). In the leachate sample, these parameters witnessed a very high concentration of 1570 and 1915.4 mg/L respectively. Chloride is directly correlated with K+ and SO-4. Fluoride levels ranged from BDL to 0.3 mg/L (mean: 0.1 mg/L) while phosphate level was 0.3 to 1.5 mg/l (mean: 0.7 mg/L). Leachate sample was rich in phosphate levels of 297.21 mg/L and sulphate level of 226.51 mg/L. In contrast, nitrate concentration ranged from 5.1 to 84.3 mg/L (mean: 61.8 mg/L), with 22 samples witnessing higher nitrate value above 45 mg/L. Leachate sample too showed higher nitrate value of 106.45 mg/L. Sulphate concentration ranged from 4.9 to 105.4 mg/L (mean: 45.9 mg/L) in groundwater samples.
Table 1: Analytical methods used, BIS standard limits and Descriptive statistics of analysed physico-chemical parameters
|
Parameters |
Analytical Methods used |
BIS permissible limit for drinking water |
Unit |
Groundwater samples |
Leachate sample |
|||
|
Mean |
SD |
Min |
Max |
|||||
|
pH |
Electrode |
6.5-8.5 |
-- |
7.52 |
0.65 |
6.39 |
8.9 |
8.40 |
|
E C |
Electrode |
3000 mS/cm |
µS/cm |
853.7 |
430.48 |
290 |
1870 |
5160 |
|
TDS |
Gravimetric |
2000 mg/L |
mg/L |
546.37 |
275.5 |
185.6 |
1196.8 |
3302.4 |
|
Total hardness |
EDTA method |
600 mg/L |
mg/L |
302.59 |
177.6 |
110 |
700 |
1994 |
|
Total Alkalinity |
titrimetric method |
600 mg/L |
mg/L |
137.41 |
72.04 |
30 |
320 |
2970 |
|
Ca |
EDTA titration and Calculation |
200 mg/L |
mg/L |
85.9 |
84.9 |
24 |
464 |
42.58 |
|
Mg |
EDTA titration and Calculation |
75 mg/L |
mg/L |
36.2 |
38.4 |
5.6 |
203.5 |
460.56 |
|
Cl |
Argentometric method |
1000 mg/L |
mg/L |
109.65 |
70.14 |
30.62 |
265.44 |
408.38 |
|
NO3 |
Phenol disulphonic acid method |
45 mg/L |
mg/L |
61.79 |
26.44 |
5.07 |
84.32 |
106.45 |
|
HCO3 |
Calculation |
---- |
mg/L |
167.64 |
87.88 |
36.6 |
390.4 |
3623.4 |
|
F |
SPANDS Method |
1.5 mg/L |
mg/L |
0.08 |
0.09 |
0 |
0.29 |
ND |
|
Na+ |
Flame photometry |
200 mg/L |
mg/L |
50.05 |
79.32 |
13.98 |
441.52 |
213.96 |
|
K+ |
Flame photometry |
10 mg/L |
mg/L |
2.3 |
1.14 |
0.63 |
5.8 |
220.62 |
|
PO4 |
Stannous chloride method |
0.3 mg/L |
mg/L |
0.66 |
0.22 |
0.29 |
1.5 |
297.21 |
|
SO4 |
Barium chloride |
400 mg/L |
mg/L |
45.86 |
28.3 |
4.9 |
105.45 |
26.51 |
|
SAR |
Calculation |
< 10 |
-- |
1.34 |
2.14 |
0.43 |
11.91 |
2.08 |
|
Percent sodium |
Calculation |
< 60 |
% |
24.35 |
13.77 |
9.79 |
78.5 |
16.97 |
|
RSC |
Calculation |
2.51 epm |
meq/L |
-3.30 |
3.03 |
-10.01 |
0.4 |
19.49 |
 |
Table 2: Output of Correlation matrix analysis using groundwater analytical data Click here to view Table |
Cluster Analysis
All the parameters analysed for groundwater and leachate samples were fed into statistical software to construct a Dendrogram. The cluster analysis yielded three clusters as shown in Figure 2, with samples having a similar source of origin grouped under the same cluster.
In Cluster 1 with highest percentage of samples (viz., 66.67 %), calcium (mean value: 106 mg/l) and sodium (mean value: 22.4 mg/l) were dominant cations and, bicarbonates (mean value: 122 mg/l) and chloride (mean value: 30.62 mg/l) being dominant anions. Mean Nitrate concentration in this cluster was found to be 79.84 mg/L while the mean total hardness value was 332.8 mg/L. Alternately, the mean value of EC and TDS values for this cluster were found to be 966.7 µS/cm and 618.7 mg/L.
In Cluster 2 with second-highest percentage of samples (viz., 29.63 % excluding leachate sample), calcium (mean value: 52.3 mg/l) and sodium (mean value: 29.5 mg/l) were dominant cations and, bicarbonates (mean value: 215 mg/l) and chloride (mean value: 63.8 mg/l) being dominant anions. Mean Nitrate concentration in this cluster was found to be 49.8 mg/L while the mean total hardness value was 235.0 mg/L. Alternately, the mean value of EC and TDS values for this cluster were found to be 655.0µS/cm and 419.2 mg/L.
Cluster 3 with only one sample (3.70%) followed a similar trend for dominant cations and anions was observed. Calcium (mean value: 106.0 mg/l) and sodium (mean value: 22.74 mg/l) were dominant cations and, bicarbonates (mean value: 122 mg/l) and chloride (mean value: 30.62 mg/l) being dominant anions. Mean Nitrate concentration in this cluster was found to be 79.84 mg/L while the mean total hardness value was 300 mg/L. Alternately, the mean value of EC and TDS values for this cluster were found to be 410 µS/cm and 262.4 mg/L.
It is apparent from the Dendrogram and ionic pie charts (Fig 2) that samples under cluster 1 are considered to have deteriorated groundwater quality compared to that under clusters 2 and 3. Despite Dendrogram showing a relationship between groundwater samples under cluster 2 with leachate sample, groundwater quality in these samples is not much affected as revealed by their analytical results, illustrating no known impact of leachate on the groundwater quality.
 |
Figure 2: Dendrogram showing the distribution of ionic concentrations among clusters of samples |
Groundwater Suitability
The irrigational suitability of groundwater was evaluated by calculating sodium absorption ratio (SAR), Percent sodium and residual sodium carbonate (RSC). The results are tabulated in Table 1. The SAR value of all the samples was found to be less than 1032 and are classified as excellent for irrigation (Fig 3) except for the sample, S25. RSC values also exhibited the suitability of ground water samples for irrigation as these values were lesser than 1.25 meq/L (Fig 3). Further, the distribution of ground water samples based on sodium percentage is shown in Fig 4 and all the samples fall under safe class based on Eaton’s classification,33 except for sample S25.
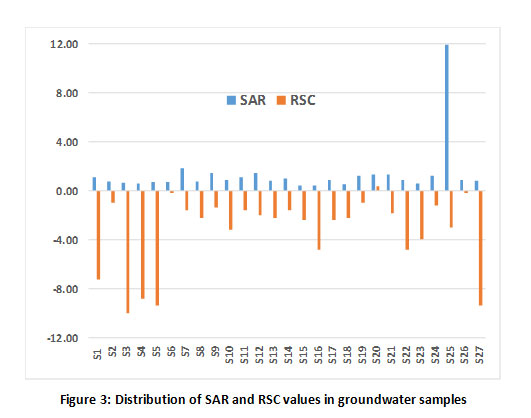 |
Figure 3: Distribution of SAR and RSC values in groundwater samples Click here to view Figure |
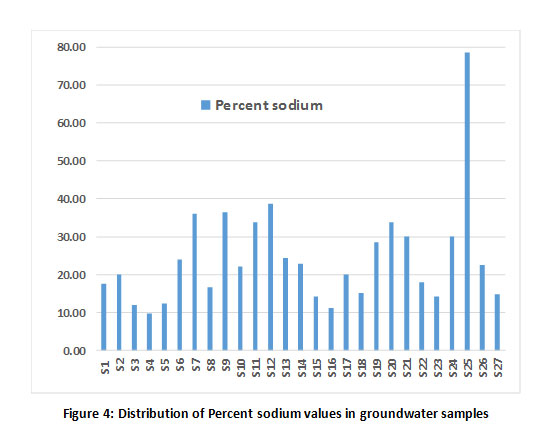 |
Figure 4: Distribution of Percent sodium values in groundwater samples Click here to view Figure |
Conclusion
The analytical results of groundwater samples of Mandur village were indicated that some of the samples were not fit for drinking due to presence of higher concentration for some parameters (viz., pH, Electrical Conductivity, TH, TDS and NO3) above the BIS prescribed permissible limits.30 It was also observed that the nitrate levels in the majority of the groundwater samples were slightly higher than the permissible limit of 45 mg/L, possibly an indication of the impact of leachate percolation. But, the groundwater can be used for agricultural practices as revealed by irrigational quality parameters like SAR, RSC and percent sodium. To overcome the problem of the unsuitability of groundwater for drinking purpose, artificial recharging of groundwater by rainwater harvesting methods could reduce the pollution level of groundwater in the surrounding areas. Further, statistical analysis like cluster analysis indicated that there exists interaction between leachate and few ground water samples in the study area. Despite this, water quality of the analysed groundwater samples is not much affected as revealed by their mean concentration for various parameters in comparison to parameters analysed in the leachate sample. Regular monitoring of the groundwater should be encouraged to avoid possible consumption of contaminated foodstuff and drinking water. It is also suggested for removal of excess concentrations before using for drinking purpose to overcome the water scarcity in the area.
Acknowledgement
Authors acknowledge to Department of Environmental Science, Bangalore University for the extended laboratory facilities and support during the studies.
Funding
The author(s) received no financial support for the research, authorship, and/or publication of this article.
Conflict of Interest
Authors acknowledge to Department of Environmental Science, Bangalore University for the extended laboratory facilities and support during the studies.
References
- Mall, R. K., Bhatia, R., Pandey, S. N. Water resources in India and impact of climate change. Jalvigyan Sameeksha, 22: 2007, 157–176.
- CGWB. 2009. Groundwater scenario of India 2009–10; Central Ground Water Board, Faridabad, MoWR, GoI, pp.1–46.
- Nagendran, R., Selvam, A., Joseph K., Chiemchaisri, C. 2006. Phytoremediation and rehabilitation of municipal solid waste landfills and dumpsites: a brief review. Waste Manage, 26, 1357–1369.
- Vaverková, 2019. Landfill Impacts on the Environment—Review. Geosciences, 9, 431; DOI: 10.3390/geosciences9100431.
- Daniel Hoornweg and PerinazBhada-Tata. 2012. What a Waste: A Global Review of Solid Waste Management. Work Bank - Urban Development Series no. 15, pp 116.
- Fatta, D., Papadopoulos, A., Loizidou, M., 1999. A study on the landfill leachate and its impact on the groundwater quality of the greater area. Environ. Geochem. Health, 21, 175–190.
- Tian, Y.J., Hang, R.H., Yang, H., Zhou, H.Y., Li, D.T., 2005. Pollution on groundwater systems by the leachate from a seashore waste landï¬ll site. Environ. Sanit. Eng,13,1-5.
- Marzougui, A., Mammou, A.B., 2006. Impacts of the dumping site on the environment: a case of the Henchir El Yahoudia Site, Tunis, Tunisia. Compt. Rendus Geosci, 338, 1176–1183.
- Gao, H.Q., Fan, Y.E., Ding, W.P., Wang, X.L., 2009. Study on groundwater pollution in daily solid waste landï¬ll. Water Resource. Prot, 25, 61–64.
- Alslaibi, T.M., Mogheir, Y.K., Aï¬ï¬, S., 2011. Assessment of groundwater quality due to municipal solid waste landï¬ll leachate. J. Environ. Sci. Technol, 4, 419–436.
- Azims, M.D., Mahabubur, R.M., Riaz, H.K., 2011. Characteristics of leachate generated at landï¬ll sites and probable risks of surface and groundwater pollution in the surrounding areas: a case study of Matuail landï¬ll site, Dhaka. J. Bangladesh Acad. Sci, 35, 153–160.
- Akinbile, C.O., 2012. Environmental impact of landï¬ll on groundwater quality and agricultural soils in Nigeria. Soil Water Res, 7, 18–26.
- Regadío, M., Ruiz, A.I., and Soto, I.S., 2012. Pollution profile and physicochemical parameters in old uncontrolled landï¬lls. Waste Manag, 32, 482–497.
- Smahi, D., Hammoumi, O.E., and Fekri, A., 2013. Assessment of the impact of the landï¬ll on groundwater quality: a case study of the Mediouna site, Casablanca, Morocco. J. Water Resour. Prot, 5, 440–445.
- Calvo F, Moreno B, Zamorano M, and Szanto M 2005. Environmental diagnosis methodology for municipal waste landfills. Waste Manage, 25,768–779.
- Magda M. Abd El-Salam, Gaber I. Abu-Zuid. 2015. Impact of landfill leachate on the groundwater quality: A case study in Egypt. J. of Advanced Res, 6(4), 579–586.
- Lo, I. M. C. 1996. Characteristics and treatment of leachates from domestic landfills. Environment International, 22, 433–442.
- Mor, S., Ravindra, K., Dahiya, R. P., and Chandra, A. (2006). Leachate characterization and assessment of groundwater pollution near a municipal solid waste landfill site. Env. Monit and Assesst, 118, 435–456.
- Erses AS, Fazal MA, Onaya TT, and Craig, W.H. 2005. Determination of solid waste sorption capacity for selected heavy metals in landfills. J Hazard Mater, B121, 223–232.
- Esakku S., Karthikeyan O. P., Joseph K., Nagendran R., Palanivelu K., Pathirana K. P. M. N., Karunarathna A. K. and Basnayake B. F. A. 2007. Seasonal variations in leachate characteristics from municipal solid waste dumpsites in India and Sri Lanka. Proceedings International Conference on Sustainable Solid Waste Management. Chennai, India, 341–347.
- Flyhammar, P. 1995, Leachate quality and environmental effects at active Swedish municipal landfill, in: R. Cossu, H. T. Christensen and R. Stegmann (eds) Regulations, Environmental Impact and Aftercare. Proceedings Sardinia ’95, Fifth International Landfill Symposium, Vol. III, Sardinia, Italy, pp. 549–557.
- De Rosa, E., Rubel, D., Tudino, M., Viale, A., and R.J. Lombardo, 1996. The leachate composition of an old waste dump connected to groundwater: Influence of the reclamation works. Environ. Monit. Assess, 40 (3), 239-252.
- Christensen, J. B., D. L. Jensen, C. Gron, Z. Filip and T. H. Christensen, 1998.Characterization of the dissolved organic carbon in landfill leachate-polluted groundwater, Water Res, 32, 125-135.
- Looser, M.O., A. Parriaux, and M. Bensimon, 1999. Landfill underground pollution detection and characterization using inorganic traces. Water Res, 33, 3609-3616.
- Abu-Rukah, Y. and O. Al- Kofahi, 2001. The assessment of the effect of landfill leachate on groundwater quality - a case study. El-Akader landfill site—north Jordan, Arid Environ, 49, 615-630.
- Saarela, J., 2003. Pilot investigations of surface parts of three closed landfills and factors affecting them. Environ. Monit. Assess, 84,183-192.
- Bashir MJK, Isa MH, Kutty SRM, Awang ZB, Abdul Aziz H, Mohajeri S. 2009. Landfill leachate treatment by electrochemical oxidation. Waste Manage, 29, 2534-2541.
- CGWB (2012). Central Ground Water Board: Ground Water Information Booklet - Bangalore Urban District, Karnataka, South Western Region, Bangalore, Government of India, Ministry of Water Resources.
- APHA. 2012. Standard methods for the examination of water and wastewater, 22nd edition. Washington: American Public Health Association.
- BIS, 2012. Bureau of Indian Standards – BIS: 10500-2012. Drinking water-specification. New Delhi: Second Revision. Government of India.
- Jorstad LB, Jankowski J, and Acworth R.I. 2004. Analysis of the distribution of inorganic constituents in a landfill leachate-contaminated aquifer: Astrolabe Park, Sydney, Australia. Env. Geology, 46, 263-272.
- Todd, D. K. 1959. Groundwater Hydrology. John Wiley and Sons. p.535.
- Eaton FM 1950. Significance of carbonates in irrigated waters. Soil Sci, 69, 127–128.


