Bioaccumulation Kinetics and Bio Concentration Factors of Few Polychlorinated Biphenyls: A Study on Freshwater Fish Puntius ticto
Advait Bhagade 1
*

http://dx.doi.org/10.12944/CWE.15.2.16
The present work aims to understand the bioaccumulation kinetics and bioconcentration factors (BCF) of the Polychlorinated Biphenyls (PCBs) PCB 126 and PCB 169 in tissues of fish Puntius ticto. A continuous fed system was used to carry out the study. Bioconcentration in the tissues of the fish has been summarised using a first order uptake model. Fish were exposed to the PCBs continuously for a period of 30 days and this exposure has been used to calculate the steady state of BCF. The gill tissue of P. ticto showed a maximum rate of bioaccumulation of 30.61 μg g-1 wet weight for PCB 169 and 19.91 μg g-1 wet weight for PCB 126 respectively. In this study, the regression coefficients (R2), were found to vary between 0.736 and 0.97. This is indicative of a good to high correlation between the PCB concentration and exposure time. Prediction of the Octanol water partition coefficient (Kow) has been carried out to demonstrate the hydrophobic property of PCB compounds and their attraction towards lipid. The actual calculated BCF values have been used to predict the Kow values. Results indicate that it is possible to correlate the Kow values with both the lipid content of the tissue and the exposure time, in case of either PCB, and that the burden of PCB differs from one tissue to another.
Copy the following to cite this article:
Bhagade A. Bioaccumulation Kinetics and Bio Concentration Factors of Few Polychlorinated Biphenyls: A Study on Freshwater Fish Puntius ticto. Curr World Environ 2020; 15(2).
DOI:http://dx.doi.org/10.12944/CWE.15.2.16Copy the following to cite this URL:
Bhagade A. Bioaccumulation Kinetics and Bio Concentration Factors of Few Polychlorinated Biphenyls: A Study on Freshwater Fish Puntius ticto. Curr World Environ 2020; 15(2). Available from: https://bit.ly/32jM37X
Download article (pdf)
Citation Manager
Publish History

Introduction
The discovery of residues of xenobiotic compounds in tissues of fish and other aquatic organisms since the early 1960s caused increased attention of the scientific fraternity towards their bioaccumulation in living organisms. It is possible to predict what happens to such substances in the environment by comparing the extent to which they accumulate in living systems in comparison with the medium in which they exist. It is also possible to determine and compare the extent of concentration of such compounds in the bodies of living organisms. As is the case with other substances foreign to bodies of organisms, the PCBs too react with tissue lipids in the organisms and may destroy the tissue in which they have accumulated, in the long term. Literature shows that tissue lipid is an important determinant for concentration of PCB in fishes.1 These substances not only accumulate, but also may pass along various food chains, as is indicated by their accumulation in tissues of bird.2
The biotic as well as abiotic degradation of such substances and their bioaccumulation potential in aquatic organisms serves as an important factor for indicating environmental damage, in addition to the toxicity caused by xenobiotics.3, 4 Various factors such as differing feeding habits, habitat, and different capacities of aquatic organisms to biotransform the xenobiotic substance at different trophic levels of food chains, as well as the molecular weight of the compound itself, may result in variable bioaccumulation of PCB in aquatic organisms, as is indicated by different concentrations of such substances found in their tissues.5
Pollutants in nature may not always be individual compounds. Rather, it is the mixtures of different compounds that are found to pollute the environment. More literature is available on the toxic effects of the toxicity of such mixtures on organisms than that of individual compounds that are constituents of such mixtures. Aroclor® mixtures of numerous PCBs have been frequently used to identify and quantify PCBs in environmental or biological samples, while only few data are available on the effect of individual congeners on organisms.6
Several workers have therefore advocated the use of congener specific analysis rather than the use of mixtures.7-10
The BCF (Bioconcentration factor) is indicative of the extent to which a chemical may tend to accumulate in an aquatic animal. Standardized protocols are available for assessment of BCF in fish. Moreover, fish are an important source of proteins in the food of man. Due to these reasons, they are most preferred as test organisms for assessment of BCF.
The BCF is helpful in establishing the hydrophobicity of a chemical. Reviews as well as reports of different proposals for calculation of BCF are available in literature11 BCFs for heavy metals such as chromium and lead using the fish Colisa fasciatus as a test organism.12, 13 Bioaccumulation of various chlorinated pesticides, and their estimation in different fish tissues have also been studied.14 In addition, P. ticto (Ham.) has been used to calculate and report the bioaccumulation kinetics and bioconcentration factor of chlorinated pesticides in its tissues.15 Bioaccumulation of Polyaromatic Hydrocarbons (PAHs) and the estimation of their bioconcentration kinetics and BCF have been studied in tissues of Rasbora daniconius [16] and Puntius ticto.17 Similar study has been conducted for PCB congeners on tissues of Rasbora daniconius.18
Various leading organisations for assessing environmental damage appear to employ different standards for determining how hazardous a chemical might be for the environment. The EU (European Union) has classified any chemical with a BCF value of more than 100 on a wet-weight basis, as “dangerous to the environment” with a potential to bioaccumulate because it could impair the health of an organism or that of the organisms feeding upon it. The European Commission, the administrative directorate of the EU, has recommended a BCF value that exceeds 100, as a ‘trigger’ for classification of a chemical as being hazardous. On the other hand, the USEPA considers BCF values exceeding 1000 as ‘triggers for high concern’ for potential effects of bioaccumulation.19 Chemicals with BCF values of more than 500 are considered as ‘hazardous’ by Canada, whereas those more than 5000 have been classified as being indicative of bioaccumulation. Such chemicals have therefore been recommended for “virtual elimination”.20 Guideline values of 0.67 ng g-1for human consumption have also been given by some workers.21
The literature available shows that developed countries have done more work on the bioconcentration of PCBs as compared to other countries. Lesser such work on the PCBs and their fate is available for the Indian environment. Whole fish are consumed in many parts of India and are also fed upon by other predatory animals including birds, although fish muscle is the most preferred portion for edible purposes. Due to this reason, it is advisable to thoroughly analyse all parts of fish before consumption by man. Hence, detailed study on bioaccumulation of PCBs in whole fish becomes important in relation to the environment. With this in view, the present study attempts the examination and determination of distribution of PCBs in various organs and their bioconcentration kinetics. Two PCB congeners: PCB 126 and PCB 169, i.e. 3,3’,4,4’,5- pentachlorobiphenyl and 3,3’,4,4’,5,5’- hexachlorobiphenyl respectively have been used in this study for determination of their bioconcentration kinetics and BCF in the gill, liver, intestine and kidney tissues of the freshwater fish P. ticto.
Bioconcentration Kinetics
For non-biodegradable chemicals, process of bioconcentration can generally be interpreted as a passive partitioning of the chemical among body lipids of the organism and the water surrounding it. The process can thus be aptly described as a ‘first-order two-compartment (water and aquatic organism) model’. Conventionally, the uptake, and the subsequent elimination, of a persistent chemical by fish or by other aquatic organisms, can be described by Equation (1) below.

Where
k1 is the uptake rate constant, day-1
CW is the chemical concentration in water, mg g-1
k2 is the elimination or depuriation rate constant, day -1
CF is the chemical concentration in fish, mg g-1.
At steady state,

Equation (2) can be used to calculate the BCF value.

Estimating the bcf
For estimating the BCF, the test organisms, P. ticto in this case, have to be exposed for an appropriate period to a constant chemical concentration in water, using of a continuous flow through system, till they attain a steady state. In reality, in case of many hydrophobic chemicals, any short duration of exposure is not sufficient to achieve such an ideal steady state. Therefore, the kinetic approach remains the only available method to estimate such a ‘real’ BCF value.
Materials and Methods
Experimental organisms, i.e. the test fish required for the experiments, were obtained from nearby fresh water bodies. The PCB congeners: PCB 126 and PCB 169 of ‘Dr. Ehrenstorfer’, Germany make were used for the present study, whereas Dichloromethane was used as a solvent.22 An indigenously designed constant dosing device was used to expose the fish to PCBs and carry out continuous bioassay studies as per standard practice.23 Appropriate controls were also maintained. The dilution water used for the experiment was dechlorinated, the characteristics of which are given in (Table 1).
Standard Methods24 were used to analyse the physico-chemical parameters of water. A thermo trace ultra Gas Chromatograph (GC) of ‘Thermo Fisher Scientific Instruments, San Jose, CA95134, U.S.A.’ make, with an electronic flow control (EFC), and equipped with a Thermo Fisher Scientific TSQ Quantum GC triple quadrupole Mass Spectrometer (MS) was used for estimation of the PCB concentration in different tissues over different periods of exposure. Standard procedures using chromatography as an analytical tool, as stated in literature, were followed.25
Table 1: Characteristics of Dilution Water
|
Parameters |
Values * |
|
Temperature º C |
25-27 |
|
pH |
7.5-8.2 |
|
Total Alkalinity as CaCO3 |
156-190 |
|
Total Hardness as CaCO3 |
142-172 |
|
Ca Hardness as CaCO3 |
80-94 |
|
Mg Hardness as CaCO3 |
62-78 |
|
Dissolved Oxygen |
6.9-7.3 |
|
Calcium as Ca |
32-38 |
|
Magnesium as Mg |
14-18 |
|
Sodium as Na |
36-38 |
|
Potassium as K |
2-4 |
|
Chloride as Cl |
126 |
|
*All values mentioned above, except temperature and pH, are in mg l-1. |
|
Tissue Extraction
PCB was extracted from weighed samples of gills, liver, intestine and kidney from the fish was carried out individually, dichloromethane as a solvent, as mentioned in standard procedures. PCBs are co-extracted, along with other organic compounds. An appropriate clean-up procedure is therefore needed to remove any other organic compounds in order to prevent their interference in the correct estimation of the PCB content. Such clean up procedures require any suitable filter aid, such as activated charcoal, silicic acid, Celite, florisil, alumina, etc. properly packed in a glass column. These filter aids are generally silicates which help in selective adsorption. A column packed with a suitable filter aid is able to retain all interfering compounds, including lipids, and only the PCBs are eluted from the column. The present study was carried out using Celite 545 filter aid of Koch Laboratories, U.K. make.26 Celite 545 is a white to off white coloured powder, which is purified and flux calcined diatomaceous earth, having molecular formula CNa2O3.
300 mm long and 10 mm wide glass columns having stop cocks at one end were used. For each column, 2 g of Celite was acidified using 1.2 ml of 0.5 M H2SO4 with constant stirring in a glass beaker till the complete Celite was moistened. Slurry of the Celite was prepared by adding 20 ml of a mixture of Acetone and Hexane in a proportion of 10:90 to the moistened Celite with constant stirring for 2-3 hours. A small plug of glass wool, washed thoroughly in acetone, was first pressed into the end of the glass column. The slurry of Celite so prepared was then gradually packed tightly above the plug by pressing flattened end of a glass rod on it, till a column of appropriate height was obtained. 1g of anhydrous sodium sulphate was added to the top of this column to remove any trace of moisture from the tissue extract.
Many columns were packed in this manner. Each column was then washed with n-hexane for removing all traces of acetone. A fresh column was used in case of each tissue extract. Tissue extracts were obtained after thorough blending in dichloromethane. They were transferred into the column slowly. The outflow from the column was controlled with the help of the stopcock. Glass KD tubes were used to collect the eluate obtained from the columns. The column was washed at least 3-4 times with dichloromethane solvent after collecting the complete eluate to ensure that all PCBs in the extract were eluted successfully. 98-99% recovery of PCBs from the tissue samples is known to take place using this method. The eluate was allowed to reach a near-dry state. A known quantity of Dichloromethane was used to dilute the eluate for direct injection into the GC-MS. Other workers have also used this method of determination of PCB concentration, as indicated in literature.27 The residue concentration can be expressed in terms of of both lipid weight and wet weight.28
Experimental Details
Glass aquariums of 20 L capacity were used for carrying out the study, continuously for a period of 30 days. Dilution water was filled partially in the reservoir of the dosing unit. After addition of the required concentration of PCB, the volume in the reservoir was made up to 20L to obtain the PCB solution. The flow from the reservoir was adjusted in such a manner that 20 litres of such PCB solution flowed into the aquarium in 24 hours. 20 fishes were introduced in each aquarium at the commencement of the experiment. Concentration of PCB 126 used was 17.5 µl l-1 while that of PCB 169 was 25 µl l-1 for addition to the reservoir as above. Fresh solution was replaced in the reservoir and feeding was carried out as per procedure mentioned in literature.29 Fish were removed alive from the aquarium at 5-day intervals (5, 10, 15, 20, 25 and 30 days) for either PCB under study. Fish were then sacrificed and dissected. Tissues to be studied for bioaccumulation- gills, liver, intestine and kidney, were immediately removed and preserved in aqueous Buoin’s fixative at 4°C in the refrigerator. As per literature, the tissue can be preserved prior to sample extraction and cleanup, in either 4% formalin or in Buoin’s fixative [30]. Before carrying out extraction and clean up, the tissues from the fixative were thoroughly washed. They were weighed and thoroughly blended in a closed vessel using dichloromethane. The extract so obtained was then processed for further clean up through the Celite column as described above.
Results and Discussion
Bioconcentration and Organ Distribution
The concentrations of PCB 126 and 169 in four types of tissues studied in P. ticto at increasing time intervals, estimated by using GC-MS, are shown in Table 2.
Table 2: Concentration of PCB in tissues of P. ticto
|
PCB |
Exposure time, days |
Concentration of PCB, μg/g wet weight |
|||
|
GILL |
INTESTINE |
KIDNEY |
LIVER |
||
|
PCB 126 |
5 |
0.00 |
1.88 |
0.00 |
2.54 |
|
10 |
0.34 |
4.17 |
0.53 |
8.56 |
|
|
15 |
8.98 |
6.08 |
0.68 |
9.98 |
|
|
20 |
16.85 |
8.28 |
0.88 |
12.12 |
|
|
25 |
18.02 |
9.06 |
0.89 |
12.96 |
|
|
30 |
19.98 |
10.07 |
0.91 |
14.15 |
|
|
PCB 169 |
5 |
14.88 |
6.89 |
0.00 |
0.68 |
|
10 |
25.57 |
9.84 |
0.57 |
1.79 |
|
|
15 |
27.02 |
10.02 |
4.78 |
2.03 |
|
|
20 |
28.04 |
10.26 |
7.69 |
2.14 |
|
|
25 |
29.54 |
11.98 |
8.89 |
3.14 |
|
|
30 |
30.61 |
13.23 |
12.50 |
4.73 |
|
It was seen that from among the different tissues studied, the maximum accumulation of PCB 126 was found to be 19.98 μg g-1 wet weight in the gill tissue of P. ticto, followed by 14.15 μg g-1, 10.07 μg g-1 and 0.91 μg g-1 wet weight in liver, intestine and kidney tissues respectively, as compared to its aqueous concentration of 17.5 µl l-1.
On the other hand, maximum accumulation of PCB 169 was found to be 30.61 μg g-1 wet weight in gill tissue, followed by 13.23 μg g-1, 12.50 μg g-1 and 4.73 μg g-1 wet weight in intestine, kidney and liver tissues respectively, as compared to its aqueous concentration of 25 µl l-1.
From the above observations, it is seen that PCB 169 accumulates to higher extent in the gill, intestine and kidney tissue of P. ticto as compared to accumulation of PCB 126 in them.
The liver tissue accumulated more of PCB 126 as compared to the kidney tissue. However, a reverse trend was observed for PCB 169, which accumulated more in the kidney than in the liver tissue. Literature available reports that number of variables may be considered for deciding the rates of bioaccumulation.5 The above findings agree with the reports in literature. Results also conclusively indicate that a given compound can accumulate at different rates among different tissues, and that different compounds accumulate in a given tissue at different concentrations. It is also suggested in literature that factors other than just the lipophilicity of the compound and the fat content of the concerned tissue may be involved in accumulation in tissues.31 The relation between BCF, log BCF, and the calculated log Kow for P. ticto have been evaluated in this study. A 5- days’ exposure to the PCB solution showed accumulation of PCB 126 to be below detectable limits for gill and kidney tissues, whereas for the same exposure period, the accumulation of PCB 169 was below detectable limits in only the kidney tissue.
Maximum BCF and log BCF for both PCB 126 and PCB 169 showed greatest toxicity in gill tissue of P. ticto after exposure of fish for 30 days.
Bioconcentration Kinetics
The BCF is used to assess of the predisposition of any chemical to accumulate in an aquatic organism. Bioaccumulation of a chemical in tissue, and its ability build up the living tissue, is accepted by the USEPA as an important factor for establishing standards for toxic pollutants discharged as effluents. Effluent treatment plants also use this as an important indicator for establishing criteria for treatment of such effluents. BCF test guidelines for fish and oysters, as laid down by the USEPA32 and those by the ASTM (American Society for Testing and Materials)33 reveal the importance of BCF. The regression equation, the general formula for which is given by Equation (3), is usually used to calculate BCF.
log BCF=a log Kow + b, (3)
where a and b are empirically determined constants while Kow is the n-octanol/water partition coefficient.
Literature cites calculation of the extent of bioaccumulation in aquatic organisms such as Fathead minnows, Green Sunfish and Rainbow trout that have been exposed for 32 days in continuous-flow.34 Equation (4) gives the relationship between log BCF and log Kow
log BCF = 0.85 log Kow- 0.70, R2= 0.897 (4)
The above equation has been applied for arriving at a correlation between BCF and Kow in tissues of the fish species studied. Increasing accumulation over the given time period clearly indicates a build-up of the PCB in fish tissues, which follows an increasing trend, and is observed to be divided into two distinct phases. The first phase, of about 15 days from commencement of exposure, exhibits a slow build up, whereas a rapid build-up is observed in the second phase. This indicates that the kinetics of the build-up process is complex. It is difficult to demarcate such an observation with mathematical equations, taking into consideration the complexities of calculation involved.
It has been frequently found that BCF correlate well with hydrophobicity as expressed by Kow and it has been possible to establish linear relationships on log scale.35-38
Literature indicates that out of different properties of a compound, the partition coefficient of a pollutant would be the most logical parameter to examine the extent of its bioconcentration by aquatic organisms.39 Literature reports different trends of bioconcentration.40-42 The bioaccumulation kinetic constants for the fish tissues and calculated BCF, log BCF and the predicted log Kow values for the tissues studied are shown in Table 3 and Table 4, respectively.
Table 3: Bioaccumulation kinetic constants for tissues of P. ticto
|
PCB |
Statistical constants |
GILL |
INTESTINE |
KIDNEY |
LIVER |
|
PCB-126
|
Rate of bioaccumulation* |
4.595 |
1.652 |
0.167 |
2.097 |
|
Intercept |
-5.386 |
0.806 |
0.064 |
2.712 |
|
|
R2 |
0.918 |
0.967 |
0.789 |
0.872 |
|
|
PCB-169
|
Rate of bioaccumulation* |
2.617 |
1.095 |
2.581 |
0.697 |
|
Intercept |
16.78 |
6.535 |
-3.297 |
-0.023 |
|
|
R2 |
0.736 |
0.901 |
0.972 |
0.894 |
|
|
* µgg-1 wet weight of the tissue |
|||||
Table 4: Calculated BCF, log BCF and predicted log Kow values for various tissues in P. ticto
|
PCB |
Exposure time, days |
GILLS |
INTESTINE |
KIDNEY |
LIVER |
||||||||
|
BCF |
log BCF |
log Kow |
BCF |
log BCF |
log Kow |
BCF |
log BCF |
log Kow |
BCF |
log BCF |
log Kow |
||
|
PCB 126 |
5 |
0 |
ND |
ND |
ND |
ND |
ND |
ND |
ND |
ND |
ND |
ND |
ND |
|
10 |
3.41 x 10⁻¹¹ |
-10.47 |
-11.49 |
4 x 10⁻¹⁰ |
-9.38 |
-10.21 |
5 x 10-11 |
-10.28 |
-11.27 |
9 x 10⁻¹⁰ |
-9.07 |
-9.85 |
|
|
15 |
8.98 x 10⁻¹⁰ |
-9.05 |
-9.82 |
6 x 10⁻¹⁰ |
-9.22 |
-10.02 |
7 x 10-11 |
-10.17 |
-11.14 |
1 x 10⁻⁹ |
-9.00 |
-9.77 |
|
|
20 |
1.69 x 10⁻⁹ |
-8.77 |
-9.50 |
8 x 10⁻¹⁰ |
-9.08 |
-9.86 |
9 x 10-11 |
-10.05 |
-11.00 |
1 x 10⁻⁹ |
-8.92 |
-9.67 |
|
|
25 |
1.80 x 10⁻⁹ |
-8.74 |
-9.46 |
9 x 10⁻¹⁰ |
-9.04 |
-9.82 |
9 x 10-11 |
-10.05 |
-11.00 |
1 x 10⁻⁹ |
-8.89 |
-9.63 |
|
|
30 |
2.00 x 10⁻⁹ |
-8.70 |
-9.41 |
1 x 10⁻⁹ |
-9.00 |
-9.76 |
9 x 10-11 |
-10.04 |
-10.99 |
1 x 10⁻⁹ |
-8.85 |
-9.59 |
|
|
PCB 169 |
5 |
ND |
ND |
ND |
ND |
ND |
ND |
ND |
ND |
ND |
ND |
ND |
ND |
|
10 |
2.56 x 10⁻⁹ |
-8.59 |
-9.29 |
ND |
ND |
ND |
6 x 10-11 |
-10.24 |
-11.23 |
2 x 10⁻¹⁰ |
-9.75 |
-10.64 |
|
|
15 |
2.70 x 10⁻⁹ |
-8.57 |
-9.26 |
1 x 10⁻⁹ |
-9.00 |
-9.76 |
5 x 10⁻¹⁰ |
-9.32 |
-10.14 |
2 x 10⁻¹⁰ |
-9.69 |
-10.58 |
|
|
20 |
2.80 x 10⁻⁹ |
-8.55 |
-9.24 |
1 x 10⁻⁹ |
-8.99 |
-9.75 |
8 x 10⁻¹⁰ |
-9.11 |
-9.90 |
2 x 10⁻¹⁰ |
-9.67 |
-10.55 |
|
|
25 |
2.95 x 10⁻⁹ |
-8.53 |
-9.21 |
1 x 10⁻⁹ |
-8.92 |
-9.67 |
9 x 10⁻¹⁰ |
-9.05 |
-9.83 |
3 x 10⁻¹⁰ |
-9.50 |
-10.36 |
|
|
30 |
3.06 x 10⁻⁹ |
-8.51 |
-9.19 |
1 x 10⁻⁹ |
-8.88 |
-9.62 |
1 x 10⁻⁹ |
-8.90 |
-9.65 |
5 x 10⁻¹⁰ |
-9.33 |
-10.15 |
|
(ND: Not detected)
Linear graphs for regression, showing the relationship between PCB concentration and exposure time over the test period of 30 days in respect of both PCB 126 and PCB 169, in the gill, intestine, liver and kidney tissues of P.ticto are given in Figures 1 to 4, respectively.
 |
Figure 1: Graphical representation of relation between exposure time and PCB concentration in Gills of P. ticto, Click here to View Figure |
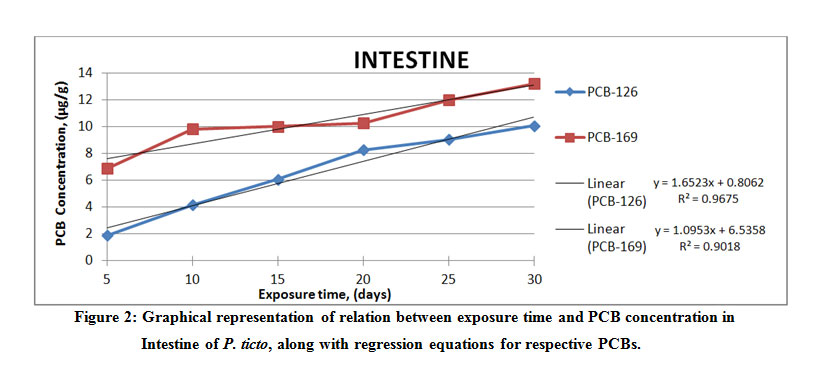 |
Figure 2: Graphical representation of relation between exposure time and PCB concentration in Intestine of P. ticto, Click here to View Figure |
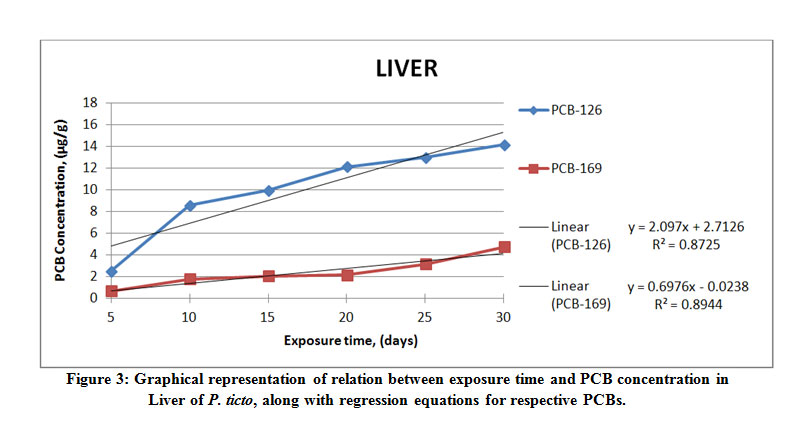 |
Figure 3: Graphical representation of relation between exposure time and PCB concentration in Liver of P. ticto, Click here to View Figure |
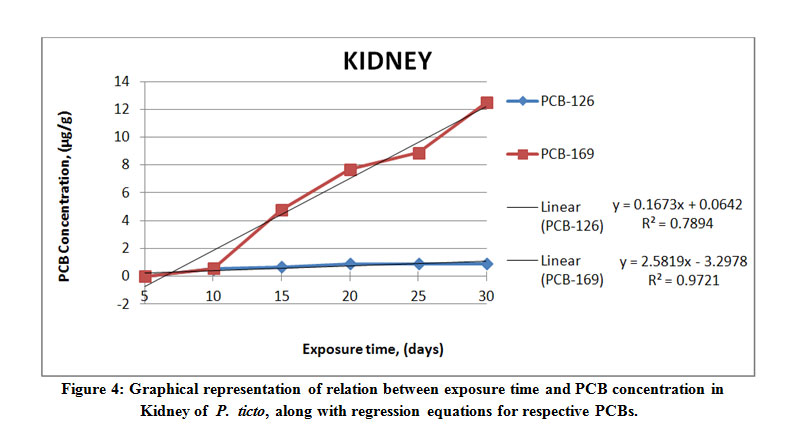 |
Figure 4: Graphical representation of relation between exposure time and PCB concentration in Kidney of P. ticto Click here to View Figure |
The rate of bioaccumulation of PCB 126 was found to be the greatest at 19.98 µgg-1, and that of PCB 169 the greatest at 30.61 µgg-1 in gill tissue of P. ticto. As can be seen from increasing values of BCF, the rate of uptake of PCBs increased with increase in exposure time. Regression (R2) values are seen to vary between 0.789 and 0.967 for PCB 126, whereas they vary between 0.736 and 0.972 for PCB 169, indicating fair to very high correlation between the concentration of PCB and time for which exposure of test organisms was carried out. Actual results obtained from the present study confirm the hydrophobic nature of the PCB compounds. Moreover, the regression models are spread over a large range of BCF and show a high correlation with Kow.
Conclusion
The significant feature that can be seen from the present study is that the process of of bioaccumulation was relatively slow for the PCB concentrations in case of both congeners tested, and the degree of accumulation varied from one tissue to another. This is in agreement with findings for PCB concentrations in Rasbora daniconius [18]. The organism tested was shown to accumulate PCBs under conditions of chronic bioassay, and bio-concentration depends on the time of exposure and on the sub-lethal concentration of PCB in the medium. PCB 169 was seen to be significantly more toxic as compared to PCB 126, as can be seen from its concentrations accumulated over a period of 30 days in the tissues of test fish P.ticto. PCBs present even at minimal concentrations in the surrounding environment have a tendency to accumulate in fish tissues over long periods of exposure, which is an indicator of the onset of chronic toxicity.
Acknowledgement
The author would like to profoundly thank Late Dr. Shanta Satyanarayan, his mentor and guide, for showing him the path that led to this research article.
Funding Source
There is no funding or financial support for this research work.
Conflict of Interest
The authors do not have any conflict of interest.
References
- Kayal. S. and Connell, D.W. Polycyclic Aromatic Hydrocarbons in biota from the Brisbane Estuary, Australia. Estuarine, Coastal and Shelf Science. 1995; 40 (5), 475-493.
- Kannan K., Hilscherova K., Imagawa T., Yamashita N., Williams L. L. and Giesy J. P. Polychlorinated Naphthalenes, -Biphenyls, -Dibenzo-p-dioxins, and -Dibenzofurans in Double-Crested Cormorants and Herring Gulls from Michigan Waters of the Great Lakes. Environ. Sci. Technol. 2001; 35 (3), 441–447.
- Franke, C.; Studinger,G.; Berger, G.; Bohling, S.; Bruckmann, U.; Cohors-Frensenborg, D.; Johnke, U.. The assessment of bioaccumulation. Chemosphere. 1994; 29 (7), 1501-1514.
- Franke, C., How meaningful is the bioconcentration factor for risk assessment. Chemosphere. 1996; 32 (10), 1897-1905.
- Baumard, P.; Budzinski, H.; Garrigues, P.; Sorbe, J.C.; Burgeot, T.; Bellocq, J. Concentrations of PCBs (polycyclic aromatic hydrocarbons) in various marine organisms in relation to those in sediments and to trophic level. Marine Pollution Bulletin. 1998; 36 (12), 951-960.
- Maack L. and Sonzogni, W.C. Analysis of polychlorobiphenyl congeners in Wisconsin fish. Arch. Environ. Contam. Toxicol. 1988; 17 (6), 711-719.
- Duinker, J.C., Schultz, D.E.and Petrick, G. Selection of chlorinated biphenyl congeners for analysis in environmental samples. Marine Pollution Bulletin. 1988; 19 (1), 19-25.
- McFarland V. A. and Clarke J. U., Environmental Occurrence, Abundance, and Potential Toxicity of Polychlorinated Biphenyl Congeners: Considerations for a Congener-Specific Analysis. Environmental Health Perspectives. 1989; 81, 225-239.
- Tanabe S., Kannan N., Wakimoto T., Tatsukawa R., Okamoto T. and Masuda Y. Isomer-specific determination and toxic evaluation of potentially hazardous coplanar PCBs, dibenzofurans and dioxins in the tissues of “Yusho” PCB poisoning victim and in the causal oil. Toxicological & Environmental Chemistry. 1989; 24 (4), 215 – 231.
- Bhavsar S.P., Hayton A., Reiner E. J., Jackson D. A. Estimating Dioxin-like Polychlorinated Biphenyl Toxic Equivalents from total PCB Measurements in fish. Environ. Toxicol and Chem Res Lib. 2007; 8, 1622.
- Esser H.O., Moser, P. An appraisal of problems related to the measurement and evaluation of bioaccumulation. Ecotoxicol Environ Safe. 1982; 6, 131-136.
- Kumar A.and Mathur R.P. Bioaccumulation kinetics and organ distribution of lead in a fresh water teleost Colisa fasciatus. Environ. Technol. 1991; 12, 731-735.
- Kumar A. And Mathur R.P. Bioaccumulation kinetics and organ distribution of cadmium in a fresh water teleost Colisa fasciatus. Environ Technol. 1996; 17, 391-398.
- Satyanarayan S., Muthal P.L., Krishnamurthy K.P., Kaul S.N. Bioaccumulation of organochloropesticides in different fish tissues. Environ. Studies. 1982; 56, 201-213.
- Satyanarayan S., Ramakant. Bioaccumulation kinetics and bioconcentration factor of chlorinated pesticides in tissues of Puntius ticto. Environ. Sci. Health. 2004; B 39 (2), 321-332.
- Bhagade A., Satyanarayan S., Deshpande A.M. Bioaccumulation Kinetics and Bioconcentration factors for Polycyclic Aromatic Hydrocarbons in tissues of Rasbora daniconius. Intl J Che and Phy Sci. 2013; II (Special issue), 82-94.
- Bhagade A. Bioaccumulation Kinetics And Bioconcentration Factors For PAHs In Puntius. Int J Res and Analytical Rev. 2019; 6 (1) 933-944.
- Bhagade A. A study on the bioaccumulation kinetics and bioconcentration factors of few polychlorinated biphenyls in freshwater fish Rasbora daniconius. Int. Res. J. of Science & Engineering. 2018; 6 (2) PP 43-53.
- Zeeman, M. Ecotoxicity testing and estimation methods developed under sect.5 of the toxic substances control act (TSCA). In Rand, G., Fundamentals of Aquatic Toxicology: Effects, Environmental Fate and Risk Assessment, 2nd Ed. Taylor and Francis: Washington, DC. 1995; chap. 23, 703-715.
- Environment Canada. Toxic Substances Management Policy- Persistence and Bioaccumulation. Environment Canada: Ottawa, Canada. 1995.
- Kong K.Y., Cheung, K.C., Wong, C.K.C., and Wong, M.H. The residual dynamic of polycyclic aromatic hydrocarbons and organochlorine pesticides in fishponds of the Pearl River delta, South China. 2005; Water Research. 39 (9), 1831-1843.
- Hattula, M.L. Some aspects of the recovery of chlorinated residue (DDT type compounds and PCB) from fish tissues by using different extraction methods. Environ. Contam. Toxicol. 1974; 12, 301-309.
- Srinivasan M.V., Dabadghao, S.B. Laboratory model constant dosing device. Ind.J. Env. Health, 1970; 12, 178.
- Clesceri, L.S.; Franson, M.A.H.; Eaton, A.D.; Greenberg, A.E. Standard Methods for Examination of Water and Wastewater. 20th Ed. APHA, AWWA, WPCF: Washington, DC, USA. 1998.
- Onuska A.S., Thomas R.D. Application of glass capillary gas chromatography to pesticide analysis. Chromato. Rev. 1980; 6 (3).
- Kurhekar M.I., D’Souza F.C., Meghal S.K. Rapid method of extracting aldrin, dieldrin and endrin from visceral materials. J. AOAC .1975; 58 (3), 548.
- Pointet K. and Milliet A. PCB analysis of fish whole gall bladders and livers from the Natural Reserve of Camarague by GC/MS. Chemosphere, 2000; 40(3), 293-299.
- Philips D.J.H. Use of biological indicator organism to quantitate organochlorine pollutants in aquatic environment- A review. Environ. Pollut. 1978; 16, 169-180.
- Murty A.S. Toxicity of pesticides to fish. CRC: Boca Raton, FL. 1986.
- Deubert K.H.,Timmerman J.S.,McCloskey L.R. Effects of fixation on the extraction of dieldrin and P, PDDT from muscle tissue. Bull. Environ. Contam. Toxicol. 1973; 9, 54.
- Khan M.A.Q. Pesticides in Aquatic Environments. Plenum press: New York, London. 1977.
- U.S. Environmental Protection Agency, Washington, DC. Fish BCF. OPPTS 850, 1730 EPA 712-C-96-129, Draft Report; 1996.
- European Centre for Ecotoxicology and Toxicology of Chemicals, The role of bioaccumulation in environmental risk Assessment: The Aquatic Environment and Related Food Webs. Technical Report: ECETOC: Brussels, Belgium, 67. 1996.
- Veith G.D., De Foe D.L., Bergstedt B.V. Measuring and estimating the bioconcentration factor of chemicals in fish. J. Fish Res. Board, Canada, 1979; 36, 1040-1048.
- Mackay D. Correlation of bioconcentration factors. Environ. Sci. Technol. 1982; 16, 274-278.
- Spacie A. and Hamelink J.L. Alternative methods for describing the bioconcentration of organics in fish. Environ. Toxicol. Chem. 1982; 1, 309-320.
- Hawker D.W. and Connell D.W. Bioconcentration of lipophilic compounds by some aquatic organisms. Ecotoxicol. Environ. Safe. 1986; 11, 184-197.
- Chaaisuksant Y.,Yu Q.,Connell D.W. Bioconcentration of bromo- and chlorobenzenes by fish (Gambusia affinis). Water Res. 1979; 31, 61-68.
- Neely W.B., Branson D.R., Blau G.E. Partition coefficient to measure bioconcentration potential of organic chemical in fish. Environ. Sci. Technol. 1974; 8, 1113.
- Butler P.A., Schutzman R.L. Bioaccumulation of DDT and PCB in Tissues of Marine Fishes. Aquatic Toxic. 1979; ASTM, STP 667. Marking, L.L.; Kimerle, R.A. American Society for testing and materials (ASTM): Philadelphia.
- Ernst W. Determination of the bioconcentration potential of marine organisms- a steady approach. Chemosphere. 1977; 11, 731-740.
- Satyanarayan S. Ramakant and Satyanarayan A. Bioaccumulation studies of Organochlorinated Pesticides in Tissues of Cyprinus carpio. J. Environ. Sci. and Health Part (B) 2005; 40, 397-412.


