Evaluating Changes in Land Use Land Cover using Remote Sensing Satellite Data and GIS (A Case Study in Patna Municipal Corporation Area) Patna, Bihar
Mohammad Yasir Ahmad1
*
 and Nikhat Hassan Munim2
1
Department of Zoology,
J.D. Women College, Patna, Magadh University,
Bodh-Gaya,
Bihar
India
2
Microbiology,
Vallam,
Marudhupandiyar College, Thanjavur,
Thanjavur,
613403
Tamilnadu
India
8148575922
8148575922
http://dx.doi.org/10.12944/CWE.15.2.22
Evaluation of land use land cover (LULC) change is an essential aspect of development in rural and urban sectors. This paper investigates the changes in LULC aspects of an environmentally vulnerable Patna Municipal Corporation (PMC) area in the middle-Ganga Plain, India. We offer Remote Sensing (RS), and Geographic Information System (GIS) techniques delineated LULC types include water bodies, agriculture land, fallow land, wasteland, built-up land and vegetation of the study area. LULC mapping of the study area was done through False Color Composite (FCC) Satellite image Resourcesat-1 (IRS P6 LISS-IV) and Resourcesat 2A (IRS-R2A LISS-IV) with 5.8-meter spatial resolution data of the year 2007 and 2018 respectively. The supervised classification and maximum likelihood equation were used to classified two multi-temporal images. Then temporal changes were detected by comparison between two LULC classified maps of 2007 and 2018, which was produced independently. Patna Municipal Corporation (PMC) area, Patna is one of the environmentally vulnerable areas under the threat of environmental and ecological degradation as a result of human activities due to improper land cover management. The main objective of using change detection is an important technique to detect changes in LULC over time in PMC, Patna between 2007-2018, and it is significant for updating land cover or natural resource management. The interpretation of this study has substantial changes in LULC occurred in the Patna Municipal Corporation (PMC) area, Patna within the period 2007-2018, related to urbanisation and economic development. The analysis outcome indicates the most remarkable changes occurred an increase in Built-up, (+) 21.86 % between 2007-2018, whereas the area of cropland and vegetation decreased (-) 8.95 % and (-) 5.8% respectively between 2007-2018. In the spatial distribution pattern, other changes have also occurred. This study will give the benefit in future action plans in land use and urban development and avoid LULC changes without proper planning. It will be most significant for the natural environment.
Copy the following to cite this article:
Ahmad M. Y, Munim N. H. Evaluating Changes in Land Use Land Cover using Remote Sensing Satellite Data and GIS (A Case Study in Patna Municipal Corporation Area) Patna, Bihar. Curr World Environ 2020; 15(2). DOI:http://dx.doi.org/10.12944/CWE.15.2.22
Copy the following to cite this URL:
Ahmad M. Y, Munim N. H. Evaluating Changes in Land Use Land Cover using Remote Sensing Satellite Data and GIS (A Case Study in Patna Municipal Corporation Area) Patna, Bihar. Curr World Environ 2020; 15(2). Available from: https://bit.ly/30z3f84
Download article (pdf)
Citation Manager
Publish History

Introduction
Evaluation of LULC change is an essential aspect of planning and management activities. Information on LULC change is significant for the preparation and execution of land management. Change Detection is an important procedure and necessary for updating LULC for management of the land environment. The significance of this study area as Patna is the capital city of Bihar situated along the confluence of River Ganges. The City Patna (PMC) is a fast-growing city and emerging trade centre in the last ten years. The population is growing, and rapid migration from different part of the state of Bihar resulted in rapid urbanisation of PMC become one of the environmentally vulnerable areas under the threat of environmental and ecological degradation.
The hypothesis of using remote sensing satellite imageries in change analysis/detection gives the outcome of the changes in land features due to changes in the pixels values.1 The use of digital/satellite data in change analysis of LULC is required as it provides an excellent result after manipulating pixels value with the aid of the computer.1 Remote sensing & GIS in LULC mapping and their change analysis is due to its advantages in time, cost benefits, reliability over the traditional ground methods. Large areas can be imaged quickly and repetitively, and also image interpretation is faster and less expensive than conducting ground surveys.2
In the last two centuries, the development of population and economic expansion caused high-speed modification to the earth's environment. The interpretation of this study has significant changes in LULC occurred in the Patna Municipal Corporation (PMC) area, Patna within the period 2007-2018, related to urbanisation and economic development. These changes in LULC is very much associated with nature and human activities in our natural environment.3 The rate of these alterations will gain momentum in the future.1 These quick changes of the land will affect the earth's natural environment as well as human sustainability.1 For the best use of land, it is vital to examine the existing LULC features, and their increasing needs due to population explosion, economic expansion and new lifestyles.4
The specific and present-day information on LULC is indispensable for many planning activities.4 This study aimed to derive LULC details and to evaluate changes of PMC, Patna at time intervals of the last 10 to 11 years. The method was applied to compare two different year images from the same sensor /satellite for the same area using remote sensing and GIS technology.5 These studies were carried out using LISS-IV data of 2007 and 2018 with 5.8 m spatial resolution to address temporal variability in LULC. LULC change detection was done based on multitemporal, multi-sensor and high-resolution remote sensing satellite imageries.6 Remote Sensing methodology associates in LULC preparation includes data collection, rectification, image enhancement, preliminary interpretation, image classification, map generation, quality checking of final product/map, change analysis and documentation.6 The supervised classification and maximum likelihood classified algorithm were used to classified two multi-temporal images. Then temporal changes were detected by comparison between two LULC classified maps of 2007 and 2018 which was produced independently.7 The main objective of using change detection is an important technique to detect changes in LULC over time in Patna Municipal Corporation (PMC) between 2007-2018, and it is significant for updating land cover or natural resource management. This study will definitely give the benefit in future action plans in land use management and avoid land cover changes without proper planning. It will make the most significant for the natural environment.
Study Area
Patna is the largest urban growing town and headquarters of Patna district, capital of Bihar state. It lies on the bank of river Ganga between 25° 33'22" and 25°39'20’’N Latitude and between 85°04'50" and 85°16'03.55" E Longitude falling in Survey of India toposheet nos. 72G/2 & 72G/6 on the plains of the Ganga basin at the height of 174 feet (53 m approx.) above the sea level. A location map, Satellite Imagery LISS IV data of 2007 and 2018 are presented in (Fig.1, and Fig.2). The total area under the Patna Municipal Corporation (PMC) area is 109.218 sq.km. The PMC, with its seventy-two wards, accommodates a population of about 16, 87,828 individuals as per 2011 census.8
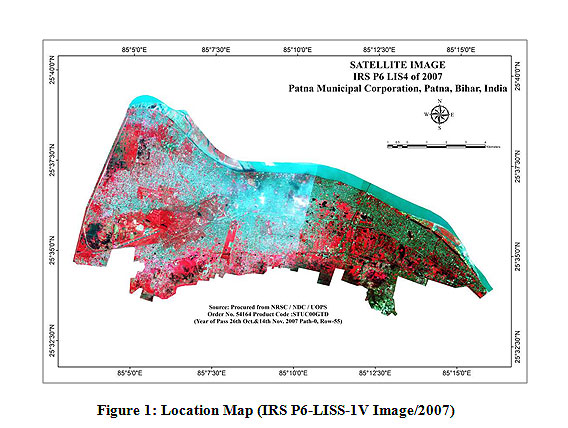 |
Figure 1: Location Map (IRS P6-LISS-1V Image/2007) Click here to View Figure |
 |
Figure 2: Location Map (R2A-LISS-1V Image/2018) Click here to View Figure |
Methodology
The significance of LISS-IV data in LULC mapping and change analysis is for better visual interpretation of existing features and their spatial distribution and variation on land.
LISS-IV data is a high-resolution satellite data provides 5.8 m per pixels ground resolution, and multi-spectral images cover three spectral bands (B2/ 0.52-0.59, B3/ 0.62-0.68, B4/ 0.77-0.86). The swath of LISS-1V covers 23 km to 70 km in three bands and revisit within five days.
Resourcesat-1 LISS IV (IRS-P6 LISS-IV) data of 2007 (path 102 row 55/56), acquired during October-November (Fig.1) and Resourcesat-2A LISS IV (IRS R2A LISS-IV) data of 2018 (path 104 row 053), acquired during April (Fig.2) with 5.8 m spatial resolution was used to address temporal variability in LULC categories. The Satellite Imagery geo-referenced UTM projection and WGS 84 datum. Satellite data procured from NRSC/NDC data centre/ User Order Processing System [UOPS].
Table 1: Technical Specification of LISS IV Data
|
Satellite |
Sensor |
Date of Acquisition |
Band/ Spectral Resolution |
Resolution (m) |
Path/Row |
|
Resourcesat-1 (IRS P6) |
LISS IV |
26.10.2007 14.11.2007 |
B2- 0.52-0.59 B3- 0.62-0.68 B4- 0.77-0.86 |
5.8 |
102/56 102/55 |
|
Resourcesat-2A (IRS R2A) |
LISS IV |
02.04.2018 |
B2- 0.52-0.59 B3- 0.62-0.68 B4- 0.77-0.86 |
5.8 |
104/53 |
Image Pre-processing
Pre-processing is the preliminary steps to eliminate unwanted sources to restore the distorted or degraded images in the most original form/scene.7 In this study, two images of LISS-IV data were co-registered with WGS 84 UTM projection and the process is done through rectification transforming the data using pixel/grid system from one image related to the same pixel/grid system in the second image, and finally, pixels were resampled. Atmospheric correction is done through histogram equalisation method to achieve better change detection.7
Image Interpretation
Image interpretation such as tone, texture, slope, size, pattern, site, and an association was applied for the visual analysis of satellite data for the development of the LULC map. The satellite imageries have three bands (Band 234) in the region of Green, Red and Near-Infrared respectively and FCC type of the image used. Various tools, techniques and methodology adopted in this study for image interpretations briefly described below.
Image Enhancement
The techniques Image Enhancement applied to increase the better visual distinctions or interpretation, to increase the amount of information between features in an image or satellite data. The Enhancement techniques were used to improve the better contrast in all the features in a scene, especially water and land.7
Image Classification
The Image Classification procedure was applied to classify multi-spectral pixels sorting all the pixels in an image into several individual classes.7
Supervised Classification
We opted supervised technique, which starts with ground monitoring at specific locations in the study area. In supervised technique/classification, first identified the training area and developed a numeric or digital value of the spectral class where pixels classified into different LULC types.
Maximum likelihood Classifier
The LULC map was created five different classes with the help of a maximum likelihood Classifier technique. This technique is based on a probability function determines the variance and covariance of each theme.7 The maximum likelihood is defined as follows.9
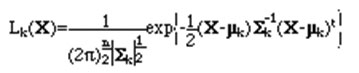
where n: number of bands
X: image data of n bands
Lk(X): likelihood of X belonging to class k
µk: mean vector of class k
∑k: variance-covariance matrix of class k
|∑k| : determinant of ∑k
Land use Land Cover Change Detection
Classification/ Post Classification Change Detection
For the management of land cover resources and land use activities, Change Detection is an important procedure and necessary for updating LULC. The technique was applied and classified two multi-temporal images (LISS IV data of 2007 and 2018) then detected by comparison between two LULC classified images which was produced independently. Classification/ post-classification images were applied, and the most vital method of getting the changes of Land Cover. The advantages of this method which minimise the impacts of land cover or environmental differences between multi-date satellite data and produces a better matrix of LULC changes.
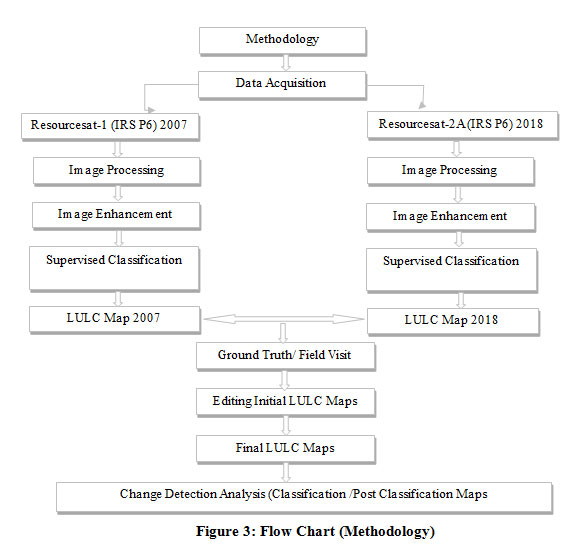 |
Figure 3: Flow Chart (Methodology) Click here to View Figure |
Results and Discussions
The present study result shows that how drastic changes to increasing Built-up land (+) 21.86 % and decreasing Agriculture including Fallow Land (-) 8.95%, Vegetations (-) 5.8%, Water bodies as well as decreasing wasteland also within the period of 2007-2018. The relative changes are given below in (Table-2). These conditions are significantly related to human activities such as social and economic concerns due to improper LULC management.
The various LULC classes were classified include water bodies, agriculture land, fallow land, wasteland, built-up land and vegetation. The supervised classification and maximum likelihood classified algorithm were used to classified two multi-temporal images. Then temporal changes were detected by comparison between two LULC classified maps of 2007 (Fig.4) and 2018 (Fig.5) which was produced independently. The accuracy of the classified map and change map (classification/post classification) were done through field verification and satellite Image (Google).
Table 2. The Comparative changes of LULC between the Year 2007 and 2018
|
Classification Name |
Area under LULC (2007) (Sq.Km.) |
% area LULC (2007) |
Area under LULC (2018) (Sq.Km.) |
% area LULC (2018) |
% Change Between 2007 & 2018 |
|
Water Bodies (River/Pond/Tank) |
8.9 |
7.43 |
5.18 |
4.33 |
(-) 3.1 |
|
Agriculture/Fallow Land |
31.92 |
26.66 |
21.18 |
17.71 |
(-) 8.95 |
|
Waste Land |
16.56 |
13.83 |
11.86 |
9.92 |
(-) 3.91 |
|
Built-up Land |
44.67 |
37.36 |
70.80 |
59.22 |
(+) 21.86 |
|
Vegetations |
17.49 |
14.60 |
10.52 |
8.80 |
(-) 5.8 |
|
Total area |
119.54 |
100 |
119.54 |
100 |
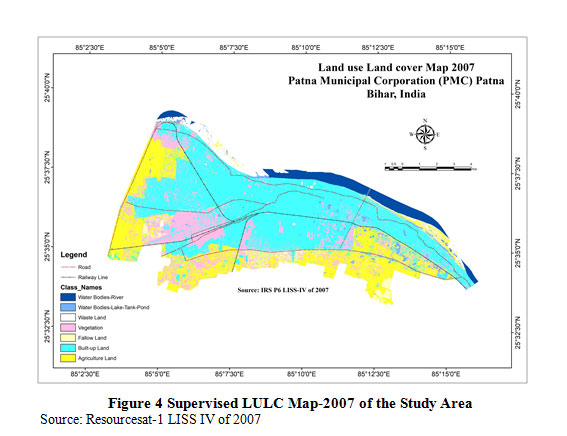 |
Figure 4: Supervised LULC Map-2007 of the Study Area Click here to View Figure |
 |
Figure 5: Supervised LULC Map-2018 of the Study Area Click here to View Figure |
Conclusions
PMC, Patna which one of the most vulnerable area due to rapid changes in LULC as a result of urban and economic development. In this study, multi-temporal LISS IV data was used and then detected the changes that have occurred between 2007-2018. Change detection analysis was done through comparison study between classified/post classified maps, as well as ground verification. The result showed the main negative changes that have occurred in the agriculture/ fallow class, water bodies and wasteland. Based on the findings, due to rapid urbanisation without proper planning under PMC and economic concerns were mainly observed in these negative changes.
Acknowledgements
The author would like to thank Magadh University for granting the Ph.D. research work. The Department of Environmental Science, A.N. College, Patna of the Magadh University, is highly appreciated for allowed the GIS laboratory work. The author is also profoundly grateful to the National Remote Sensing Center (NRSC), Indian Space Research Organisation (ISRO), Govt. of India for their guidance during the Satellite data procurement.
Funding Source
There is no funding or financial support for this research work.
Conflict of Interest
The authors do not have any conflict of interest.
References
- Roy PS, Dwivedi RS, Vijayan D, eds. Remote Sensing Applications. 2nd ed. Hyderabad, National Remote Sensing Centre; 2010.
- Sabins FF, eds. Remote Sensing Principles and Interpretation. 3rd ed. New York, W. H. Freeman and Company; 1996.
- Maheswari R, Rajkumar R. OM, Surendran A, Krishnamoorthy B. S. Monitoring changes in land use Land cover using Multi-Temporal Sensor Satellite Data. International Journal of Recent Scientific Research 2015;6(2):2867-2870.
- Joseph G, Dhawan S, eds. Fundamentals of Remote Sensing. Hyderabad, Universities Press (India) Private Limited; 2003.
- Mhmod M, Cal L, Zhuoguo M, Monitor and Study Horizontal and Verticals Changes at Land Surface in Wen Chuan Area from 1974 to 2010 Using Remote Sensing and GIS Technology, Journal of Remote Sensing & GIS 2015;4(3):1000146. DOI: 10.4172/2469-4134.1000146.
- National Remote Sensing Centre. Land use Land Cover Atlas of India, Hyderabad, Indian Space Research Organisation, Department of Space, Govt. of India, 2011(2-6).
- Kiefer RW, Lillesand TM, eds. Remote sensing and image interpretation. 4th ed. New York, John Wiley and Sons; 2004.
- Census of India. District Census Handbook, New Delhi, Director of Census Operations Bihar, 2011. https://censusindia.gov.in/2011census/dchb/DCHB_A/10/1028_PART_A_DCHB_PATNA.pdf. Published 2011. Accessed December 16, 2018.
- Japan Association of Remote Sensing. Remote Sensing Notes. http://sar.kangwon.ac.kr/etc/rs_note/rsnote/cp11/cp11-7.htm Accessed July 20, 2020.
- Singh HC, eds. Rural Environment Development and Planning, Allahabad, Chugh Publications; 1989.
- Vijayakumar N, Gurugnanam B, Arulbalaji K, Land use Land cover change detection in Thirumanimuttar Sub Basin, Cauvery River, Tamilnadu, International Journal of Science, Engineering and Technology Research 2015;4(4):680-683.
- Anderson JR, Hardy EE, Roach JT, Witmer RE, eds. A Land Use and Land Cover Classification System for Use with Remote Sensor Data. Washington, United States Government Printing Office; 1976. https://pubs.usgs.gov/pp/0964/report.pdf. Accessed November 15, 2018.
- Shih S.F. Satellite data and geographic information system for land use classification. Journal of irrigation and drainage engineering 1988;114(3): 505-519.
- Marsh WM, Grossa JJ, Environmental geography: science, land use, and earth systems. 3rd ed. New York, John Wiley and Sons; 2004.


