Impact on Human Health Due to Ghaggar Water Pollution
Ravi Kant Pareek1
*
 , Ambrina S Khan2
and Prateek Srivastava3
, Ambrina S Khan2
and Prateek Srivastava3
1
Department of Civil Engineering,
Vivekananda Global University,
Jaipur,
303012
Uttar Pradesh
India
2
Department of Civil Engineering,
Amity University,
Noida,
201303
Uttar Pradesh
India
3
Department of Botany,
CMP College, University of Allahabad,
Allahabad,
211002
Uttar Pradesh
India
http://dx.doi.org/10.12944/CWE.15.2.08
The people living in Ghaggar river basin are facing various waterborne diseases due to polluted water of Ghaggar River. The quality of Ghaggar river water was tested and analysed during this study. A health survey was also conducted to strengthen the work. The results undoubtedly verify that the quality of Ghaggar river water is not suitable to withstand the aquatic life and not fit for domestic uses. The low dissolved oxygen level and other checked parameters are clearly indicating it. The observed maximum values of biochemical oxygen demand (BOD5), color, pH, total dissolved solids (TDS), chloride (Cl-),turbidity and chemical oxygen demand (COD) were 36 mg/l, 500 ptcu, 8.6, 1321 mg/l, 161 mg/l, 301 NTU and 265 mg/l respectively. Most probable number count of river was also carried out and it shows very high number and clearly indicating that the river has bad quality of water. To understand the possible relationship between the quality of river water and water-borne diseases amongst the locals, a questionnaire survey was also carried out. The waterborne diseases observed in the study area were Jaundice, Diarrhea, Typhoid, Hepatitis, Malaria etc.
Copy the following to cite this article:
Pareek R. K, Khan A. S, Srivastava P. Impact on Human Health Due to Ghaggar Water Pollution. Curr World Environ 2020; 15(2). DOI:http://dx.doi.org/10.12944/CWE.15.2.08
Copy the following to cite this URL:
Pareek R. K, Khan A. S, Srivastava P. Impact on Human Health Due to Ghaggar Water Pollution. Curr World Environ 2020; 15(2). Available from: https://bit.ly/3fB88lE
Download article (pdf) Citation Manager Publish History

Introduction
Water pollution is the key reason of various water-borne diseases all over the world, predominantly in the developing countries. Polluted water influences the life of present generation as well as it affects the upcoming generations because of its continuing effects.1 In India around 60% population is not accessible to safe drinking water. Especially in India the incidence of birth defects, cancers and diseases related to skin, lungs, brain, kidneys and liver are several times more dominant than any other communities.8 The river drainage has significant influence on the land use and socio-economic fabric of the basin. Of late, there is ever growing demand for the river water by the cash crops, urbanization and industrialization in the economically progressive region.12 Pollution and health problems are associated with each other widely. Microorganisms causing disease, known as pathogens, spread directly among humans. Pathogens are found in different areas worldwide.13 Many water borne diseases are contagious among human.9 Developed, developing and least developed countries (LDCs) have been facing diseases caused by heavy rainfall and floods.2 One tenth of the population uses the contaminated water for growing food and vegetables.15 Water pollution causes many waterborne contagious diseases which are the results of fecal-oral route of infection.19 Health risks resulted by water pollution includes different diseases like cancer, diarrheal disease, respiratory disease, neurological disorder and cardiovascular disease.5 Cancer and blue baby syndrome are caused by nitrogenous chemicals.14 Rural areas witness higher mortality rate due to cancer than urban areas because urban population uses treated water for consumption whereas facility of water treatment is not available in the rural areas and use unprocessed water. Poor people are vulnerable of disease due to improper sanitation, hygiene and water supply.12 Pregnant women are at greater risk and affected negatively when exposed to chemicals of contaminated water resulting which rate of low birth weight increases.6 The quality of the once pristine river is greatly deteriorated in the recent years and now has serious impact on health of the people in the river basin. The present study deals with river water quality due to growing incidence of domestic, agricultural and Industrial pollution which is causing environmental degradation in the river basin.16 Waterborne diseases, and associated health hazards among the population in Basin have been reported for some time. Ghaggar River passes through two most fertile states (Punjab and Haryana) of India.17 Ghaggar River receives, industrial, domestic and municipal waste-waters/effluents all the length of its course. Rivers are the outflow of the large amount domestic sewage. This untreated domestic sewage causes the water pollution. Drainage of the industrial effluent in the rivers without treatment also causes the high water pollution.13 Surface and ground water is contaminated due to Hazardous material discharged from the industries. Nature of industries defines the degree of contamination. The entry of toxic matters reduces the quality of water.10 25% pollution is caused by the industries and is more harmful.7 An iron clog in to fish gills and it is lethal to fishes, when these fishes are eaten by human leads to the major health issue.3 The flow generated in the river system is utilised at for various purposes like irrigation, drinking and industrial. Water is also pumped directly from the Ghaggar River and tributaries at numerous places for irrigational activities throughout its journey from Panchkula to Sirsa District. Industrial regions like Chandigarh, Panchkula, Mubarakpur, Dera Bassi and lalru are discharge their industrial waste along with municipal wastewater directly or indirectly into the Ghaggar River through different channels.17 Therefore, it is essential that the quality of water should be observed at regular time intervals. Furthermore, the water quality is emerging as a great public concern throughout the world.
Material and Methods
Study Area
In the current study, the Ghaggar River was selected to assess the physico chemical characteristics and health survey along the river. The Ghaggar River originates from the Shivalik Hills of Himachal Pradesh and Haryana. After runs along the foot of the Shivalik hills and flows through Haryana and Punjab to Rajasthan and then finally it fades away in the sands of theThar Desert. The chosen study area spread within the borders of several states and covering parts of different districts of Punjab, Haryana and Rajasthan. At downstream sites a variety of point sources viz. Medkhali Nallah, Sukhna Choe, Jharmal Choe, Dhabi Nallah, Dhakansu Nallah, Patiala Nadi, Markanda River, and Shaabaad Nallah are joining the Ghaggar River and discharge their raw effluents into it. The area under investigation lies between North latitudes 30Ëš45′5.93″ to 29°11′49.29″ and East longitudes 76Ëš54′36.79″ to 73Ëš13′26.88″. Area under investigation covers parts of different districts of Haryana, Punjab and Rajasthan like Panchkula, SAS Nagar (Mohali), Patiala, Ambala, Kaithal, Fatehabad, Sirsa, Hanumangarh and Sri Ganganagar. The explore area enjoys humid to sub- humid type of climate characterized by extreme summers and chilly winters with large seasonal fluctuations in both temperature and rainfall. The temperature may raise upto 47°C in hottest month and may drop to less than 1°C in winter. In the upper part of the Shivalik hills precipitation of 1000-1500 mm and in lower regions precipitation is only 200 mm.
Sample Collection
In Oct, 2015, water samples were collected from chosen sites. The samples were collected from the surface water of the River in pre-cleaned polyethylene bottles and were analysed. A health survey questionnaire was also prepared covering all the aspects of health related issues due water pollution.
The objectives of the study are drawn by adopting the various steps as follows
To know about the current environmental and physical conditions of the research area, primary data were collected before sampling.
Photographs and water samples have been collected from various sites of the Ghaggar River and were examined in the laboratory for further investigation.
Pollution loads and water quality were investigated to detect the present condition of water quality and water pollution tendency. Besides studying the various reports, journals and thesis, opinions from experts as well as from local bodies were also collected.
In-depth interviews with group of people were carried out to identify their current and past health issues. Secondary data were also collected to scrutinize whether the professed health changes indicated by the population in vicinity harmonized the health indication discovered by local public health professionals. “Health Questionnaire” Tool was adopted for Collection of data.
Result and Discussion
Water Quality
The examination of the collected samples shows that the observed value of dissolved oxygen is very low throughout the stretch of river, much lesser the level recommended for inland surface water. DO values was calculated between 2.21 mg/l and7.9 mg/l whereas the recommended standard is 6 mg/l. At site no. 11 maximum DO 7.9 mg/l was recorded and the minimum value of 2.21 mg/l was recorded on site 9. The calculated value of pH ranged from 6.9 to 8.6 whereas the recommended standard is 6.5-8.5. pH value was recorded highest on site 16 that was 8.6 and the minimum pH 6.9 was recorded on site 5. The color quantity in the water varied from 20 ptcu to 500 ptcu whereas IS 10500: 2012 recommends 5 ptcu only. There is great variation in colour range as the river flow downward there are mixing of sewage and industrial effluents. Minimum colour was observed at origin i.e. at Amravati and site 13 to 15 observed maximum value of 500 ptu. Turbidity calculates in water was from 0 NTU to 301 NTU whereas the prescribed limit is 5 NTU only. Highest value of turbidity was recorded at Site 5 and the lowest was recorded on site 1. If low turbidity in drinking water is achieved, it indicates the removal of pathogen and ensures the drinking water safety. High turbidity in drinking water leads to several outbreaks of disease. Investigations of potential links between levels of turbidity in drinking-water and rates of endemic gastrointestinal disease in communities have produced mixed results. Some studies have reported a relationship between turbidity and endemic disease but others have not Tinker et al., 2010.23 Value of BOD3 observed in the water is ranging between 8 mg/l to 36 mg/l whereas for drinking water BOD has to be less than 5 mg/l. The range of quantity of hardness in was from 181 mg/L to 341 mg/l whereas desirable limit is 300 mg/l (IS 10500: 2012) Hardness is exceed the limit at site no. 5, 6, 7 and at site 15. As WHO says at its Conference in Geneva, Hard water doesn’t affect human health adversely. Moreover, hard water can provide an important supplementary contribution to total calcium and magnesium intake. Hardness in the drinking water plays major role from the point of view of both aesthetic acceptability and operational considerations. However, epidemiological studies for a protective effect of magnesium or hardness show the evidence on cardiovascular mortality; the evidence is being debated and does not prove causality.24 TDS in the water ranges from 332 mg/l to 1321 mg/l whereas the desirable limit is 500 mg/l. (IS 10500: 2012). On site 13 maximum values of TDS was recorded. while TDS itself may be only an aesthetic and technical factor, a high concentration of TDS is an indicator that harmful contaminants, such as iron, manganese, sulfate, bromide and arsenic, can also be present in the water. This is especially true when the excessive dissolved solids are added to the water as human pollution, through runoff and wastewater discharges.The value of Cl- in the water was recorded from 28 mg/l to 161 mg/l whereas desirable limit is 500 mg/l. (IS 10500: 2012). Chloride is within the range at all the sampling sites. Chloride toxicity has not been observed in humans except in the special case of impaired sodium chloride metabolism, e.g. in congestive heart failure.21 Healthy individuals can tolerate the intake of large quantities of chloride provided that there is a concomitant intake of fresh water. The amount of COD varied from 32 mg/l to 265 mg/l whereas in drinking water it should be less than 10mg/l. Fecal coliforms are identified by microbial examination of water. Generally, the dung of different warm-blooded species like human, domestic animals is the source of fecal coliforms which is used as an indicator of water pollution and shows the presence of waterborne human disease-causing bacteria.18
Table 1: Physico Chemical Analysis of Ghaggar River in October 2015
|
Site |
Color |
Temp. |
Turbidity |
pH |
Total Dissolved Solid |
Chloride (as Cl) |
Total Hardness |
Dissolved Oxygen |
Bio-chemical Oxygen Demand as BOD (3 days) |
Chemical Oxygen Demand as COD |
MPN |
|
1 |
20 |
25.6 |
0 |
7.6 |
339 |
28 |
259 |
7.3 |
15 |
49 |
32,000 |
|
2 |
25 |
26 |
95 |
7.6 |
410 |
32 |
262 |
7.1 |
11 |
55 |
60,000 |
|
3 |
34 |
26.6 |
4 |
7.6 |
356 |
49 |
281 |
7.2 |
9 |
63 |
121,000 |
|
4 |
121 |
29 |
65 |
8 |
342 |
56 |
291 |
7.2 |
12 |
32 |
56,000 |
|
5 |
289 |
29.8 |
301 |
6.9 |
610 |
78 |
329 |
3.6 |
10 |
32 |
59,000 |
|
6 |
181 |
30 |
212 |
7.2 |
454 |
85 |
312 |
7.2 |
12 |
56 |
56,000 |
|
7 |
267 |
30.6 |
229 |
7.2 |
618 |
89 |
341 |
6.8 |
18 |
131 |
1,010,000 |
|
8 |
250 |
30.2 |
289 |
7.3 |
332 |
119 |
181 |
7.6 |
19 |
160 |
111,000 |
|
9 |
500 |
30.2 |
39 |
7.6 |
846 |
146 |
289 |
2.21 |
33 |
223 |
1,201,000 |
|
10 |
171 |
30.2 |
21 |
7.7 |
411 |
161 |
242 |
4.3 |
8 |
39 |
87000 |
|
11 |
165 |
29.6 |
167 |
8.3 |
776 |
119 |
289 |
7.9 |
28 |
222 |
110,000 |
|
12 |
220 |
30.2 |
49 |
7.8 |
678 |
119 |
287 |
7.9 |
16 |
121 |
123,000 |
|
13 |
500 |
30 |
24 |
7.2 |
716 |
99 |
299 |
7.1 |
21 |
110 |
201,000 |
|
14 |
500 |
29.8 |
80 |
7.4 |
1321 |
110 |
221 |
6.8 |
36 |
265 |
221,000 |
|
15 |
500 |
29 |
44 |
7.3 |
821 |
117 |
334 |
7.4 |
29 |
227 |
1,221,000 |
|
16 |
198 |
28 |
57 |
8.6 |
611 |
101 |
221 |
7.2 |
12 |
110 |
201,000 |
Health Survey
Qualitative information and various case studies suggest that pollution and health problems may have relation between them. Another worry throughout the stretch of a river was skin diseases, especially in the middle and lower stretch of a river. As this region is agriculturally flourished area and people directly pump the polluted water of river into their field. During investigation it was found that people generally pour the water with bare footed and they are in direct contact with polluted water.
The physical and environmental health of the major part of world population is at the verge due to water pollution in both developed and developing countries. Water-related diseases like typhoid, cholera, ascariasis, polio, cryptosporidiosis and diarrheal diseases causes assassination of about 3.4 million people worldwide each year.20 The health of the individuals is at the greater risk due to water tainted with defecation contracting cholera, looseness of the bowels, and typhoid.22
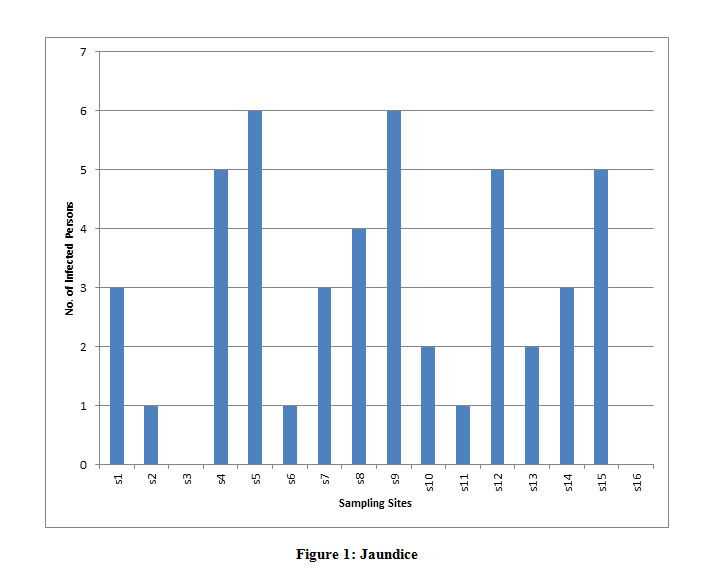 |
Figure 1: Jaundice Click here to View Figure |
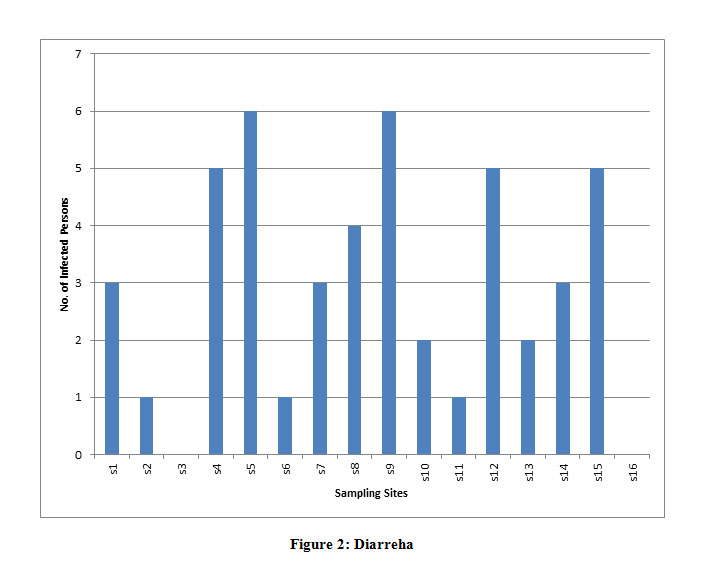 |
Figure 2: Diarreha Click here to View Figure |
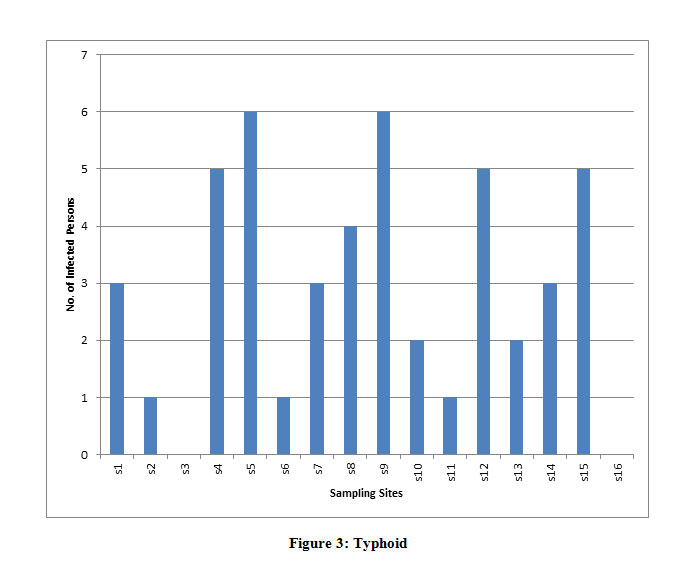 |
Figure 3: Typhoid Click here to View Figure |
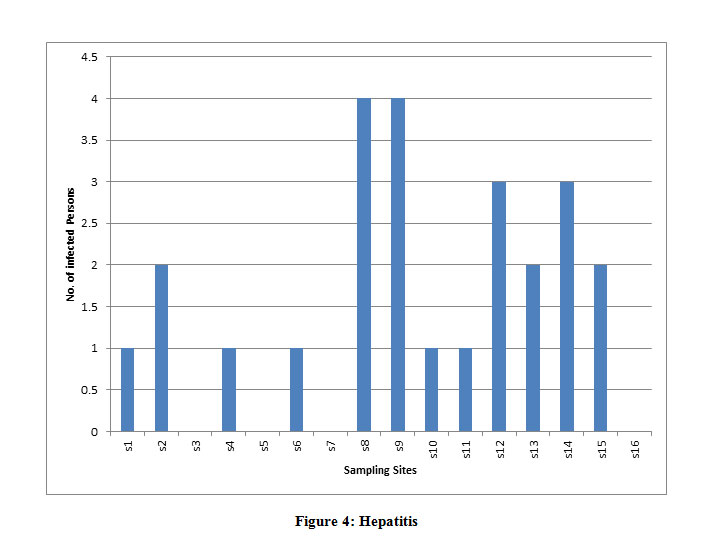 |
Figure 4: Hepatitis Click here to View Figure |
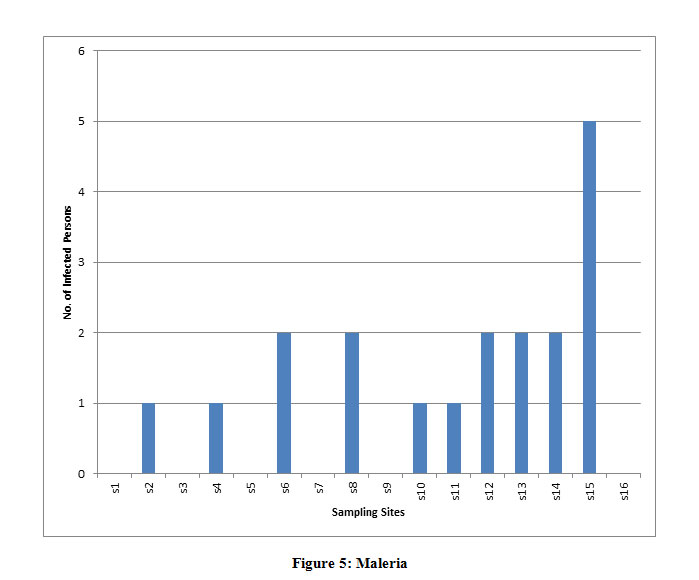 |
Figure 5: Maleria Click here to View Figure |
Diarrhea and dysentery, which are more frequent among children. Stomach ulcers have also been identified as a common health problem for workers in the vicinity. Hepatitis and jaundice are other major problem. Heart attack are also most prominent in this region; further research is required in this area. Asthma is also mentioned by the participants. Total 800 people were surveyed, 50 at each site. In Malwa region of the Punjab people called it as Cancer River and through the health survey I found this statement absolutely true. At middle lower stretch of the river people are badly affected. From site S9 to S17 detected most cases of cancer specially bone and blood cancer were observed. At site S14 (Sardulgarh) Surprisingly six people among the 50 surveyed people were suffering from Cancer and all these six people are farmers by profession.”
Diarrhea, typhoid and Hepatitis are other diseases that are dominating in this region (along the bank of River) and these diseases have direct correlation with the quality of water and from the health survey it is clear indication that river is densely polluted. Throughout the stretch of river these diseases are spread. Diarrhea is dominating at upper sites and Site S5 and S9 is most affected. Whereas lower sites are more affected by Typhoid and Hepatitis.”
Malaria is found throughout the stretch of river. One of the reasons may be the Ghaggar River and other is the poor drainage system in this region. Lower sites of Ghaggar River are more affected with malaria. Howeverdiet consumption habits may be the reason for gastric ulcers and other similar stomach problems. Possibly, the groundwater may have beencontaminated by infiltration of industrial outflow but similarly there has been no empirical research into this. Direct discharge of sewage into the Ghaggar River may be the source of the problems of diarrhea and dysentery. Odor pollution is another issue in this region and people are also suffering by the respiratory related problems. MPN is also major concern. All the sites were infected by MPN. Downstream of the river is greatly infected by MPN and that is due to the direct discharge of sewage into the river.”
Conclusion
The results revealed that the water quality of Ghaggar River is gradually deteriorating. It was also observed that in general in Ghaggar river basin more waterborne diseases were reported downstream the river. It was observed that Ghaggar River gets polluted due to negative human impact from the nearby catchment through disposal of untreated domestic sewage and industrial effluents from villages, towns and cities located on the bank or in the river catchment, resulting into increase in waterborne diseases in villages, towns and cities. The observations also revealed that the epidemics in general were experienced by locals one or two times in a year, and majority of them are waterborne diseases. As compared to the upstream and midstream, downstream basin was facing more severe problem. The majority of the diseases were observed in summer and least the late rainy season, when river pollution is low. The main cause of epidemics in the study area was due to pollution of water bodies in addition to improper sewage and effluent drainage in river. There is increase in the frequency of these epidemics in last few years.As people is called it Cancer River, further investigation is required. Crop sampling and critical heavy metal analysis should be done.
Acknowledgements
This study was possible due to the support of AIES, Noida. I would like to special thanks to Prof. Dr. Surendra Roy for providing answers to some theoretical and conceptual questions.
Funding
The author(s) received no financial support for the research, authorship, and/or publication of this article.
Conflict of Interest
The authors do not have any conflict of interest.
Reference
- A. Kumar, Bharti, D. Dutt and V. Kumar (2019). “Groundwater Quality Assessment in River Hindon Catchment of Saharanpur, Uttar Pradesh, India”, Int. J. Agricult. Stat. Sci. Vol. 15, No. 1, pp. 415-421, 2019 ISSN: 0973-1903
- Ahmad SM, Yusafzai F, Bari T, et al. Assessment of heavy metals in surface water of River Panjkora Dir Lower, KPK Pakistan. J Bio and Env Sci. 2014;5: 144-52.
- Ahmed T, Scholz F, Al-Faraj W, et al. Water-related impacts of climate change on agriculture and subsequently on public health: A review for generalists with particular reference to Pakistan. International journal of environmental research and public health. 2013;13:1-16.
- APHA (2005). Standard methods for examination of water and wastewater. 21th ed. American Public Health Association, Washington, DC, USA.
- Corcoran E, Nellemann C, Baker E, et al. Sick water? The central role of wastewater management in sustainable development. A Rapid Response Assessment. United Nations Environment Programme. 2010.
- Currie J, Joshua GZ, Katherine M, et al. Something in the water: contaminated drinking water and infant health. Canadian journal of economics. 2013;46(3): 791-810
- Desai N, SmtVanitaben. A study on the water pollution based on the environmental problem. Indian Journal of Research. 2014;3(12):95-96.
- Garg, M. (2012). “Water pollution in India: causes and remedies”; International Journal of Physical and Social Sciences, 2 (6), 556.
- Halder JN, Islam MN. Water pollution and its impact on the human health. Journal of environment and human. 2015;2(1):36-46. 18.
- Ho YC, Show KY, Guo XX, et al. Industrial discharge and their affects to the environment. Industrial waste, InTech. 2012:1-32.
- Indian Standard Drinking Water -Specification IS 10500:2012(Second Revision)
- Joshua Nizel Halder1, M. Nazrul Islam (2015), “Water Pollution and its Impact on the HumanHealth; Journal of Environment and Human 2(1).
- Kamble SM. Water pollution and public health issues in Kolhapur city in Maharashtra. International journal of scientific and research publications. 2014;4(1):1-6.
- Krishnan S, Indu R. Groundwater contamination in India: Discussing physical processes, health and sociobehavioral dimensions. IWMI-Tata, Water Policy Research Programmes, Anand, India. 2006.
- Nel LH, Markotter W. New and emerging waterborne infectious diseases. Encyclopedia of life support system. 2009;1:1-10
- R.K.Pareek, AS Khan, P Srivastva, S Roy (2018), “Assessment of Physicochemical Properties of Ghaggar River”; J. Biol. Chem. Chron. 4 (1), 19-25
- R.K. Pareek, AS Khan, P Srivastva, S Roy, S Grover, (2018) “Ecological Assessment of Ghaggar River with Diatoms”; Plant Archives 18 (1), 1074-1080.
- Shiekh M.A. High degree of fecal contamination in river, lake and pond waters in⁄ and around Dhaka city of Bangladesh. Pak. J. Biol. Sci. 2006;9(1):141–144.
- Ullah S, Javed MW, Shafique M, et al. An integrated approach for quality assessment of drinking water using GIS: A case study of Lower Dir. Journal of Himalayan Earth Sciences. 2014;47(2):163-74.
- UNEP . United Natons Environment Programme; 2016. A Snapshot of the World’s Water Quality:towardsaGlobalAssessment. https://uneplive.unep.org/media/docs/assessments/unep_wwqa_report_web.pdf
- Wesson LG. Physiology of the human kidney. New York, NY, Grune and Stratton, 1969: 591.
- WHO. fourth ed. World Health Organization; 2011. Guidelines for Drinking-Water Quality.
- Wtinker SC, Moe CL, Klein M, Flanders WD, Uber J, Amirtharajah A et al. (2010). Drinking water turbidity and emergency department visits for gastrointestinal illness in Atlanta, 1993–2004. J Expo Sci Environ Epidemiol. 20(1):19–28
- Yang CY, Cheng MF, Tsai SS, Hsieh YL. Calcium, magnesium, and nitrate in drinking water and gastric cancer mortality. Jpn J Cancer Res. 1998;89:124–30.


