Study of Risk Assessment of Indoor NH3 in Two Urban Households of NCR-Delhi
Ankita Katoch1
and U. C. Kulshrestha1
*

http://dx.doi.org/10.12944/CWE.15.2.03
Copy the following to cite this article:
Katoch A, Kulshrestha U. C. Study of Risk Assessment of Indoor NH3 in Two Urban Households of NCR-Delhi. Curr World Environ 2020; 15(2).
DOI:http://dx.doi.org/10.12944/CWE.15.2.03Copy the following to cite this URL:
Katoch A, Kulshrestha U. C. Study of Risk Assessment of Indoor NH3 in Two Urban Households of NCR-Delhi. Curr World Environ 2020; 15(2). Available from: https://bit.ly/2Ln5m6E
Download article (pdf)
Citation Manager
Publish History

Introduction
Rapid urbanisation has increased energy and food demands of humans which significantly affected the N cycle in the past few decades. Inert N2 gas is converted to its reactive forms through anthropogenic processes e.g. fossil fuel combustion, fertiliser manufacturing, sewage treatment, biomass burning etc. According to several studies, increase in reactive nitrogen can cause imbalance in the nitrogen cycle,1 soil acidification,2 loss of biodiversity,3-4 eutrophication of ecosystems5 etc.
Gaseous ammonia (NH3) is the primary alkaline trace gas that significantly contributes to total reactive nitrogen in the atmosphere and effects the overall acidity of precipitation, cloud water and airborne particulate matter.6-9 Its deposition alters the transport lifetimes and deposition patterns of sulfur dioxide and nitrogen dioxide emissions.10-12 In the urban context, NH3 plays a critical role as a precursor by neutralising acidic species such as HNO3, HCl, H2SO4 which act as chemical sink in the atmosphere to yield ammonium salts, constituting the fine mode secondary aerosols (diameter < 2.5µm). NH3 becomes the primary source of nitrate aerosols in the urban air (equation 1).13
HNO3 (g) + NH3 (g) ↔ NH4 NO3 (s) ……. (1)Air quality in urban areas bears a direct correlation to ammoniated aerosols but their precursors are not well quantified.14 Release of NH3 in vehicular exhausts is a major cause of ammonia loading in the urban air. It has been documented owing to the growing efficiency of three way catalysts to reduce NOx emissions and the introduction of selective catalytic reduction (SCR) system in diesel vehicles.15-16
NH3 Linkages to Sick Building Syndrome
All indoor structures ‘bathe’ in the outside environment. It implies that the air inside the enclosed structures is an extension of the outside air and its quality is subject to change with respect to variations in the outdoor air depending on the permeability of the structure, nature of the pollutant and other factors.17 NH3 has been directly linked to sick building syndrome (SBS) that makes work environment unsafe for employees. In urban areas, NH3 is contributed by construction materials, refrigeration units, chemical storage, household cleaners, tobacco smoke etc. Exposure to highly concentrated levels of NH3 may cause headaches, nausea and burning sensation in eyes, nose, throat and skin. NH3 has been demonstrated as a key player involved in the neuropathophysiology associated with liver failure and inherited urea cycle enzyme disorders.18 Hyperammonemia may also cause cerebral dysfunction involving a wide range of neuropsychiatric and neurological symptoms. Though indoor NH3 is not a widely studied phenomenon but a few reports establish its occurrence and adverse health effects. A research in Beijing demonstrated indoor air pollution due to NH3 and benzene released from the concrete used in a newly built company office.19 Higher indoor concentration of NH3 (3–6 ppm) was measured in the newly built Beijing office when compared to the reference office of the company (used as control) in Stockholm (<0.1 ppm ammonia). Workers in the Beijing office had a higher rate of complaints with respect to lesser work satisfaction and more work stress unlike the Stockholm reference group. Meininghaus et al.20 reported NH3 levels as high as 312 µg/m3 in classes of a French school. Some teachers and pupils in the school had complained of symptoms such as headaches, dryness of eyes, irritation in the upper respiratory tract etc. Toxicological reference values (TRV) were used for calculating the risk of exposure to the pollutants under study. If the pollutant concentration was below its TRV, it was not seen as a risk for the health end point studied. For non-carcinogenic compounds TRV was based on the sensory irritation symptoms produced after acute exposure and the Nordic Committee on Building Regulations limits were used as a guideline in the case of NH3 (4000µg/m3). However, the risk of developing sensory irritation due to NH3 was found to be negligible in this study. Health risk assessment was also performed by deriving the margin of safety (MoS) which is based on the exposure limits proposed by OEHHA/INDEX values and the actual exposure of the population to a compound.21 MoS obtained for NH3 exposure in Finland implied negligible health risk in the country. Regardless of the source of its origin, NH3 exceedance may have a significant impact on the environment and health of the inmates, if present above safety limits.
Major sources of NH3 in India
NH3 emissions are not regulated in most parts of the world. Among the source regions of NH3 in South Asia, one of the hotspots is the Indo-Gangetic Plain which is densely populated and has high yielding, fertile croplands along with ample livestock. Extensive use of fertilizers and sufficient contributions from livestock waste have led to a very high concentration of atmospheric ammonia. Irrigation activities in the croplands are associated with periods of fertilizer application and ammonia release. India has the second-largest land area under agriculture and its fertiliser consumption 16.8 Tg in 2012.22 Due to the tropical climate in India, a volatile gas like NH3 easily evaporates in the atmosphere from agricultural fields, soil under vegetation cover, landfills, fossil fuel burning etc. In addition, industrialisation and services, other sources of NH3 emissions such as refrigeration units, vehicular emissions, manufacturing processes, anthropogenic activities etc. play an important role in the urban areas.23 India does not have any policy to control NH3 emissions and reactive nitrogen species. NH3 emission and deposition budget balance also indicates a huge gap suggesting the need of comprehensive studies on NH3 in India.24 New Delhi, the most important North Indian city, is flanked by agriculture intensive states like Uttar Pradesh and Haryana on the geographical map of India. Sitting at this location puts Delhi at the receiving end of pollution due to dispersion of pollutants in the atmosphere along with burgeoning sources of pollution of its own. The present study is aimed at measuring the abundance and seasonal changes of indoor NH3 in two urban households that have distinct characteristics of their own such as the underlying difference in anthropogenic activities, dynamic indoor sources, land cover and land use pattern, vegetation cover etc. at the two chosen sites in the densely populated capital city of Delhi.
Methodology
It is understood that very few studies emphasise on the indoor concentrations of NH3 worldwide.25 There is a scarcity of adequate literature reporting the rising indoor NH3 in the Indian context, however, various reports have well established the outdoor NH3 concentrations in the urban landscape of Delhi.26-28 Objective of this study was to study the indoor abundance and variation of NH3, based on the local and seasonal influences in the selected urban households of Delhi. Also, the toxicological risk assessment associated with the present indoor NH3 concentrations was carried out. For this purpose, NH3 concentrations were determined inside both the households from July 2017 to June 2018 on a monthly basis.
Site Description
Delhi covers an expanse of 1,484 square kilometres. It is the capital of India with an ever growing population of over 25 million. It situated between the latitudes of 28°-24’-17” and 28°-53’-00” North and longitudes of 76°-50’-24” and 77°-20’-37” East. For this study, two households (Dwarka household, DH and Mayapuri household, MH) in Mayapuri and Dwarka regions have been selected as sampling sites in Delhi (Fig. 1). Both these urban localities have unique characteristics of their own which makes them suitable for carrying out this study. Their specific features of these areas have been discussed below:
Mayapuri
It is a locality close to western part of Delhi. The coordinates of Mayapuri are 28° 37' 46'' N and 77° 7' 39'' E. It is mainly an industrialized locality having limited residential area and Tihar Jail. Mayapuri supports large industrial facilities producing heavy and light metals, chemicals, treatment plants, and metal dumpyards etc. Automotive services are prevalent in the area. Recycling of metal scraps and sale of vehicle parts are popular business activities of Mayapuri making it one of the biggest market hubs for automotive and industrial spare parts in India. Overall, the place is now a combination of residential flats (DDA and private), commercial and industrial services.
Dwarka
It is located in the south-west district of Delhi. The coordinates of Dwarka are 28°35' 31'' N and 77°2' 45'' E. It is one of the highly planned and developed residential suburbs of the capital with Indira Gandhi International airport in the vicinity. This area is a typical representative of residential land use pattern with vehicular traffic emissions from the nearby NH-8 and Najafgarh road.
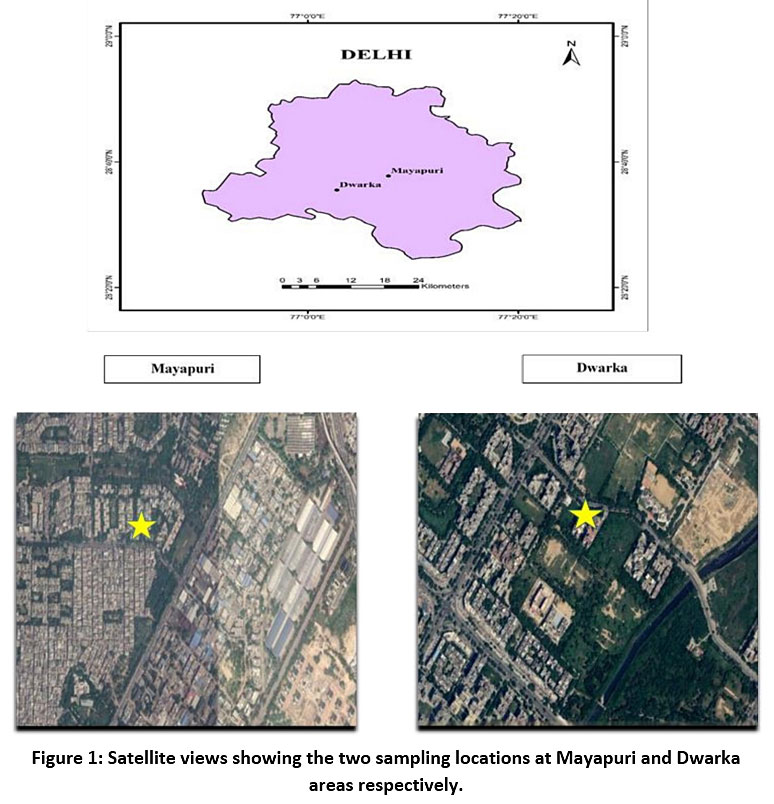 |
Figure 1: Satellite views showing the two sampling locations at Mayapuri and Dwarka areas respectively. Click here to view Figure |
Table 1 describes the features of the two representative households, DH and MH, which have been selected as sampling sites at the Dwarka and Mayapuri areas of Delhi respectively, for the present study.
Table 1: Features of the sampling site households.
|
Sites Indoor Features |
Dwarka household (DH) site |
Mayapuri household (MH) site |
|
Building Features: |
||
|
Age of Building |
Ì´ 20 years |
Ì´ 40 years |
|
Sampling point height (from the ground) |
Ì´ 50 feet above the ground. |
Ì´ 30 feet above the ground. |
|
Roofing and wall construction material |
Bricks and concrete. |
Bricks and concrete. |
|
Paint on walls |
Emulsion paint |
Whitewash |
|
Ventilation |
||
|
Type
|
Natural ventilation (For e.g. Doors, Windows) |
Natural ventilation (For e.g. Doors, Windows) |
|
Cross ventilation |
Present |
Present |
|
Central heating / cooling system |
Absent |
Absent |
|
Vicinity Features |
||
|
Traffic |
Less frequency |
High frequency |
|
Gardens / Parks |
Public parks and gardens. |
Absent |
|
Attached garage |
Absent |
Absent |
|
Indoor Livelihood |
||
|
Size of the family |
4 members (all adults) |
5 members (all adults) |
|
Fuel type used in kitchen |
LPG |
LPG |
|
Household cleaners |
House cleaners such as toilet bowl cleaners, floor cleaners, glass and window cleaners etc. are used. |
House cleaners such as toilet bowl cleaners, floor cleaners, glass and window cleaners etc. are used. |
|
Furniture type |
Wooden and foam furniture |
Wooden and foam furniture |
|
Tobacco smoke |
Absent |
Absent |
|
Food preferences in the family |
Strictly vegetarian |
Vegetarian and non-vegetarian |
Sampling Method
NH3 was collected using a low volume pump at the rate of 1 LPM maintained with the help of a flowmeter. Air was sucked through an open face filter pack, and it was connected to the impinger containing the absorbing solution through silicon tubing. Ammonium aerosols do not get dissolved in the absorbing solution because they are deposited on the PTFE filter (47mm diameter) mounted on the open face filter pack, in front of the entire assembly.26 Absorbing solution of 25mM H2SO4 was used to collect NH3. Sampling was carried out from July 2017 to June 2018 on a basis of 8 hours during the daytime (9:00 am to 5:00 pm) for a period of 7 days mostly every month. Sampling of NH3 could not be done in April 2018 at both the sites owing to some problems.
Chemical Analysis
NH3 samples obtained at both the sites were analysed in the laboratory by the indophenol blue method using a UV-Vis spectrophotometer. Indophenol blue dye was formed in the sodium pentacyanonitrosylferrate catalysed phenol-hypochlorite reaction with NH3 in alkaline solution. The colour intensity was directly proportional to the amount of NH3 present in the sample. The intensity of resultant ammonium ions complex was determined at a wavelength of 630 nm.
Results and Discussion
Indoor levels of NH3
Indoor NH3 concentrations ranged from 1.3 to 241.2 µg/m3 at the MH site and from 32.5 to 254.5 µg/m3 at the DH site. Table 2 shows the descriptive statistics of NH3 at the two selected sites. The average values of NH3 were 57.2 and 102.5 µg/m3 at MH and DH sites, respectively and the difference in the average values bears a direct relation with underlying outdoor factors in addition to dynamic indoor sources at the two sites. MH site is situated in the vicinity of an industrial area with limited residential and commercial activities. It differs greatly from DH site which is a typical example of a household in a well planned residential area. Indoor sources of NH3 are prominent contributors to the overall indoor gas phase concentrations.29-30 NH3 concentrations in the households can be attributed to the indoor sources the such as cleaning agents, cooking, smoking, metabolic activities of inmates etc. and the significantly variable outdoor features such as land cover and land use pattern, anthropogenic activities in the neighbourhood, vegetation cover, atmospheric chemistry, temperature etc. which influence ambient NH3 levels in the air. Table 3 presents a source inventory for outdoor emissions of NH3 around the indoor sampling sites, MH and DH. It has been reported that most Indian sites have abundance of freely available NH3 in the atmosphere.26 High concentration of gaseous NH3 at urban sites is directly associated with increase in population, anthropogenic activities and lack of proper sanitation. NH3 emitted from various sources does not find similar concentrations of counter acidic species for neutralisation leading to incomplete titrations of NH3 in the ambient air and therefore its gaseous phase is prevalent in the air.26 Indoor concentrations of NH3 are often higher than the outdoor concentrations because the equilibrium is driven towards the gaseous phase (equation 1) in an indoor set up.32-33
Table 2: Descriptive statistics of indoor gaseous NH3 levels (µg/m3) at MH and DH sites.
|
Parameters |
MH site |
DH site |
|
Mean |
57.2 |
102.5 |
|
Median |
42.0 |
78.8 |
|
Minimum |
1.3 |
32.5 |
|
Maximum |
241.2 |
254.5 |
|
Number of days |
77 |
80 |
Table 3: Source inventory for NH3 emissions from different outdoor sources at Dwarka and Mayapuri areas, near DH and MH sites respectively. (Source-31)
|
AREA |
Dwarka |
Mayapuri |
|
|
INDUTRIAL SECTOR |
Types of industries |
-NA- Dwarka is a residential locality with no industries. |
Various industries in Mayapuri Phase 1 and Phase 2:
TOTAL – 325 |
|
DOMESTIC SECTOR |
Domestic sources of NH3 |
|
|
|
EFFLUENT/ SEWAGE TREATMENT |
Emissions from treatment plants |
|
|
Figure 2 shows that indoor NH3 remained higher at DH site as compared to MH site throughout the sampling months. Indoor features of the two households have been discussed in table 1 with the primary indoor sources of NH3 identified as metabolic activities of inmates, cleaning agents, cooking, preference for non-vegetarian food containing high protein levels etc. We may assume that the family setup and lifestyle in both the urban households are quite alike barring some aspects which may have similar influence more or less, on emissions of NH3 inside the households. Higher values of indoor NH3 emissions at DH site as compared to MH site can be attributed to a number of surrounding factors apart from within the household emissions at the two sites. Dwarka is a residential suburb of Delhi with a high green cover area between concrete buildings and the household which serves as our sampling location is surrounded by number of municipal parks, trees and vegetation. Volatilisation from the surrounding soil could be contributing to the indoor NH3 emissions at DH site. Increase in NH3 emissions is known to be caused by agricultural sources which have lesser possibility in urban areas. Though, intermittent fertiliser application in the surrounding parks, trees and household plants at DH site cannot be ruled out. Also, proximity to the Najafgarh drain and its branches which hoard plenty of dead and decaying matter may increase the levels of gaseous ammonia in the ambient air, especially during monsoons. On most sampling days (from July 2017 to June 2018), the indoor NH3 levels remained consistently higher at DH site, except few episodes on certain days during the monsoon season when NH3 levels were recorded to be higher at MH site as compared to DH site. Although indoor NAAQS are not defined by the Central Pollution Control Board (CPCB) in India, we have tried to use the limits of ambient air defined by the CPCB. The maximum limit for ambient NH3 (24 hours) has been prescribed as 400 µg/m3 by and the recorded values in this study are well below it. Higher indoor NH3 levels were recorded at DH site as compared to MH site which marked increased NH3 occurrence at the site DH with only residential features. Plummeting levels of indoor NH3 at MH site could be attributed to the industrialised surroundings of this site. Acidic species released from the industries and other sources combine with NH3 and these redox titrations convert NH3 into the ammoniated aerosol form, thereby, decreasing its gas phase presence in the ambient air.
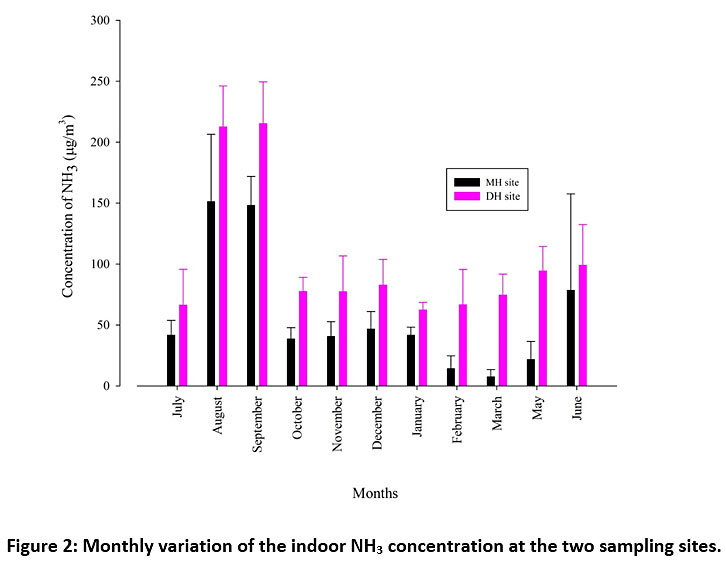 |
Figure 2: Monthly variation of the indoor NH3 concentration at the two sampling sites. Click here to view Figure |
Seasonal variation of indoor NH3
Highest concentrations of indoor NH3 were recorded in August with a monthly average of 212.4 and 151.2 µg/m3 at DH and MH sites respectively. Previous studies have shown that monsoons show exceedance in the NH3 concentrations owing to factors such as high humidity and temperature, damp conditions, emissions from dead and decaying organic matter etc.26 There is a sharp decline in post monsoon period during October as NH3 concentrations dropped to 38.5 µg/m3 and 77.4 µg/m3 at MH and DH sites respectively. Fig. 3a and 3b reveal that the indoor NH3 concentrations do not show any significant increase at either DH or MH site in the winter months which implies that decrease in temperature does not favour indoor NH3. As summer season approaches, the NH3 levels gradually increase in the months of March, May, and June at DH site (Fig. 3a) which can be attributed to the higher volatilisation of NH3 at increased temperature inside the household and from the outdoor local sources such as surrounding soil covered with vegetation, trees and large parks. In Fig. 3b, a similar trend is not observed because of the absence of natural greenery in the vicinity of MH site but an abrupt increase in the month of June (78.3 µg/m3) is seen which could be due to beginning of monsoon during late June after dry summer months at the. Seasonal contribution of indoor NH3 levels was plotted using pie charts (Fig. 4a and 4b). At DH site, monsoon season (July to September) showed the highest percentage of 41%, followed by summer season (March to June) at 22%. However, both post monsoon season (October) and winter season (November to February) did not show marked variation at 19% and 18% respectively. On the other hand, at MH site, the monsoon season showed higher contribution at 51% but significant seasonal variation was not observed for rest of the seasons (summer at16%, post monsoon at 17%, winter at 16%). It has been reported that at high relative humidity (more than 50%) and temperature, the indoor NH3 concentrations are higher as compared to cold and dry months.34 Fig. 5 showed significant R2 values between relative humidity and gaseous NH3 levels as 0.66 and 0.70 at DH and MH sites, respectively.
 |
Figure 3: (a) Indoor NH3 concentration at MH during the sampling months. The dotted lines show the mean values and the solid lines show the median or second quartile values within the box. The box plot represents the 25-75th percentile. Circles represent the outlier values. (b) Indoor NH3 concentration at DH during the sampling months. The dotted lines show the mean values and the solid lines show the median or second quartile values within the box. The box plot represents the 25-75thpercentile. Click here to view Figure |
 |
Figure 4: Seasonal variation of NH3 abundance at a) DH and b) MH sites Click here to view Figure |
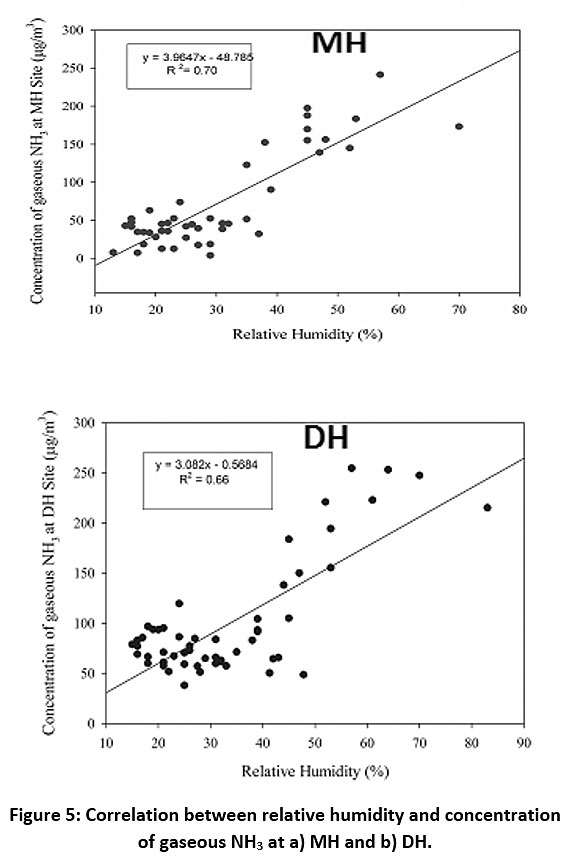 |
Figure 5: Correlation between relative humidity and concentration of gaseous NH3 at a) MH and b) DH. Click here to view Figure |
Calculation of Irritation Potential (IP) and Margin of Safety (MoS) for indoor NH3
Meininghaus et al.,20 used toxicological reference values (TRV) to calculate the risk of acute exposure for pollutants (see introduction). The irritation potential for non-carcinogenic NH3, was expressed as the ratio of pollutant concentration divided by its TRV (4000µg/m3). We use the same for risk assessment of NH3 exposure to indicate health risks, if any, after short term exposure during different seasons at DH and MH sites using equation 2.
IP = Cs / TRV …….. (2)
Where, IP is the irritation potential of NH3 during a season, Cs is the average concentration of NH3 during a season and TRV is the toxicological reference value for NH3 (4000µg/m3). Table 4 shows the values of IP for NH3 in different seasons. It is clear that the IP ratio for NH3 is less than 1 for all seasons at both the sites DH and MH, which indicates that there is no acute health risk involved due to indoor NH3 exposure at present concentrations.
Table 4: Irritation Potential during different seasons for NH3 at DH and MH sites
|
|
Monsoon |
Post-Monsoon |
Winter |
Summer |
|
IPs (at DH site) |
0.041 |
0.019 |
0.018 |
0.022 |
|
IPs (at MH site) |
0.028 |
0.009 |
0.008 |
0.008 |
Risk characterisation for long term indoor exposure to NH3 can be calculated using the MoS (Margin of Safety) concept.21 MoS is the ratio of limit of exposure (EL) producing no measurable effect in animals (based on major studies describing the appropriate toxicological end limits) divided by the human exposure (E) and is given by equation 3.21
MoS = EL / E .….. (3)
EL for NH3 was 300 µg/m3. As per the annual mean concentrations of NH3 obtained in our study and equation 3, the MoS values for gaseous NH3 exposure were calculated as 2.9 and 5.2, at DH and MH sites respectively. It was observed that the E values in our study were far less than the OEHHA toxicological limit (EL) at both DH and MH sites and hence the MoS obtained was above 1 at both our sampling sites, implying that no indoor health hazard was associated with the present NH3 concentrations.
Hazard Quotient for indoor NH3
Hazard Quotient (HQ) for non-carcinogenic agents can be defined as the ratio of potential yearly average daily exposure to a substance (E) and the reference concentration (RfC) for inhalation exposure (a level below which adverse health effects are not likely to occur). E can be calculated by using equation (4).35
E = C. IR × ED/W × (D/7) × (WK/52) …… (4)Where, C is the concentration in (mg /m3) of the pollutant (NH3 in this case), IR is the inhalation rate of adults (0.83 m3/h); ED is the exposure duration, W is the average body weight of an adult, D is the days of exposure per week, WK is the weeks of exposure in a year. E values at DH and MH sites were obtained as 12.1 × 10⁻³ and 6.7 × 10⁻³ mg/kg/day respectively.
On using RfC for NH3 as 0.5 mg/m3, HQ for NH3 was found as 0.40 and 0.22 at DH and MH sites respectively. The HQ values were <1 at both the indoor sites which represents negligible hazard.
The toxicological limits for NH3 used here have been derived from studies which were conducted in the developed parts of the world. However, their significance for indoor urban set ups in a rapidly developing nation needs to be adequately comprehended. Here, the indoor concentrations of NH3 are much higher as compared to residential buildings in developed countries. The air in most of the indoor spaces in India such as schools, residences etc. is an extension of the outdoor air as the interior environment is under the constant influence of its outdoor surroundings due to natural ventilation.36 In the Indian context, emphasis should be laid on adequate ventilation during the construction of a house; for poorly ventilated houses, measures such as a window above the cooking stove and cross ventilation though doors should be considered.37 Though the indoor concentrations are higher than the outdoor concentrations yet building up of pollutants till their toxic limits is prevented by frequent dilution of the indoor air by continuous exchange of fresh air masses occurring through doors and windows. Poor air quality is quite common for dwellings with cramped spaces, inadequate ventilation, high occupant density, traditional cooking fuel usage, or less hygienic surroundings in the poverty stricken areas of developing nations. Average 24-h exposure for particulate matter during biomass fuel usage in rural households was 231 ± 109 mg/m3 in southern India.38 The indoor NH3 concentrations in these cases may increase beyond the acceptable limits which is hazardous for the occupants and need to be studied further.
Table 5: Comparison of indoor air NH3 concentrations at different locations worldwide.
|
Country |
Site |
NH3 (µg/m3) |
Reference |
|
Finland |
Newly constructed residential buildings |
20-60 |
34 |
|
Finland |
Office buildings |
1-49 |
39 |
|
Croatia |
Near fertiliser plant |
32-352 |
40 |
|
France |
School building |
312 |
20 |
|
China |
Newly built student dormitories in Tianjin |
300-373 |
25 |
|
India |
Household in Dwarka, New Delhi (Urban-Residential) |
32.5-254.5 |
Present Study |
|
India |
Household in Mayapuri, New Delhi |
1.3 – 241.2 |
Present Study |
Comparison of indoor NH3 concentration at different sites worldwide
Table 5 compares the indoor air NH3 concentrations at different locations worldwide. Distinct ambient environments and indoor living conditions lead to variable indoor NH3 globally. Sub-tropical conditions in India facilitate higher NH3 concentration in the ambient air as compared to the colder nations. In addition, developed countries have better living conditions and sanitary arrangements which account for less ammonia release in the indoor environment.
Conclusion
For a simple fact that people breathe more of the indoor air as compared to the outdoor air, indoor air pollution studies hold definite relevance. Reports on indoor NH3 pollution are very rarely seen. The present study has brought to light the abundance of NH3 in two contrasting households representing residential and industrial features of living environment in Delhi. Results have showed seasonal variability in the indoor NH3 levels in naturally ventilated households. There were remarkable underlying differences in the outdoor surroundings of the households, in addition to the more or less common indoor sources of NH3 within the houses. DH site had higher contributions of NH3 in the indoor air throughout the sampling period as compared to MH site and both the sites recorded highest NH3 concentration during the monsoon season. For subtropical countries like India, monsoon and summer seasons offer greater possibility of NH3 release due to putrefaction and increased volatilisation of NH3 at higher temperature. No major seasonal variation was observed at MH site (except during monsoons) which could be due to its industrialised surroundings where alkaline NH3 gets rapidly neutralised. Risk characterisation for NH3 in both the households using relevant toxicological limits for acute and chronic exposure showed that indoor NH3 does not pose a risk to the health of the inmates. Though the present levels of NH3 are not hazardous at the selected sites but it may exert far reaching effects on human health in due course of time and the situation might be worse in less developed congested areas with poor living conditions. Hence, more comprehensive studies on indoor NH3 and its impacts are definitely needed in developing nations as well as worldwide.
Acknowledgement
We are extremely thankful to DST PURSE for financial support. We also want to thank JNU for providing the infrastructure to carry out this study. Author Ankita Katoch sincerely acknowledges the award of Junior Research Fellowship from CSIR-UGC. This study is a part of DRS-Net (Deposition Research Network through students)-India.
References
- Galloway, J.N., Townsend, A.R., Erisman, J.W. et al., (2008). Transformation of the nitrogen cycle: recent trends, questions, and potential solutions. Science, 320, 889-892.
- Guo, J.H., Liu, X.J., Zhang, Y. et al. (2010). Significant acidification in major Chinese croplands. Science, 327, 1008-1010.
- Phoenix, G.K., Hicks, W.K., Cinderby, S., et al., (2006). Atmospheric nitrogen deposition in world biodiversity hotspots: the need for a greater global perspective in assessing N deposition impacts. Global Change Biol, 12, 470-476.
- Song, L., Bao, X., Liu, Y. et al., (2011). Nitrogen enrichment enhances the dominance of grasses over forbs in a temperate steppe ecosystem. Biogeosciences, 8, 2341-2350.
- Liu, X., Duan, L., Mo, J. et al., (2011). Nitrogen deposition and its ecological impact in China: an overview. Environ Pollut, 159, 2251-2264.
- Hicks, K., Haeuber, R., and Sutton, M. (2014). Nitrogen deposition, critical loads and biodiversity: Introduction in Nitrogen Deposition, Critical Loads and Biodiversity (Eds: M Sutton et al.,), pp 1-4 (Springer).
- Shukla, S.P., Sharma, M. (2010). Neutralization of rainwater acidity at Kanpur, India. Tellus B, 62, 172-180.
- Xue, J., Lau, A.K., Yu, J.Z. (2011). A study of acidity on PM2.5 in Hong Kong using online ionic chemical composition measurements. Atmos. Environ, 45(39), 7081-7088.
- Behera, S.N., Betha, R., Liu, P., Balasubramanian, R. (2013).A study of diurnal variations of PM2.5 acidity and related chemical species using a new thermodynamic equilibrium model. Sci. Total Environ, 452, 286-295.
- Dentener, F., Drevet, J., Lamarque, J. F., Bey, I., Eickhout, B., Fiore, A. M., Hauglustaine, D., Horowitz, L.W., Krol, M., Kulshrestha, U. C., Lawrence, M., Galy-Lacaux, C., Rast, S., Shindell, D. et al., (2006). Nitrogen and sulfur deposition on regional and global scales: A multimodel evaluation. Global Biogeochem. Cycles, Vol. 20, No. 4, GB4003, 10.1029/2005GB002672.
- Wang, J., Jacob, D.J., Martin, S.T. (2008). Sensitivity of sulfate direct climate forcing to the hysteresis of particle phase transitions. J Geophys. Res, 113, D11207.
- Henze, D.K., Shindell, D.T., Akhtar, F. et al., (2012). Spatially refined aerosol direct radiative forcing efficiencies. Environ Sci Technol, 46, 9511-9518
- Stockwell, W.R., Watson, J.G., Robinson, N.F., Steiner, W., Sylte, W.W. (2000). The ammonium nitrate particle equivalent of NOx emissions for wintertime conditions in Central California's San Joaquin Valley. Atmos Environ, 34(27), 4711-4717.
- Sun, K., Tao, L., Miller, D.J. et al., (2017). Vehicle emissions as an important urban ammonia source in the United States and China. Environ Sci Technol, 51(4), 2472-2481.
- Bishop, G.A., Stedman, D.H. (2015). Reactive nitrogen species emission trends in three light/medium-duty United States fleets. Environ Sci Technol, 49(18), 11234-11240
- Stritzke, F., Diemel, O., Wagner, S. (2015). TDLAS-based NH3 mole fraction measurement for exhaust diagnostics during selective catalytic reduction using a fiber-coupled 2.2-μm DFB diode laser. Appl Phy B. 119(1), 143-152.
- Yocom, J.E. (1982). A Critical Review. J Air Pollution Control Ass, 32(5), 500-520.
- Bosoi, C.R., Rose, C. F. 2009. Identifying the direct effects of ammonia on the brain. Metab Brain Dis. 24, 95–102.
- Lindgren, T. (2010). A case of indoor air pollution of ammonia emitted from concrete in a newly built office in Beijing. Building and Environ, 45, 596-600
- Meininghaus, R., Kouniali, A., Mandin, C., Cicolella, A. (2003). Risk assessment of sensory irritants in Indoor air - A case study in a French School. Environ International, 28 (7), 553-557.
- Sarigiannis, D.A., Karakitsios, S.P., Gotti, A., Liakos, I.L., Katsoyiannis, A. (2011). Exposure to major volatile compounds and carbonyls in European indoor environments and associated health risk. Environ International, 37, 743-765
- FAOSATAT: Food and Agriculture Organization of the United Nations. (2015). Food and Agriculture Database (Food, Agriculture Organ, UN, Rome).
- Sharma, A., Massey, D., Taneja, A. (2018). A study of horizontal distribution pattern of particulate and gaseous pollutants based on ambient monitoring near a busy highway. Urban Clim. 24, 643-656.
- Kulshrestha, U.C. (2017). Assessment of Atmospheric Emissions and Deposition of Major Nr Species in Indian region. The Indian Nitrogen Assessment (Eds.: Y P Abrol and T K Adhya). Elsevier.
- Pei, J., Yin, Y., Liu, J. (2016). Long-term indoor gas pollutant monitor of new dormitories with natural ventilation. Energy and Buildings. 129:514-23.
- Singh, S., Kulshrestha, U.C. (2012). Abundance and distribution of gaseous ammonia and particulate ammonium at Delhi, India. Biogeosciences, 9, 5023–5029.
- Tiwari, R., Kulshrestha, U.C. (2019). Wintertime distribution and atmospheric interactions of reactive nitrogen species along the urban transect of Delhi–NCR. Atmospheric environment, 209, 40-53.
- Sharma, S. K., Datta, A., Saud, T., Saxena, M., Mandal, T. K., Ahammed, Y. N., Arya, B. C. (2010). Seasonal variability of ambient NH3, NO, NO2 and SO2 over Delhi. Journal of Environmental Sciences, 22 (7), 1023-1028.
- Atkins, D.H.F., Lee, D.S. (1993). Indoor concentrations of ammonia and the possible contributions of humans to atmospheric budgets. Atmos Environ, 27 (1), 1-7.
- Li, Y., Harrison, R.M. (1990). Comparison of indoor and outdoor concentrations of acid gases, ammonia and their associated salts. Environ Tech, 11(4), 315-326.
- NEERI, (2008). Air quality assessment, emission inventory & source apportionment study for Delhi. National Environmental Engineering Research Institute, Nagpur, India.
- Hering, S.V., Avol, E. (1996). Indoor-outdoor concentration ratios for fine particle mass and inorganic ions in twelve southern California homes. Proceedings of the Second Colloquium on Particulate Air Pollution and Human Health. (Park City, Utah, May 1-3, 1996): 3-52
- Lunden, M.M., Revzan, K.L., Fischer, M.L., Thatcher, T. L., Littlejohn, D., Hering, S.V. et al., (2003). The transformation of outdoor ammonium nitrate aerosols in the indoor environment. Atmos Environ, 37, 5633 – 5644.
- Jarnstrom, H., Saarela, K., Kalliokoski, P., Pasanen, A.L. (2006). Reference values for indoor air pollutant concentrations in new, residential buildings in Finland. Atmos Environ, 40, 7178–7191
- Majumdar D, Mukherjee AK, Mukhopadhaya, Sen S. (2012). Variability of BTEX in residential indoor air of Kolkata Metropolitan city. Indoor Built Environ, 3, 374-380.
- Goyal, R., Khare, M. (2009). Indoor–outdoor concentrations of RSPM in classroom of a naturally ventilated school building near an urban traffic roadway. Atmos Environ, 43, 6026-6038.
- Gupta, S., Kankaria, A., Nongkynrih, B. (2014). Indoor air pollution in India: Implications on health and its control. Indian Journal of Community Medicine, 39(4), 203-207.
- Balakrishnan, K., Sankar, S., Parikh, J., Padmavathi, R., Srividya, K., Venugopal, V., et al., (2002). Daily average exposures to respirable particulate matter from combustion of biomass fuels in rural households of southern India. Environ Health Perspect. 110, 1069-75.
- Salonen, H.J., Pasanen, A.L., Lappalainen, S.K. et al., (2009). Airborne concentrations of volatile organic compounds, formaldehyde and ammonia in Finnish office buildings with suspected indoor air problems. Journal of Occup and Environ Hygiene. 6(3), 200-209.
- Gomzi, M., Saric, M. (1997). Respiratory impairment among children living in the vicinity of a fertilizer plant. Int Arch Occup Environ Health, 70, 314-320.


