Surface Water Quality in the Forest Catchment – A Case Study of Tunga and Bhadra River Stretches, Karnataka
Santhosh Kumar T. M1
*
 and K. L. Prakash1
http://dx.doi.org/10.12944/CWE.15.2.10
Copy the following to cite this article:
Santhosh K. T. M, Prakash K. L. Surface Water Quality in the Forest Catchment – A Case Study of Tunga and Bhadra River Stretches, Karnataka. Curr World Environ 2020; 15(2). DOI:http://dx.doi.org/10.12944/CWE.15.2.10
Copy the following to cite this URL:
Santhosh K. T. M, Prakash K. L. Surface Water Quality in the Forest Catchment – A Case Study of Tunga and Bhadra River Stretches, Karnataka. Curr World Environ 2020; 15(2). Available from: https://bit.ly/3dGKFi4
Download article (pdf) Citation Manager Publish History

Introduction
Rivers are a perennial source of water for drinking, domestic purposes, irrigation, electricity generation, etc. Presently, most of the water resources are being polluted mainly by population explosion, urbanization, industrialization and other anthropogenic activities. Subsequently the entry of industrial wastes, effluents, sewage, pesticides from agricultural run-off and other contaminants into the water bodies both from point and non-point sources of pollution, deteriorating the quality of water which in turns to drastic changes in pH, turbidity, reduced Dissolved Oxygen (DO), increased Biochemical Oxygen Demand (BOD) levels, nutrients enrichment, etc. Effects of poor quality of water led to acidification of water bodies, eutrophication, algal bloom, retarded plant growth, reduction in photosynthetic rate, inhibition in growth of phyto-planktons, bio-magnification, fish deaths, water-borne diseases, etc. Land use and land cover change in river catchments due to anthropogenic activities has direct influence on the hydrological regime, run off during monsoon and seasonal variations in flow characteristics.1
Studies on sedimentation indicated that out of 239 major reservoirs studied in India, 81 reservoirs were lost 0-10% storage capacity and 66 reservoirs were lost 10-20% capacity due to soil erosion and improper treatment of their catchment.2 Forests are the larger catchments among the Indian River basins. Hence, relationship between forests and water is significant and the issues were taken up with a top priority.3 Forests play a major role in the ecosystem services by improving the quality of water by slowing the rain as it falls to the Earth, soaking into the soil, prevent soil erosion, reduction in storm water runoff and control of floods.4,5 Forest management practices such as thinning shall increase the water yield moderately for few years and due to the forest fire the availability decreases with lesser water quality. Improper forest management practices such as thinning, tree harvest, removal of dead and fallen trees, land related activities including the silvicultural practices cause hydrological changes in the catchment and thus directly affect the quality of water.6 Therefore, forest management plays an important role in water availability and sediment flow. Manipulation of vegetation and legal discourse in the forest catchments in India has serious implications of forest hydrology.7,8 Iron ore mining activities carried out during 1980-2006 in the Bhadra river catchment has seriously affected the quality of water. Further, removal of tree cover in the catchments of Tunga river for irrigation projects and expansion of national highways extensively reduces the forest cover in the study area.9 Hence, it is need to be understand the influence of forests on river water quality. The aim of the study is to understand the seasonal variation of water quality of River Tunga and Bhadra reservoir.
Study Area
Rivers originated from the Western Ghats and flows eastwards or westwards direction and meets in the Bay of Bengal or Arabian Sea respectively. Tunga and Bhadra rivers originate in the Gangamoola hills of the Western Ghats and joins near Kudli of Shimoga District and subsequently runs as Tungabhadra and a reservoir was built across the river near Hospet which is in non-forest area.10 River Tungabhadra stretches about 531 km across the Deccan Plateau and joins with River Krishna at Gondimalla, near Mahaboobnagar in Andhra Pradesh and led to Bay of Bengal.11 The study area predominantly covers the semi-evergreen and mixed deciduous forests and less agricultural landscapes as well as upstream of River Tunga and Bhadra reservoir. The study area is also a part of Bhadra Tiger Reserve and Wildlife Sanctuary with predominant tree species such as Xylia xylocarpa, Tectona grandis and Randia dumetorum, Terminalia paniculata, T. tomentosa, Pterocarpus marsupium, Dalbergia latifolia, etc.12
Bhadra reservoir has gross storage capacity of 2024.16 M.Cum (71.50 TMC) and Tungabhadra dam has 3736.92 M.Cum (132 TMC). In the year, 2019, the study area has received maximum rainfall during monsoon and released heavy floods downstream. Sedimentation is a common problem in the study area even though many watershed interventions were carried out for soil and water conservation. Due to which, gross storage capacity of Bhadra Reservoir located in the forest catchment is observed the decrease trend over a period of last few years viz.,2025.87 M.Cum (1964) <1964.95 M.Cum (2006) <1930.12 (2011), with an average rate of silting of 2.037 M.Cum /Year in 47 years. Whereas the Tungabhadra Reservoir surrounded by the non-forest catchment viz., 3751.17(1953) <3275.68 (1981) <2855.89 (2008) with an average rate of silting of 16.278 M.Cum / Year in 55 years was noticed.2 The details of sampling stations and locations are shown in Figure 1.
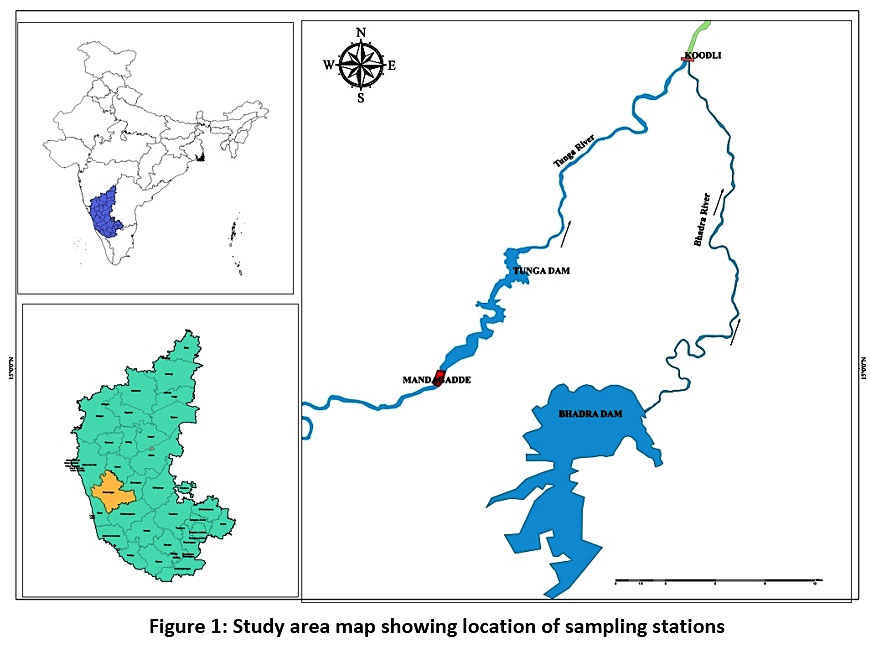 |
Figure 1: Study area map showing location of sampling stations Click here to view Figure |
Methodology
Surface water samples were collected randomly at Tunga River (TR) near Mandagadde and Bhadra Reservoir (BR) monthly wise from January, 2018 to December, 2019. The samples were collected in Polyethylene bottles of 2 liters capacity after thorough rinsing for 5 minutes. The samples were transported to laboratory with a freezer condition of 40C temperature. The collected water samples were subjected to analysis by using the methodologies of Bureau of Indian Standards (BIS) and American Public Health Association (APHA). The pH, Total Dissolved Solids (TDS) and Electrical Conductivity (EC) were analyzed at the field by using Eutech instrument. Dissolved oxygen was fixed at the site by using DO fixing reagents. The Remaining parameters were analyzed using Standard Methods13, 14 viz., Total Hardness as CaCO3, Calcium and Magnesium were analyzed using Ethylenediaminetetraacetic Acid (EDTA) method. Chloride was analyzed Argentometric method. Free ammonia and Free Carbon-di-oxide were analyzed using Phenate method spectrophotometrically and by titration method respectively. BOD was measured for 3 days at 27oC. Chemical Oxygen Demand (COD) was analyzed by using Open Reflux method. Nitrate was analyzed by using Ultraviolet (UV) technique and whereas Sulphate were analyzed by using Turbidimetric method. Fluoride was analyzed by using SPADNs method and Iron and Copper was analyzed using Inductively Coupled Plasma Optical Emission Spectrometry (ICP-OES) Thermo Fisher scientific ICAP 7400 DUO instrument. Pearson correlation matrix was applied for the water quality data by using Mega stat 7.25 Microsoft excel. In the absence of standards for surface water quality in India, the results were compared with United States Environment Protection Agency (USEPA) surface water quality standards.15 The results were validated using repeatability tests for selected parameters followed by ionic balance to ensure the correctness.
Results and Discussion
Physicochemical Parameters - pH, EC, TDS and Total Hardness (TH)
pH is an important parameter for consumptive as well as aquatic life sustenance in an ecosystem. The pH results for Tunga river and Bhadra reservoir showed that mean concentrations of pH ranged between 7.30 and 8.02 (Fig 2). An increased trend in pH concentration was observed in Pre-monsoon season attributed to minimum water levels in the river and decreased trend was noticed as increasing the river flows. The optimum range of pH in surface waters was 5.5 to 8.5. The acidic and basic nature of pH less than 5.0 and more than 9.0 causes reduction of productive rates and affects survival of aquatic flora and fauna.16 EC is an indicator of soluble salts in the surface water. Conductivity of 0 to 800 µS/cm is good for irrigation and drinking water needs and if it is higher than 1000µS/cm, it is an indication of land degradation and heavy runoff.17 It may not be suitable for sensitive crops. Mean EC values slightly varied among the different seasons and there is an increased trend of EC was observed in monsoon and post monsoon seasons (Fig 3). EC values are varied from 72.6 and 132.5 µS/cm (Pre-monsoon), 44.8 to 143 µS/cm (Monsoon) and 72.4 to 133 µS/cm (Post-monsoon). TDS value found in the range from 46 to 74 mg/L (Pre-monsoon), 32 to 106 mg/L (Monsoon) and 53 to 96 mg/L (Post-monsoon) which are much lower than the prescribed standard of 2000 mg/L. Among two different sampling locations, there is no significant mean variation among the seasons. TH is observed to be soft (<61 mg/L) in all the seasons (Mean 19 mg/L to 31 mg/L).
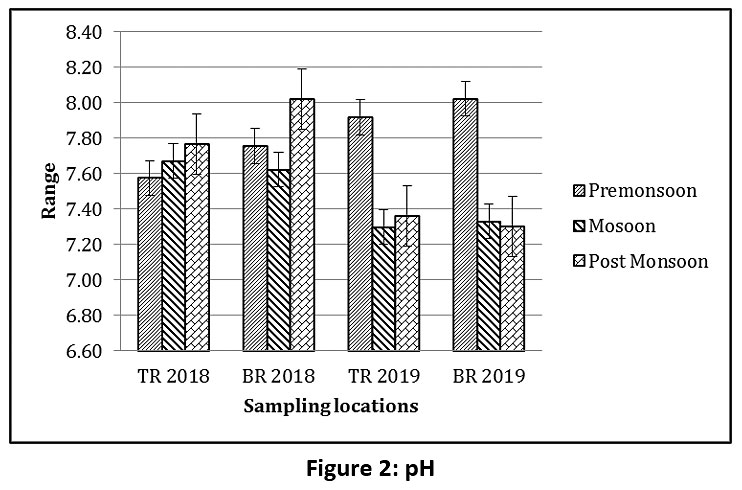 |
Figure 2: pH Click here to view Figure |
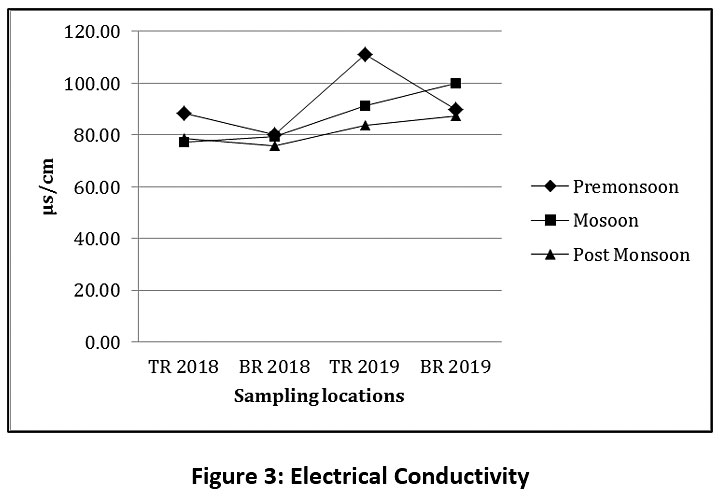 |
Figure 3: Electrical Conductivity Click here to view Figure |
Organic Matter (DO, BOD and COD)
Even though the primary source of DO is diffused from atmosphere into the water body, the oxygen liberated from phytoplanktons, aquatic plants, benthic organisms and respiration by fishes plays important role.18 Mean DO values were ranged between 4.6 and 5.9 mg/L (Pre-monsoon), 4.9 to 5.9 mg/L (Monsoon) and 4.7 to 5.9 mg/L (Post-monsoon) and not shown a significant variation among seasons (Fig 4). Hence, the rate of soil erosion and turbidity has no significance in the study area, concentration below 5 mg/L is alarming as a result of decaying of organic material. Generally, the BOD in natural water body can be <5.0 mg/L and higher BOD of 10 mg/L is an indication of pollution and COD is <40 mg/L in natural water and up to 200 mg/L in case of water receiving effluents17. BOD in the Tunga river showed higher values during Pre and Post monsoon seasons (Fig 5). BOD varies from 2.2 to 9 mg/L (Pre-monsoon), 1.2 to 4 mg/L (Monsoon) and 1.2 to 8 mg/L (Post-monsoon) and COD varies from 8 to 48 mg/L (Pre-monsoon), 8 to 36 mg/L (Monsoon) and 6.4 to 48 mg/L (Post-monsoon) and similar results were noticed in the previous studies for the same river.10 The highest river flood was observed during monsoon (2019) and no significant changes in the water quality with flooding.
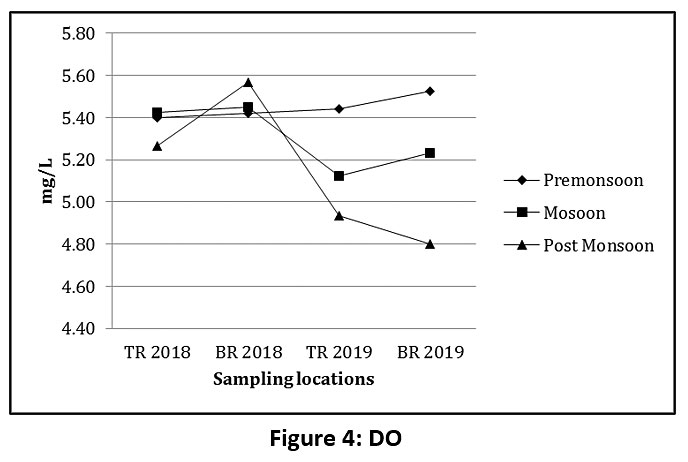 |
Figure 4: DO Click here to view Figure |
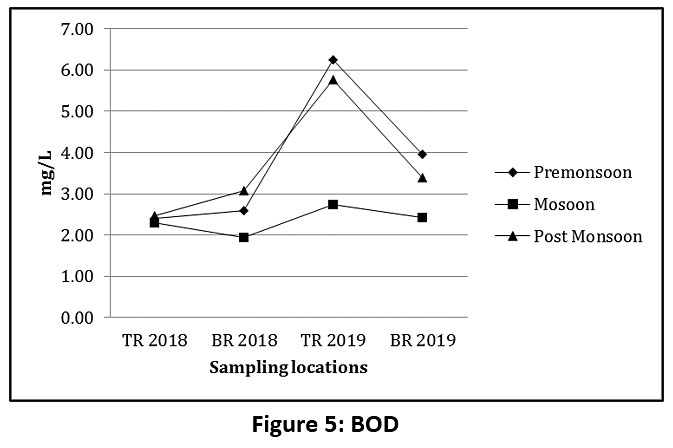 |
Figure 5: BOD Click here to view Figure |
Nutrients – Nitrate (NO3-) and Free Ammonia (NH3)
NO3-concentration in surface water varies in the ranged between 1 mg/L and 5.0 mg/L and excess concentrations (>50 mg/L) is an indication of fertilizers pollution apart from leaching from natural forests. NO3- values found within an acceptable level among both sampling locations except in Tunga river during Monsoon, 2018 (10.94 mg/L) and Post monsoon, 2019 (8 mg/L). Free ammonia was found within the acceptable level of < 0.2 mg/L.
Major Cations – Magnesium (Mg2+), Calcium (Ca2+) and Sulphate (SO42-)
Mg2+ concentration in surface water occurs due to weathering of rocks and is considered an important intake for all living organisms. The concentration varies with type of rocks and it is found in the range of 1 mg/L to 100 mg/L. In Tunga river, the mean concentration varied in the range of 0.85 mg/L to 5.1 mg/L in Monsoon season (2019) and whereas in Bhadra reservoir, the concentration varies between 0.6 mg/L (Post-monsoon, 2018) to 3.88 mg/L (Pre-monsoon, 2018). Similarly, Ca2+concentration in surface water is <15 mg/L. All the samples recorded within the range and it is important for aquatic animals including lower vertebrates. The concentrations of SO42-in surface water ranges between 2 mg/L to 80 mg/L depending on the land use and type of geological formations. As per the standards, it is allowable up to 200 mg/L. The mean concentrations of SO42- varies in the range of 1.72 mg/L to 19.47 mg/L in Tunga river and 0.86 mg/L to 9.0 mg/L in Bhadra reservoir.
Major Anions - Chloride (Cl-) and Fluoride (F-)
Cl-concentrations in surface water varied between 2 mg/L to 10 mg/L. In Tunga River the mean concentration varies between 7.23 mg/L (Pre-monsoon, 2018) to 17.12 mg/L (Pre-monsoon, 2019) and whereas in Bhadra reservoir it was ranged between 6.74 mg/L (Pre-monsoon, 2018) to 18.36 mg/L (Post-monsoon, 2018). F- concentrations in surface water was observed to around 0.1 mg/L. The F- values varies from 0.08 mg/L to 1.12mg/L in Bhadra reservoir during Pre-monsoon season.
Metals – Iron (Fe) and Copper (Cu)
Sulphate and Iron has strong relationship in the forests catchments and decrease in Sulphate deposition increases the concentrations of Iron in the surface waters.19, 20 The acceptable concentrations of Fe in the surface water would be <0.2 mg/L. The mean concentrations of Iron values varied between 0.24 mg/L and 0.82 mg/L in Tunga river and 0.05 mg/L to 0.12 mg/L in Bhadra reservoir which are within the acceptable level. Earlier studies by the researchers during 2008-2010 in the Bhadra river catchment reported the iron values ranging between 15.7 mg/L to 26.6 mg/L which are alarming due to extensive iron ore mining activities. Hence, past mining activities has no relationship with water quality in the study area.21 Similarly, the mean concentrations of Copper were varied between 0.017 mg/L and 0.061 mg/L in Tunga river and 0.004 mg/L and 0.06 mg/L in Bhadra reservoir. The acceptable range of copper in surface water is in the range between 0.05 mg/L to 1.0 mg/L.
Correlation Analysis
Based on the Pearson Correlation matrix, pH is positively correlated with EC, TDS, TH, DO, BOD and other parameters (Table-1). EC and TDS has strong positive correlation (r=0.92) shows that both are symbiotic. Major anions and cations are positively correlated with EC and TDS indicating their contribution as major soluble in water. Total hardness values showed a positive correlation with Ca2+ and Mg (r>0.5) and whereas heavy metals concentrations are <0.5 indicating that their contribution is insignificant in water samples (Table 1). Two tailed tests indicated that, the critical value of ± 0.576 at 0.05 significance level reveal that, the results obtained are statistically significant. Further, Spearman correlation coefficient (Rs) is 0.99 indicating the strong positive relationship between Tunga and Bhadra rivers with normal distribution.
Table 1: Pearson Correlation Matrix
|
Parameters |
pH |
EC |
TDS |
TH |
DO |
BOD |
COD |
NH3 |
NO3- |
Cl- |
SO42 |
Ca2+ |
Mg |
F- |
Cu |
Fe |
|
pH |
1 |
|||||||||||||||
|
EC |
.06 |
1 |
||||||||||||||
|
TDS |
.05 |
.92 |
1 |
|||||||||||||
|
TH |
.31 |
.74 |
.74 |
1 |
||||||||||||
|
DO |
.41 |
-.06 |
-.14 |
.13 |
1 |
|||||||||||
|
BOD |
.01 |
.24 |
.29 |
-.02 |
-.19 |
1 |
||||||||||
|
COD |
-.06 |
.19 |
.15 |
-.02 |
.07 |
.68 |
1 |
|||||||||
|
NH3 |
.24 |
.08 |
-.01 |
-.17 |
.06 |
.18 |
-.02 |
1 |
||||||||
|
NO3- |
-.16 |
.00 |
.05 |
-.19 |
-.08 |
-.02 |
-.08 |
.34 |
1 |
|||||||
|
Cl- |
.16 |
.10 |
.22 |
.13 |
-.06 |
.25 |
.15 |
-.05 |
.02 |
1 |
||||||
|
SO42 |
-.13 |
.27 |
.16 |
.11 |
.11 |
-.19 |
.13 |
.07 |
.32 |
-.05 |
1 |
|||||
|
Ca2+ |
.35 |
.64 |
.69 |
.93 |
.11 |
-.07 |
-.13 |
-.20 |
-.09 |
.19 |
.10 |
1 |
||||
|
Mg |
.16 |
.53 |
.47 |
.72 |
.24 |
-.07 |
-.03 |
-.13 |
-.22 |
-.10 |
-.02 |
.52 |
1 |
|||
|
F- |
-.22 |
.15 |
.08 |
.06 |
-.30 |
-.01 |
-.06 |
-.07 |
-.10 |
-.04 |
.23 |
.02 |
.03 |
1 |
||
|
Cu |
-.29 |
.05 |
.02 |
-.04 |
-.19 |
-.05 |
.01 |
-.22 |
.17 |
-.17 |
.36 |
.01 |
-.13 |
.29 |
1 |
|
|
Fe |
-.10 |
-.02 |
.06 |
-.13 |
-.19 |
.10 |
.12 |
.36 |
.44 |
-.06 |
-.04 |
-.05 |
-.22 |
-.22 |
.06 |
1 |
Conclusion
The water quality in Tunga and Bhadra reservoir meets the acceptable criteria for sustenance of aquatic life in the absence of specific standards in India. Forest plays crucial role in purifying the water naturally.22 Iron ore mining activities carried out in the past in the river catchments of Bhadra river has no relationship with river water quality now. Similarly, there was no significant changes in water quality were observed during peak floods of monsoon season in 2019. Weathering of rocks, geological formations in the catchment also contributes in maintaining the water quality. The concentrations of Dissolved oxygen indicated the water is free from soil erosion and due to forest cover. However, in most of the locations, DO is <5 mg/L indicated that a significant rate of decaying of organic matter in the river. Deforestation in the forest catchment is poses adverse effect on hydrological parameters and construction activities in the catchment and increased rate of application of fertilizers influence over the water quality of river. The tree cutting for construction of irrigation canal in the Tunga catchment is disastrous. Similarly, road widening activities in the catchment contribute to changes in water quality. Thus, the provisions of Draft Eco sensitive Area Notification while declaring the Eco sensitive Area (ESA) of Western Ghats on prohibition of changing land use and mining activities, blanket ban on red category industries, regulating construction activities and phasing out use of fertilizers and chemicals in Western Ghats has special consideration in maintaining river water quality.23 The Increase of forest cover in a catchment reduces the risk of water pollution.24 Extensive studies on use of fertilizers and deforestation by construction activities in river catchments would further helps in protection of aquatic life and maintenance of riparian ecosystem for sustainable ecological functions.
Acknowledgement
The authors are thankful for the support of Visweshwarayya Jala Nigam Ltd, Govt. of Karnataka, Shri. Shivanand M. Dambal, Chairman & Managing Director of Environmental Health and Safety Group of Companies, Bangalore and Ms. Prabha S.J for the guidance during the studies.
Funding
The author(s) received no financial support for the research, authorship, and/or publication of this article.
Conflict of Interest
The authors do not have any conflict of interest.
References
- T.V. Ramachandra. Hydrological Responses at Regional Scale to Landscape Dynamics. Journal of Biodiversity. 2014. 5(1,2). 11-32.
- Compendium of Silting of Reservoirs in India. Central Water Commission, Government of India. 2015. 3rd Edition. New Delhi. 1-219.
- Calder I, T. Hofer, S. Vermont and P. Warren. Towards a new understanding of forests and water. 2007. FAO.
- Kaimowitz, D. Forests and water: a policy perspective. Journal of Forest Research. 2004. 9(4). 289-291.
- Kreye, M. M., Adams, D. C., & Escobedo, F. J. The value of forest conservation for water quality protection. Forests. 2014. 5(5). 862-884.
- Wear, David & J.G, Greis. Southern Forest Resource Assessment: Summary of Findings. Journal of Forestry. 2002. 100. 6-14.
- Bren Leon. Forest hydrology & Catchment Management: An Australian Perspective. Ist Edition. 2015. Springer. Netherlands. Doi10.1007/978-94-017-9337-7.1-268.
- Krishnaswamy Jagdish, Milind Bunyan, Vishal K Mehta, Niren Jain, K Ullas Karanth. Impact of Iron Ore Mining on Suspended Sediment Response in a Tropical Catchment in Kudremukh, Western Ghats, India. Forest Ecology and Management. 2006. 224. 187-98.
- Krishnaswamy J. M. Bunyan. V.K Mehta. N. Jain and K.U. Karanth. Impact of iron ore mining on suspended sediment response in a tropical catchment in Kudremukh, Westren Ghats, India. Forest Ecology and Management. 2006. 224. 187-198.
- Yogendra K. and E.T. Puttaiah. Water Quality Analysis of Tungabhadra River using Factor Analysis. Nature Environment and Pollution Technology. Techno science Publications.2007. Vol 6(3). 393-397.
- Krishna Basin. Central Water Commission and National Remote Sensing Centre, Government of India.2014. New Delhi. 1-180.
- Krishnamurthy, Y. L., Prakasha, H. M., Nanda, A., Krishnappa, M., Dattaraja, H. S., & Suresh, H. S. Vegetation structure and floristic composition of a tropical dry deciduous forest in Bhadra Wildlife Sanctuary, Karnataka, India. Tropical Ecology. 2010.51(2). 235.
- Drinking water specification. Bureau of Indian Standards. 2nd Revision. New Delhi, 2012. 1-16.
- Standard methods for the examination of water and wastewater. American Public Health Association. Water pollution control federation and water environment federation. 22nd Edition. 2012. 1 - 541.
- Water Quality Standards Handbook: Chapter 3: Water Quality Criteria. U.S. Environmental Protection Agency (EPA). 2017. EPA-823-B-17-001. EPA Office of Water, Office of Science and Technology, Washington, DC.
- Environment Protection Agency. Volunteer Estuary Monitoring Manual. A Methods Manual. Second Edition, 2006. Office of Wetlands, Oceans and Watersheds to The Ocean Conservancy. 1-396.
- Deborah Chapman. Water Quality Assessments - A Guide to Use of Biota, Sediments and Water in Environmental Monitoring. Second Edition. 1996. ISBN 0419 215905(HB) 0419216006(PB).UNESCO/WHO/UNEP.
- James H. Thorp, Alan P. Covich. Ecology and Classification of North American Freshwater Invertebrates. 3rd Edition. 2009. ISBN: 978-0-12-374855-3, Elsevier Publications. London. UK.
- Knorr, K. H. DOC-dynamics in a small headwater catchment as driven by redox fluctuations and hydrological flow paths—Are DOC exports mediated by iron reduction/oxidation cycles?.Biogeosciences.2013.10(2).891–904, doi:10.5194/bg-10-891-2013.
- Sara M. Ekstrom, Olof Regnell , Heather E. Reader , P. Anders Nilsson, Stefan Lofgren, and Emma S. Kritzberg. Increasing concentrations of iron in surface waters as a consequence of reducing conditions in the catchment area. 2016. Journal of Geophysical Research: Biogeoscienes.121.479-493.Doi:10.1002/2015JG003141.
- Mahesh N. Asima Nusrath. Sajan C.P. Impact of Iron Ore mining on sedimentation load in Bhadra river – A case study. mySCIENCE. 2012. VI(II). 20-33.
- Necla Koralay and Omer Kara. Forestry Activities and Surface Water Quality in a Watershed. European Journal of Forest Engineering. 2018. 4(2). 70-82. DOI: 10.33904/ejfe.438621.
- Draft Notification on declaring Eco Sensitive Area of Western Ghats. Ministry of Environment, Forests and Climate Change, Govt. of India. 2018. S.O 5135 (E).
- Travis Warziniack, Chi Ho Sham, Robert Morgan and Yasha Feferholtz, Effect of Forest Cover on Water Treatment Costs. Water Economics and Policy. 2017. Vol 3(4). 1-19. Doi.org/10.1142/S2382624X17500060.


