Water Quality Assessment of Schools in Solan District of Himachal Pradesh
Aarti Sharma1
and R K Aggarwal1
*

http://dx.doi.org/10.12944/CWE.15.2.13
Assessment of drinking water quality was done by selecting Nine Government senior secondary schools of three blocks in Solan district of Himachal Pradesh. The water quality parameters such as physical, chemical and biological parameters of water samples were analyzed. The water quality parameters such as temperature, pH, EC, TDS, temperature, BOD and COD ranged from 18.3 to 21.2°C,6.95 to 7.13, 0.24 to 0.51 dS m-1, 107.90 to 194.02 mg l-1, 0.69 to 2.26 mg l-1 and 56.50 to 119.75 mg l-1; trace elements (As, Cd, Zn, Pb, Cu, Mn and Ni) nil, 0.000 to 0.001 mg l-1, 0.001 to 0.003 mg l-1, 0.00 to 0.01 mg l-1, 0.00 to 0.02 mg l-1, 0.03 to 0.06 mg l-1 and 0.00 to 0.02 mg l-1respectively and biological parameters like total coliform as 20.00 to 54.00 MPN ml-1, which were within the permissible limits except Fe which ranged from 0.63 to 0.95 mg l-1 was above the permissible limits. The water quality index of drinking water for nine schools was in the rangeof 25.80 to 36.38,which categorized as excellent.
Copy the following to cite this article:
Sharma A, Aggarwal R. K. Water Quality Assessment of Schools in Solan District of Himachal Pradesh. Curr World Environ 2020; 15(2).
DOI:http://dx.doi.org/10.12944/CWE.15.2.13Copy the following to cite this URL:
Sharma A, Aggarwal R. K. Water Quality Assessment of Schools in Solan District of Himachal Pradesh. Curr World Environ 2020; 15(2). Available from: https://bit.ly/3fhUbJy
Download article (pdf)
Citation Manager
Publish History

Introduction
Water is considered as most essential and important natural resources for human beings, animals and plants. It is difficult to imagine an environment without water. Man can live only three or four days without water. The available total water quantity remains constant globally and is sufficient to meet demands of world living beings, its quality and improper management poses concerns of water crises. Although our planet has nearly 71 per cent of water, only 3 per cent of it is fresh.1 Potable and drinking water plays an important role in the growth of the good health of a nation. Water should be suitable for drinking and food preparation2 as it is a better solvent, absorb impurities quickly resulting change in its sensory characteristics. Polluted water affects its normal functioning and properties.3
Water pollution is one of the major problems as a result of human activities such as domestic wastes, agriculture wastes, industrial pollutants, particulate matter from construction activities, and waste from people littering. Polluted water is responsible for water borne diseases. The trace elementsin water also play harmful roles to health of living beings. The impurities present innatural water are, living impurities, organic impurities and water borne microorganism.These necessitate the need to manage and use water more efficiently.
However, poor water quality continues to pose a major warning to human health worldwide. Globally, water borne diseases cause thousands of deaths particularly children in developing countries.4 Water pollution has the main effect on children and causes many diseases like cholera, diarrhea, typhoid and dysentery.
The study aimed to assess the water quality supplied to the educational institutes of Solan district by evaluating the physico-chemical characteristics and bacteriological quality parameters expressed as water quality Index (WQI) which is best technique to provide information to policy makersby combining complex data and giving a score to express WQI.5
Materials and Methods
Three blocks and nine sites namely Solan, Kandaghat and Dharampur of Solan district of Himachal Pradesh were considered for the present study. Solan district is located between 30o30” and 31o50” N Latitude and 76o42” to 77o20” E Longitude (Fig 1). Acid washed plastic bottlesof 1 L capacity as per standard procedure were used to collect water samples6 from selected schools during two seasons i.e., summer and winter with two replications. Drinking water samples were collected from running tap continuously for five minutes.7 The physical parameters such as colour, odour, temperature (oC) were recorded using standard procedures. The pH was measured by using pH meter (Model-1013 of EIA make), EC and TDS were determined by conductivity TDS meter (Model-1601 of EIA make) and expressed in dS m-1 and mg l-1 respectively. The BOD was determined by using 5 day BOD test based on 5210B method.8 The COD was determined by oxidizing water sample with hot H2SO4 solution of potassium chromate with silver sulphate as the catalyst. The water samples were digested at 148oC in the pre-heated thermo-reactor (TR 320) for 2 hrs. Chloride was masked with mercury sulphate, the concentration of Cr3+ ions was then determined photometrically by using Spectroquant Pharo 300 (Merk make) expressed in mg l-1. The observed procedure wasrelated to EPA 410.4 US Standard method 5220 D, and ISO 15705.The trace elements such as As, Cd, Pb, Fe, Mn, Cu, Ni and Zn were estimated by using standard kits and Inductively Coupled Plasma of Atomic Emission Spectroscopy-6300 DUO (ICAP-6300 Duo) and expressed as mg l-l. The number of the coliform groups was estimated by preforming standard procedure, carried out by the multiple tube dilution tests (presumptive test, confirmed test, or completed test) and followed by [8] by the membrane filter technique.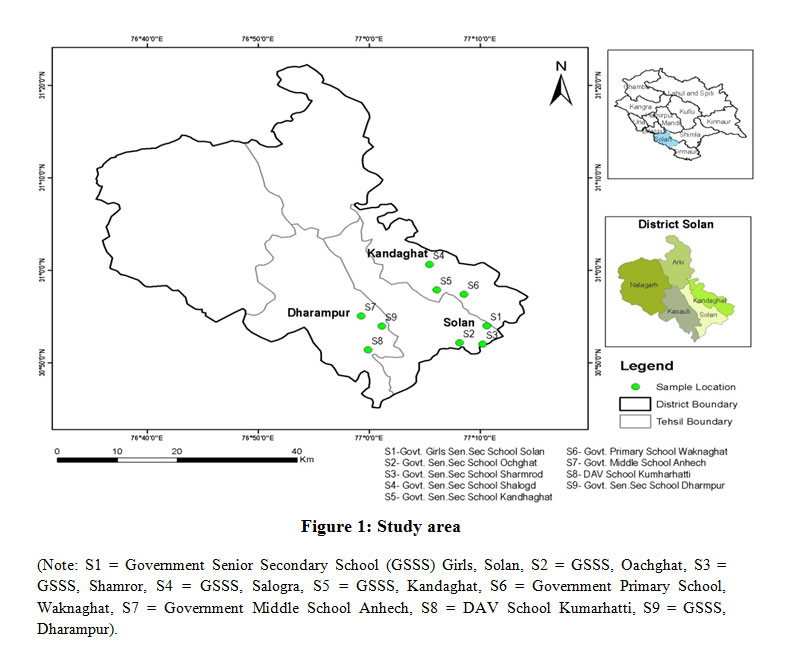 |
Figure 1: Study area Click here to View Figure |
Results and Discussion
Physical Parameters
The colour of tap water in selected educational institutes was colourless in all the selected locations. The odour of tap water in selected educational institutes was odour less in all the selected locations. The temperature of tap water ranged from 18.3 to 21.2oC in selected educational institutes (Table1). Among the seasons, the mean temperature was found higher (24.9oC) in summer and lower (13.2oC) in winter season. The temperature of drinking water in selected schools was within the prescribed limits of BIS. The results are conformity with the findings of Trivedi3 and Rana9 who observed maximum temperature in summer season.
Table 1: Seasonal variation of Physical Parameters of tap water in selected Educational Institutes
|
Schools |
Colour |
Odour |
Temperature |
||
|
|
Seasons |
|
Seasons |
|
|
|
|
W/S |
W/S |
Winter |
Summer |
Mean |
|
S1 |
Colourless |
Odourless |
12.3 |
24.5 |
18.4 |
|
S2 |
Colourless |
Odourless |
12.6 |
25.5 |
19.0 |
|
S3 |
Colourless |
Odourless |
14.9 |
27.6 |
21.2 |
|
S4 |
Colourless |
Odourless |
12.3 |
24.3 |
18.3 |
|
S5 |
Colourless |
Odourless |
13.8 |
23.3 |
18.5 |
|
S6 |
Colourless |
Odourless |
12.6 |
25.6 |
19.1 |
|
S7 |
Colourless |
Odourless |
14.8 |
24.5 |
19.6 |
|
S8 |
Colourless |
Odourless |
12.6 |
24.9 |
18.7 |
|
S9 |
Colourless |
Odourless |
13.2 |
23.9 |
18.6 |
Chemical Parameters
The pH of water was in the range of 6.95 and 7.13 of tap water in all the selected locations. Among the seasons, the mean pH was found higher (7.07) in summer and lower (6.99) in winter season. The pH of drinking water was within the prescribed limits of BIS. The higher pH during summer seasons due to more evaporation and less dilution in comparison with other seasons.10 The EC of tap water was in the range of 0.24 and 0.51 dSm-1in all the selected schools. Among the seasons, the mean EC was found higher (0.35dSm-1) in summer and lower (0.32 dSm-1) was in winter season. The EC of tap water in the schools was within the limits of WHO and similar to the findings of Jadhav.11
The TDS of tap water was in the range of 107.90 and194.02 mgl-1in selected institutes. Among the seasons, the meanTDS was found higher (143.77 mgl-1) in summer and lower (133.83 mgl-1) in winter season. The TDS of tap water in selected schools was within the limits prescribed by BIS. The obtained trend is in confirmation with the findings of Sharma12 and Rao.13 The BOD of tap water was found to be between 0.69 and 2.26 mgl-1 in all the selected educational institutes. Among the seasons, the meanBOD was found higher (1.49 mgl-1) in summer and lower (1.39 mgl-1) in winter season. The BOD of tap water was within the limits prescribed by BIS. The results are similar to the findings of Trivedi14and Mathur15who have indicated enrichment of water sources with organic matter cause for high BOD.The COD of drinking water ranged between 56.50 and 119.75 mgl-1 in selected educational institutes. Among the seasons, the meanCOD was found higher (98.16 mgl-1) in summer and lower (82.50 mgl-1) in winter season. The COD of drinking water was within the limits as per of BIS. The results are similar to the findings of Joseph16and Chattopadhyay17 who also reported similar results where they found maximum COD in summer season. The results are summarized in Table 2.
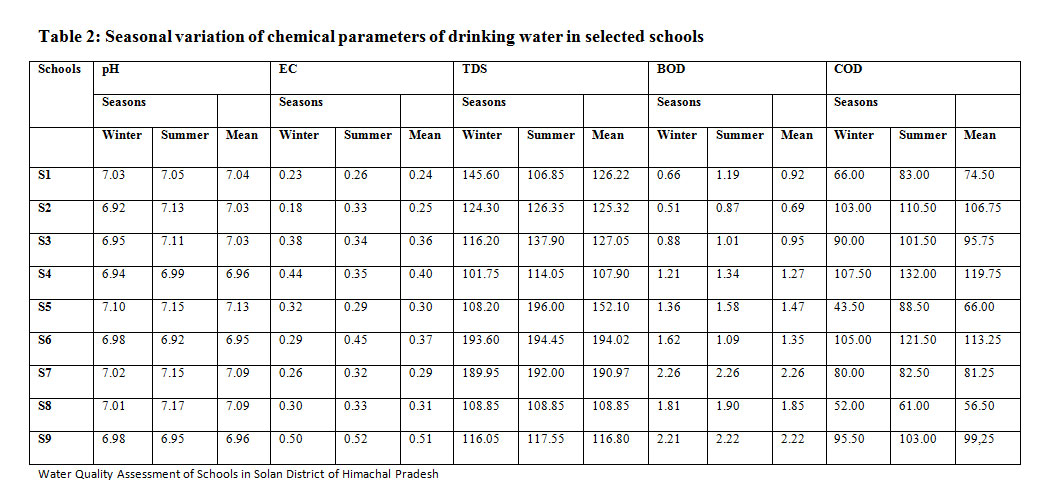 |
Table 2: Seasonal variation of chemical parameters of drinking water in selected schools Click here to View Table |
Heavy Metals
The concentration of As of tap water was found to be 0 mgl-1 in selected educational institutes and within the permissible limits as given by BIS.The concentration of Cd of tap water was in the range of 0.000 and 0.001 mgl-1 in selected educational institutes. Among the seasons, the meanCd was found higher (0.001 mgl-1) in summer and lower (0.000 mgl-1) in winter season. The Cd of drinking water was within the prescribed limits of BIS. The results are similar to the findings of Lokeshwari18 who reported Cd in the sampled water much below the permissible levels. The concentration of Zn of tap water ranged from 0.001 to 0.003 mgl-1 in selected educational institutes. Among the seasons, the meanZn was found higher (0.002 mgl-1) in summer and (0.001 mgl-1) in winter season. The concentration of Zn indrinking water in the schools was within the prescribed limits of BIS.The results are in confirmation of the findings of Shanbehzadeh19 that the concentration of Zn was within the standard range for drinking water. The Pb concentration of drinking water was in the range of 0.00 and 0.01 mgl-1in selected educational institutes. Among the seasons, the mean Pb was found higher (0.01 mgl-1) in summer and lower (0.00mg l-1) in winter season. The Pb of drinking water was within the prescribed limits of BIS. The results are within the findings of Wogu20 where Pb had the least mean content of 0.01 mg l-1.The concentration of Cu of tap water was in the range of 0.00 to 0.02 mgl-1in selected educational institutes. Among the seasons, the mean Cu was found higher (0.01 mgl-1) in summer and lower (0.00 mgl-1) in winter season. The Cu of drinking water was within the prescribed limits of BIS. The results are similar to the findings of Shanbehzadeh19 who reported that the mean concentration of Cu was within the standard range for drinking water. The Fe concentration of tap water was in the range of 0.63 and 0.95 mgl-1 in selected educational institutes. Among the seasons, the mean Fe was found higher (0.88 mgl-1) in summer and lower (0.75 mgl-1) Fe in winter. The Fe of drinking water was above the prescribed limits of BIS because soil in Himachal Pradesh is considered to be rich in iron. The results are in conformity of the findings of Puri21 who found increase in Fe concentration during summer. The Mn concentration of tap water was in the range of 0.03 and 0.06 mgl-1in selected educational institutes. Among the seasons, the mean Mn was found higher (0.05 mgl-1) in summer and lower (0.04 mgl-1) Mn in winter season. The Mn of drinking water was within the prescribed limits of BIS. The results are in conformity of the findings of dwivedi22 who found that the manganese content in water samples was below the prescribed limit.The Ni content of tap water was in the range of 0.00 and 0.02 mgl-1in selected educational institutes. Among the seasons, the meanNi was found higher (0.02 mgl-1) in summer and lower (0.00 mgl-1) Ni in winter season. The Ni content of tap water was within the prescribed limits of BIS. The results are similar to the findings of Lokeshwari18 where it was found that all the samples from various sources contain Ni much below thelimits prescribed. The concentration of heavy metals has been presented in Table 3.
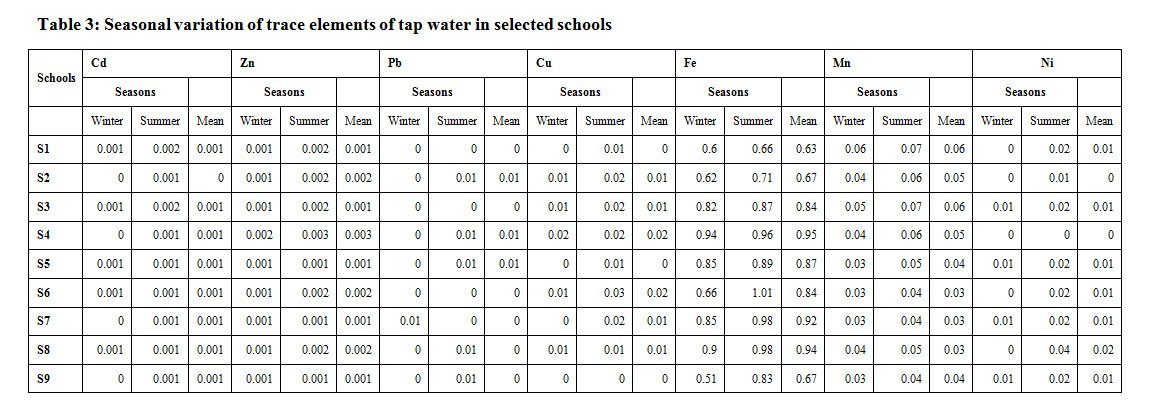 |
Table 3: Seasonal variation of trace elements of tap water in selected schools Click here to View Table |
Biological Parameters
The total coliform of tap water ranged from 20.00 to 54.00 MPNml-1 in selected educational institutes (Table 4). Among the seasons, the meantotal coliform was found higher (41.53 MPN ml-1) in summer and lower (34.11 MPN ml-1) total coliform in winter season. The total coliform of water was within the prescribed limits of BIS. The results are within the findings of Shaikh23 who observed maximum concentration of total coliform in summer and minimum in winter.
Table 4: Seasonal variation of Biological Parameters of tap water in selected Educational Institutes
|
Schools |
Total Coliform |
||
|
|
Seasons |
|
|
|
|
Winter |
Summer |
Mean |
|
S1 |
25.00 |
33.00 |
29.00 |
|
S2 |
39.00 |
58.00 |
48.50 |
|
S3 |
52.00 |
34.00 |
43.00 |
|
S4 |
34.00 |
36.00 |
35.25 |
|
S5 |
19.00 |
21.00 |
20.00 |
|
S6 |
35.00 |
57.00 |
46.00 |
|
S7 |
21.00 |
26.00 |
23.50 |
|
S8 |
34.00 |
52.00 |
43.25 |
|
S9 |
52.00 |
56.00 |
54.00 |
Correlation among Water Quality Parameters
The water quality parameters were correlated with each other significantly during winter. The pH was correlated negatively with chemical oxygen demand (r = -0.86, p<0.01) copper (r = -0.68, p<0.05). Akotoet24 have reported similar results and total coliform (r = -0.69, p<0.05). The temperature has highly significant +ve correlation with nickel (r=0.87, p<0.01). The biological oxygen demand has significant -ve correlation with manganese (r=0-0.71,p<0.05). The Arsenic has highly significant and +ve correlation with copper (r = 0.66, p<0.05). Zinc has highly significant and +ve correlation with copper (r = 0.70, p<0.05) and iron (r = 0.70, p<0.05). Kar25 have also reported similar results (Table 5).
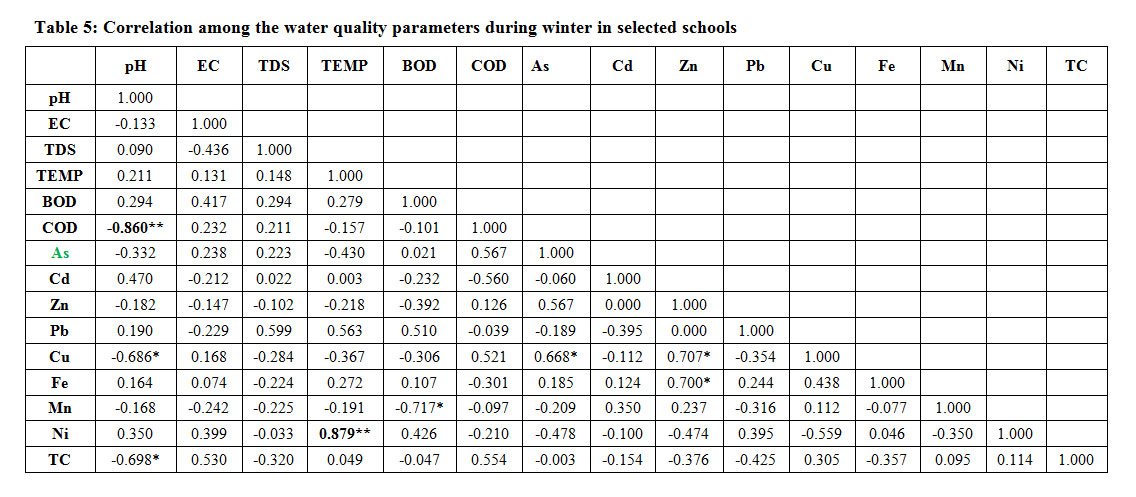 |
Table 5: Correlation among the water quality parameters during winter in selected schools Click here to View Table |
The water quality parameters were correlated with each other significantly during summer. The pH showed significant positive correlation with electrical conductivity (r = 0.725, p<0.05) and chemical oxygen demand (r = 0.686, p<0.05). Tripathi26 have reported similar findings. The biological oxygen demand showed significant and -ve correlation with manganese (r= -0.672, p<0.05). The chemical oxygen demand showed highly significant -ve correlation with nickel (r = -0.83, p<0.01). The arsenic showed significant and -ve correlation with iron (r = -0.79, p<0.05) and +ve with cadmium (r = 0.060) and lead (r = 0.350). Similar finding has been reported by Akotoet24.The cadmium showed significant and +ve correlation with manganese (r=0.77, p<0.05) presented in Table 6.
 |
Table 6: Correlation among the water quality parameters during summer in selected schools Click here to View Table |
Water Quality Index (WQI)
The WQI ranged from 25.80 to 36.38 in selected educational institutes (Table7). The WQI for all the selected educational institutes in Solan district categorized as excellent.
Table 7: Water quality index in selected Educational Institutes
|
|
Schools |
WQI |
|
1 |
S1 |
25.80 |
|
2 |
S2 |
28.16 |
|
3 |
S3 |
31.38 |
|
4 |
S4 |
35.75 |
|
5 |
S5 |
32.03 |
|
6 |
S6 |
32.72 |
|
7 |
S7 |
36.38 |
|
8 |
S8 |
33.31 |
|
9 |
S9 |
30.91 |
Conclusions
The study revealed that various water quality parameters of drinking water in selected educational institutes were found to be within the prescribed limits of BIS and WHO except iron (0.63 to 0.95 mgl-1), which was above the limit. The(WQI) in selected schools was found to be excellent.
Acknowledgment
The facilities provided by the department of Environmental Science, Dr Y S Parmar University of Horticulture & Forestry, Nauni (Solan) are highly acknowledged.
Funding Source
Funds were provided by the department of Environmental Science, Dr Y S Parmar University of Horticulture & Forestry, Nauni (Solan) - 173 230 (HP)
Conflict of Interest
The authors do not have any conflict of interest.
Reference
- Dugan P. 2012. Biochemical Ecology of Water Pollution.Springer Science and Business Media. 152p.
- Tihansky DP. 1974. Economic damage from residential use of mineralized water supply. Water Resources Research.10: 145-154.
- Trivedi P, Bajpai A and Thareja S. 2010.Comparative study of seasonal variation in physicochemical characteristics in drinking water quality of Kanpur, India with reference to 200 MLD filtration plant and ground water.Nature and Science 8: 11-17.
- Schafera AI, Rossitera HMA, Owusub PA, Richardsc BS and Awuah E. 2009. Physicochemical water quality in Ghana: Prospects for water supply technology implementation. Desalination 248: 193-203.
- Reza R and Singh G. 2010. Assessment of ground water quality status by using Water Quality Index method in Orissa, India.World Applied Sciences Journal 9: 1392-1397.
- APHA. 1998. Standard Methods for the Examination of Waters and Wastes Water. (20thEdition.). Washington DC. 161p.
- Iqbal MA and Gupta SG. 2009. Studies on heavy metal ion pollution of ground water sources as an effect of municipal solid waste dumping. African Journalof Basic and Applied Sciences 1: 117-122.
- APHA. 2012. Standard Methods for the Examination of Waters and Wastes Water. (21stEdition.). Washington DC. 161p.
- Rana A, Bhardwaj SK and Thakur M. 2016.Surface water quality and associated aquatic insect fauna under different land-uses in Solan, Himachal Pradesh. The Indian Ecological Society 43: 58-64.
- Salve BS and Hiware CJ. 2006. Studies on water quality of Wanparakalpa Reservoir, Nagapur, near ParliVaijnath, district Beed, Marathwadaregion. Journal of Aquatic Biology 21: 113-117.
- Jadhav SD, Sawant RS, Godghate AG, Patil S R, and PatilRS. 2012. Assessment of ground water quality of AjaraTahsil from Maharashtra. Rasayan Journal of Chemistry5: 246-249.
- Sharma R and Kapoor A. 2010. Seasonal variations in physical, chemical and biological parameters of lake water of Patna bird sanctuary in relation to fish productivity.World Applied Sciences Journal 1:129-132.
- Rao GT, Rao G, Ranganathan VVS, Surinaidu KL, Mahesh J andRamesh G. 2011. Assessment of groundwater contamination from a hazardous dump site in Ranipet, Tamil Nadu, India.Hydrogeology Journal 19: 1587-1598.
- Trivedi RK and Goel PK. 1986.Chemical and Biological method for Water Pollution Studies.Environmental Publication, Karad, India. 126p.
- Mathur P, Agarwal S and Nag M. 2007. Assessment of physico-chemical characteristics and suggested restoration measures for Pushkar Lake, Ajmer Rajasthan (India). In: Proceedings of Taal 2007: The 12th World Lake Conference.pp.1518-1529.
- Joseph PV and Jacob C. 2010. Physicochemical characteristics of Pennar River: A fresh water wetland in Kerala, India. Journal of Chemistry 7: 1266-1273.
- Chattopadhyay SK, Rani LA and Sangeetha PV. 2005. Water quality variations as linked to land use pattern Kerala. Current Sciences 89: 12-17.
- Lokeshwari H and Chandrappa GT. 2006. Heavy metals content in water, water hyacinth and sediments of Lalbagh Tank, Bangalore (India). Journal of Environmental Science and Engineering 48: 183-188.
- Shanbehzadeh S, VahidDastjerdi M, Hassanzadeh A and Kiyanizadeh T. 2014. Heavy metals in water and sediment: a case study of Tembi River. Journal of Environmental and Public Health 193: 203-214.
- Wogu MD and Okaka CE. 2011. Pollution studies on Nigerian rivers: heavy metals in surface water of warri river, Delta State. Journal of Biodiversity and Environmental Sciences 1: 7-12.
- Puri R. 2011.Study regarding lake water pollution with heavy metals in Nagpur City (India).International Journal of Chemical, Environmental andPharmaceutical Research2: 34-39.
- Dewivedi S and Tiwari IC. 1997. A study on heavy metal in the Ganga water at Varanasi. Pollution Research16: 265-270.
- Shaikh AM and Mandre PN. 2009. Seasonal study of physico-chemical parameters of drinking water in Khed (lote) industrial area. International Research Journal 2: 169-172.
- Akoto O, Bruce TN and Darko D. 2008. Heavy metals pollution profiles in streams serving the Owabireservoir.African Journal of Environmental Science and Technology 2: 354-359.
- Kar D, Sur P, Mandai SK, Saha T and Kole RK. 2008. Assessment of heavy metal pollution in surface water. International Journal of Environmental Science and Technology5: 119-124.
- TripathiB ,Pandey R , Raghuvanshi D, Singh H, Pandey V and Shukla DN. 2014. Studies on the physico-chemical parameters and correlation coefficient of the river Ganga at Holy Place Shringverpur, Allahabad. Journal of Environmental Science, Toxicology and Food Technology 8: 29-36.


