Geospatial Groundwater Quality Assessment and Identification of Polluted Risky Regions in Jamui District of Bihar with Special Reference to Uranium and Fluoride Concentration
Subhash Prasad Singh1
*
 and Palash Kumar Dutta1
http://dx.doi.org/10.12944/CWE.15.3.30
Copy the following to cite this article:
Singh S. P, Dutta P. K. Geospatial Groundwater Quality Assessment and Identification of Polluted Risky Regions in Jamui District of Bihar with Special Reference to Uranium and Fluoride Concentration. Curr World Environ 2020;15(3).
DOI:http://dx.doi.org/10.12944/CWE.15.3.30Copy the following to cite this URL:
Singh S. P, Dutta P. K. Geospatial Groundwater Quality Assessment and Identification of Polluted Risky Regions in Jamui District of Bihar with Special Reference to Uranium and Fluoride Concentration. Curr World Environ 2020;15(3). Available From: https://bit.ly/2HtUkhC
Download article (pdf) Citation Manager Publish History

Groundwater is the water present beneath Earth’s surface in pore spaces of the sediments and in the fracture of rock formation. Precipitation infiltrates below the ground surface into the aquifers causing groundwater. Water percolates downward after having saturated soil zone. Rain can cause the water table to rise whereas continuous extraction of ground water can cause the level to fall. Since groundwater is part of the hydrologic cycle, contaminants in other parts of the cycle, such as the atmosphere or bodies of surface water, can eventually be transferred into our groundwater supplies. Pollutants released to the ground due to surface activities such as ill agricultural practices, domestic / industrial waste disposal, mining, etc. and making their way down into underground water specially in shallow aquifers particularly in the permeable unconsolidated deposits cause groundwater contamination1.
Drinking contaminated groundwater can have serious health effects. Approximately one third of the world’s population use groundwater for drinking2. More than 80% of India’s population depends on groundwater for drinking and irrigation purposes. About 22% groundwater in India is either dried up or in the overexploited or critical categories as per the report of ‘Dynamic Ground Water Resources of India3.’ A decrease in availability and quality of fresh water and a significant increase in demand for groundwater cause problems related to environmental sustainability4,5. The impacts of anthropogenic activities, the interaction of surface water and groundwater, rock water interaction and over-extraction of groundwater lead to deterioration of water quality6 for drinking purposes in term of physical, chemical and radiological characteristics. A lot of attention has been drawn in the past in Jamui district due to fluoride contamination in ground water and its toxicity in human body7. There are various pathways of fluoride to enter in the groundwater8 out of which interaction of fluoride containing mineral with aquifer water is the prominent one. The fluoride hazard mainly includes dental fluorosis or skeletal or non-skeletal fluorosis resulted from excess exposure9. A naturally occurring radionuclide Uranium is increasingly becoming a concern for people on the globe these days for its radioactivity, toxicity and its carcinogenic potency10-15. It is found in all matrices of environment such as rocks, soil, air, surface / underground water, in fauna and flora in varying amounts. Uranium contaminant in water is either geogenic or man-made16. It can find its way into drinking water when groundwater or rainwater dissolves mineral that contains uranium17,18. Access to safe drinking water has become a challenge in developing countries in the context of growing population and increasing water contamination18-25.
Groundwater pollution potential in the study zone has been assessed by means of proper data analysis of water quality parameters such as pH, TDS, conductance, DO, ORP, salinity, alkalinity, hardness, calcium, magnesium, iron, uranium, carbonate, bicarbonate, fluoride, chloride, sulphate, nitrate, phosphate, etc as per standard protocol. Recorded data from ongoing monitoring program, hydro geological and geographical information, published studies, and environmental impact assessments are the important factors for evaluation of water quality. The Fig.1 shows location of Jamui district26 in Bihar (India).
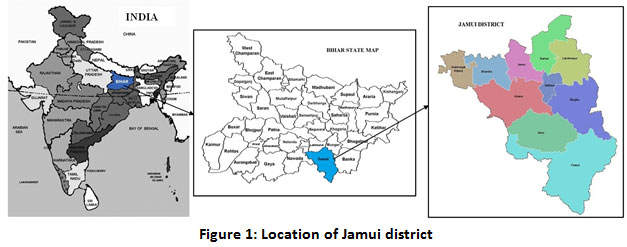 |
Figure 1: Location of Jamui district Click here to view figure |
Study area27
Material and Method
Sampling and Measurement of In-Situ Parameters
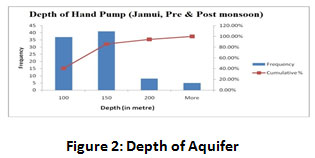 |
Figure 2: Depth of Aquifer Click here to view figure |
pH, temperature, total dissolved solids (TDS), electrical conductivity (EC), dissolved oxygen (DO), salinity, oxidation reduction potential (ORP) etc. were measured using field instruments immediately after the sample was collected. One litre water sample was collected in a neck to neck filled bottle for analysis of U, F-, Cl-. NO3-, SO42- and PO43-. Duplicate acidified sample (1ml of Conc. HNO3 for 500 ml of water) was also collected from each sampling site.
Sample Analysis in the laboratory
Major cations and anions were analyzed in the collected water samples at the chemistry lab of A N College, Patna. LED Fluorimeter LF-2a (Quantalase, Indore) was used to measure uranium concentration as per BARC Standard Protocol for National Uranium Project (NUP)29. Fluoride concentration was measured using Ion Selective method. SO42-, PO43- and NO3-, total hardness, total alkalinity and Cl- were analysed as per standard protocol for NUP29 and APHA30.
Result
The descriptive statistical analysis of uranium and associated water quality parameter of groundwater in the study area during pre-monsoon and post-monsoon is shown in table-1.
Table 1: Descriptive statistical analysis of Uranium and associated water quality parameter|
Parameters |
Pre-monsoon |
Post-monsoon |
BIS31 limits (Desirable – Permissible) |
||||||
|
Min |
Max |
Average |
Median |
Min |
Max |
Average |
Median |
||
|
pH |
6.5 |
8.86 |
7.55 |
7.4 |
6.36 |
8.01 |
7.04 |
6.99 |
6.5 – 8.5 |
|
TDS (ppm) |
72 |
1134 |
393.67 |
324 |
91 |
1240 |
355.33 |
237 |
500ppm – 2000ppm |
|
EC (µS/cm) |
134 |
1985 |
724.29 |
603 |
162 |
2310 |
646.35 |
422 |
- |
|
Salinity (ppm) |
30 |
1130 |
391.813 |
320 |
100 |
1390 |
367.826 |
210 |
|
|
ORP (mV) |
-253 |
44 |
-32.11 |
-19 |
-44 |
40 |
5.52 |
7.0 |
- |
|
Temp. (oC) |
23.6 |
33 |
28.75 |
29 |
24.6 |
29.1 |
26.66 |
26.5 |
- |
|
DO (ppm) |
2.9 |
14.9 |
6.22 |
6.3 |
3.5 |
5.7 |
4.58 |
4.6 |
- |
|
F- (ppm) |
0.1 |
5.14 |
1.053 |
0.79 |
0.13 |
3.6 |
0.97 |
0.72 |
1ppm - 1.5ppm |
|
Cl- (ppm) |
7.09 |
255.24 |
46.01 |
28.36 |
10.64 |
287.15 |
65.81 |
39.0 |
250ppm – 1000ppm |
|
NO3- (ppm) |
0.5 |
12.3 |
4.53 |
4.2 |
0.5 |
8.90 |
3.68 |
3.90 |
45ppm – 100ppm |
|
SO42- (ppm) |
1.0 |
115.47 |
17.77 |
8.14 |
2.06 |
165.08 |
27.70 |
12.98 |
200ppm – 400ppm |
|
PO43- (ppm) |
0.1 |
2.01 |
0.15 |
0.1 |
0.33 |
0.74 |
0.41 |
0.37 |
- |
|
U (ppb) |
0.50 |
20.07 |
4.89 |
1.60 |
0.50 |
29.45 |
8.02 |
3.90 |
60 (AERB32) |
|
Total Hardness (ppm) |
30 |
615 |
221.32 |
185 |
45 |
695 |
204.56 |
140 |
300ppm-600ppm |
|
Ca Hardness (ppm) |
15 |
430 |
102.86 |
80 |
35 |
550 |
156.30 |
105 |
- |
|
Mg Hardness (ppm) |
10 |
480 |
118.46 |
95 |
10 |
145 |
48.26 |
40 |
- |
|
Total Alkalinity (ppm) |
5 |
110 |
41.26 |
35 |
10 |
105 |
46.74 |
40 |
200ppm – 600ppm |
|
Bicarbonate (mg of CaCO3) |
5 |
110 |
41.26 |
35 |
10 |
105 |
46.74 |
40 |
|
pH, EC, TDS, Salinity and ORP in the water samples were found to vary in the range of 6.5-8.86, 6.36-8.01; 134-1985µS/cm, 162-2310µS/cm; 72ppm-1134ppm, 91ppm-1240ppm; 30ppm-1130 ppm, 100ppm-1390ppm and -253mV to 44mV, -44mV to 40mV respectively during pre- and post- monsoon. The stated values fall almost within the permissible limit of BIS.
Distribution of fluoride concentration in water samples during pre- & post- monsoon is addressed by fig. 3 & fig.4
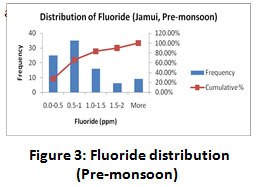 |
Figure 3: Fluoride distribution (Pre-monsoon) Click here to view figure |
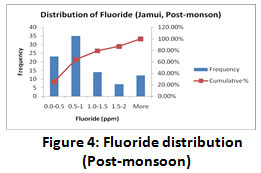 |
Figure 4: Fluoride distribution (Post-monsoon) Click here to view figure |
Fluoride concentration varies in the range of 0.1ppm-5.14ppm with the median value of 0.79ppm and 0.13ppm-3.6ppm with the median value of 0.72ppm during pre- & post-monsoon respectively. The values of fluoride concentration exceed the permissible limit of BIS and WHO33 in some of the analyzed samples
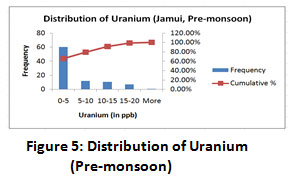 |
Figure 5: Distribution of Uranium (Pre-monsoon) Click here to view figure |
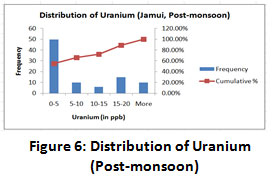 |
Figure 6: Distribution of Uranium (Post-monsoon) Click here to view figure |
The distribution of Uranium during pre- & post monsoon is shown by fig.5 & fig.6. Uranium level in analyzed water samples varies in the range of <0.5-20.07ppb and <0.5-29.45ppb with a median value of 1.6ppb and 3.9ppb respectively in pre- & post-monsoon. Rest of the chemical parameters is found to be well within the permissible limit of BIS.
Discussion
Alkaline nature of groundwater was recorded irrespective of the aquifer sampled. The cations and anions dissolved are well within ±5% of normalized inorganic charge balance. Elevation of fluoride concentration in 16.48% water samples during pre-monsoon and in 20.87% water samples during post-monsoon from aquifers of varying depth has been observed higher than WHO and BIS limits. It is indicative of water rock interaction. The sources of human exposure to the increased concentration of fluoride34-36 in drinking water have drastically increased. In view of the cases of fluoride toxicity37, it is urgently needed to be addressed in the study area.
Spatial statistics was used to identify the uranium hotspot38 in groundwater in the study area during pre- & post-monsoon as represented through fig.7 & fig.8. At some places as is evident from the figure, it is in borderline and need constant monitoring. Fluctuation of uranium concentration has been found in water samples from aquifers of different depth.
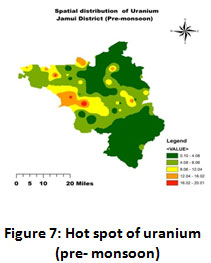 |
Figure 7: Hot spot of uranium (pre- monsoon) Click here to view figure |
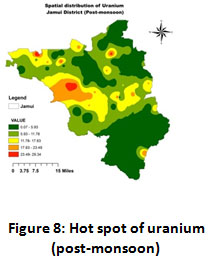 |
Figure 8: Hot spot of uranium (post-monsoon) Click here to view figure |
Pearson correlation has been established among analyzed parameters during pre- and post-monsoon (table-2 & table-3).
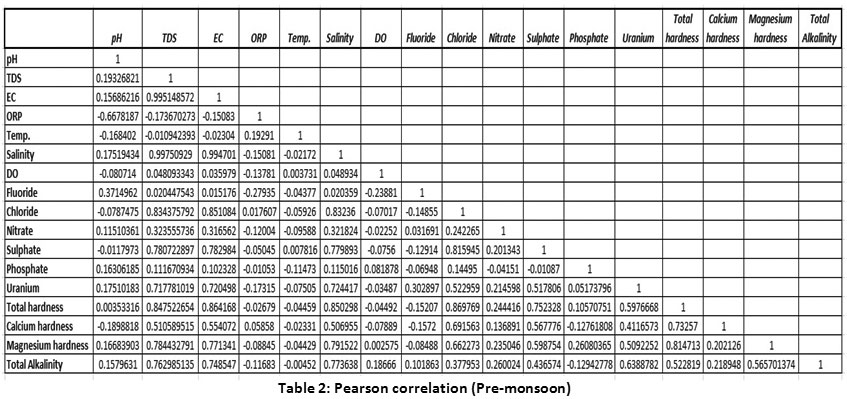 |
Table 2: Pearson correlation (Pre-monsoon) Click here to view table |
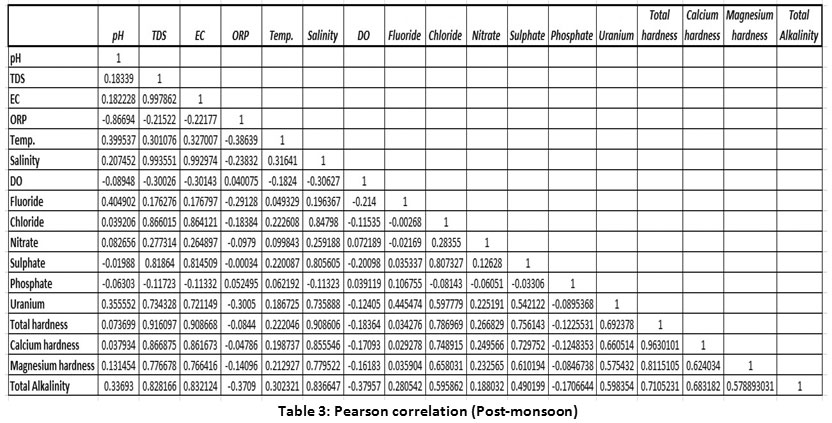 |
Table 3: Pearson correlation (Post-monsoon) Click here to view table |
A positive correlation of fluoride with pH, total dissolved solid, electrical conductance, salinity, uranium and total alkalinity was observed39 during pre-and post- monsoon. Strong correlation of uranium has been observed with TDS, EC, salinity, total hardness, total alkalinity, fluoride, chloride and sulphate. However, there is negligible correlation between uranium with phosphate. Likely, no correlation has been observed between fluoride and chloride.
Conclusion
Current finding involves the area where general water quality is found to be suitable but some important parameters such as pH and fluoride concentration exceeded the permissible limit of BIS and WHO at several places. Fluoride concentration in 16.48% water samples during pre-monsoon and in 20.87% water samples during post-monsoon were found higher than BIS and WHO acceptable limit of 1ppm-1.5ppm. Elevated fluoride level has been observed in varying aquifers of different depth which may be caused to water-rock interactions. It draws the attention of the authorities to supply de-fluoridated water to the residents for drinking purposes. However, uranium level in analyzed water samples were well within the safe standard limit of WHO, US EPA40 and AERB along with other associated water quality parameters during pre- and post-.monsoon but at some places it is in borderline and need constant monitoring. These results may provide useful information for control of groundwater pollution and its management in the study area with the time. The continuous assessment of such parameters is important for future perspective and awareness41,42. Educating the users and defluorinating the groundwater before consumption are essentially important for the resident.43,44 Implementation of rainwater harvesting schemes in the affected area may be a resilient and sustainable solution for dilution of elevated ionic concentration in water for drinking and irrigation purposes. Use of rainwater capture by check dams and other small system following simple treatment of coagulation, flocculation, filtration and chemical treatment may prove the ultimate economical solution for the fluoride menace in the study area based on the principal of “Prevention is better than cure” because of having good quality of surface water in the study zone.
Acknowlegdement
The authors are thankful to the residents of the study area for providing assistance in collecting the samples. The present work is a part of the research project funded by BRNS, DAE, Government of India, (GoI) vide NRFCC Letter no 36(4)/14/37/2015-BRNS/10046 dated 2nd May 2016. Hence, the financial support from the BRNS is acknowledged. Special thanks goes to Dr Ajay Kumar, Health Physics Division, BARC, Mumbai along with the member of TSC-4, NRFCC, BRNS, HPD, HS & E Group, BARC and NUP team members for their continual support.
Conflict of Interest
Author has no conflict of interest in this article.
Funding Sources
The author got no financial assistance from any government or non- government organization.
References
- Vandas S.J., Winter T.C., and Battaglin W.A. Water and the Environment. American Geosciences Institute Environmental Awareness Series 2002; p. 28-29.
- The United Nations World Water Development Report 2015.
- National Compilation on Dynamic Ground Water Resources of India, 2017.
- Alcamo J., Döll P., Henrichs T., Kaspar F., Lehner B., Rösch T., and Siebert S. Global estimates of water withdrawals and availability under current and future “business-as-usual” conditions, Hydrological Sciences Journal, 2003; 48:3, 339-348. https://doi.org/10.1623/hysj.48.3.339.45278.
CrossRef - National Geographic, Why Cape Town Is Running Out of Water, and Who’s Next. Published News Article, 5 March 2018. https://www.nationalgeographic.com/news/2018/02/capetown-running-out-of-water-drought-taps-shutoff-other-cities/
- World Economic Forum, The Global Risks Report 2016, eleventh ed. http://wef.ch/risks2016
- Khanna Sanjay, and Nag, A. K., Rainwater Harvesting in Flouride Affected Area in Jamui, Bihar, International Journal of Trend in Scientific Research and Development (IJTSRD), August 2019; Volume 3 Issue 5.
- WHO, 2006. Fluoride in drinking water. IWA publishing, London, UK. 144 Pp.
- Podgorski Joel E., Pawan Labhasetwar, Saha Dipankar, and Berg Michael, Prediction Modeling and Mapping of Groundwater Fluoride Contamination throughout India. Environ. Sci. Technol, 2018; 52, 17, 9889–9898.
CrossRef - Bjørklund Geir, Semenova Yuliya, Pivina Lyudmila, Dadar Maryam, Rahman Md Mostafizur, Aaseth Jan, Chirumbolo Salvatore Uranium in drinking water: a public health threat. Arch Toxicol, 2020 May;94(5):1551-1560. doi: 10.1007/s00204-020-02676-8. Epub 2020 Feb 17.
CrossRef - Chahal Anju, Kumar Suneel, Panghal Amanjeet, Kumar Ajay, Singh Joga, Singh Parminder and Bajwa B. S., Study of Uranium in Drinking Water around the Sohna Fault Line in Haryana. Journal of the Geological Society of India; 16 October 2019; volume 94, pages 428-436.
CrossRef - Sahu M., Sar S. K., Dewangan, R. et al. Health risk evaluation of uranium in groundwater of Bemetara districy of Chhattisgarh state, India. Environ Development and Sustainability, 29 November 2019. https://doi.org/10.1007/s10668-019-00539-6.
CrossRef - Shrivastava B. K. Elevated uranium and toxic elements concentration in groundwater in Punjab state of India: extent of the problem and risk due to consumption of unsafe drinking water. Water Quality, Exposure and Health, 2015; 7, 407-421.
CrossRef - Nisha Sharma, Jaspal Singh, Human Kidney and skeleton uranium burden, radiation dose and health risks from high uranium contents in drinking water of Bhatinda district (Malwa region) of Punjab state, India, Radiation Protection Dosimetry, November 2017; Volume 176, Issue 3, Pages 242–251.
CrossRef - Sharma N. and Singh J., Radiological and chemical risk assessment due to high uranium contents observed in the ground water of Mansa District (Malwa region) of Punjab state, India: An area of high cancer incidence. Exposure and Health, 2016;8,(4), 513-525.
CrossRef - Nolan J., and Weber K. A., Natural uranium contamination in major US aquifers linked to nitrate. Environmental Science & Technology Letters, 2015; 2(8), pp215-220.
CrossRef - Sridhar Babu M.N., Somashekar R.K., Kumar S.A., Shivanna K., Krishnamurthy V., and Eappen K.P., Concentration of uranium levels in groundwater. Int J Environ Sci Tech, 2008; 5:263-6.
CrossRef - Nagaiah Ningaiah, Methews G., Kumar K., Rajanna A. M., Naregundi K. and co-workers, Influence of Physico-chemical parameters on the distribution of Uranium in ground water of Bangalore, India”, Radiation Protection and Environment, 2013; Vol. 36, Issue 4, pp175-180.
CrossRef - Singh A., Srivastav S.K., Kumar S., and Chakrapani G.J., A modified-DRASTIC model (DRASTICA) for assessment of groundwater vulnerability to pollution in an urbanized environment in Lucknow, India. Environ. Earth Sci. 2015, 74, 5475–5490. [Google Scholar] [CrossRef]
CrossRef - Saba N.U., Umar, R. and Khan A.. Evaluation of chemical and microbial quality of groundwater of Moradabad City, India. Arab J Geosci, 2015: 8, 3655–3672.
CrossRef - Aghazadeh N. and Mogaddam A. A., Assessment of Groundwater Quality and its Suitability for Drinking and Agricultural Uses in the Oshnavieh Area, Northwest of Iran. J. Environ. Protect, 2010; 1, 30-40.
CrossRef - Sridharan M., and Nathan D. Senthil, Groundwater quality assessment for domestic and agriculture purposes in Puducherry region, Applied Water Science, 2017: 7, 4037-4053.
CrossRef - Bărbulescu Alina, Yousefi Nazzal, and Howari Fares, Assessing the Groundwater Quality in the Liwa Area, the United Arab Emirates Water 2020, 12(10), 2816; https://doi.org/10.3390/w12102816.
CrossRef - Verma P., Singh P.K., Sinha R.R., and Tiwari A.K., Assessment of groundwater quality status by using water quality index (WQI) and geographic information system (GIS) approaches: A case study of the Bokaro district, India. Appl. Water Sci. 2020, 10, 27. [Google Scholar] [CrossRef]
CrossRef - Mohan R., Singh A.K., Tripathi J.K., and Chowdhary G.C., Hydrochemistry and quality assessment of ground water in Naini Industrial area, Allahabad District, Uttar Pradesh. J Geol Soc Ind, 2000; 55:77–89. https://www.mapsofindia.com/maps/bihar/tehsil/jamui.html
- Mines & Geology Department, Government of Bihar, District Survey Report of Jamui, 2018.
- Singh K. P., Kishore N., Tuli N., Loyal R. S., Kaur M., and Taak J. K., Uranium Contamination of Groundwater in Southwest Parts of Punjab State, India, with Special Reference to Role of Basement Granite in Clean and Sustainable Groundwater in India, Springer, Singapore, 2018; pp. 95-106.
CrossRef - NUP, BARC Standard Protocol for National Uranium Project, 2016.
- APHA (American Public Health Association), 22nd Edition, 2012.
- The Bureau of Indian Standard (BIS) DRINKING WATER- SPECIFICATION (Second Revision), IS 10500 : 2012.
- Atomic Energy Regulatory Board (AERB), Limit on uranium in drinking water, Atomic Energy Regulatory Board, 2004.
- World Health Organization (WHO), Guidelines for Drinking Water Quality, 4th Edition-2011.
- Sharma B.S., Emerging Challenge: Fluoride Contamination in Groundwater in Agra District, Uttar Pradesh, Asian Journal of Experimental Biology and Science, 2011; 2 (1), pp 19-28.
- Mondal D., Gupta S., Reddy D.V., and Nagabhushanam P., Geochemical controls on fluoride concentrations in groundwater from alluvial aquifers of the Birbhum district, West Bengal, India. Journal of Geochemical Exploration, Volume 145, October 2014; Pages 190-206.
CrossRef - Reddy A.G.S., Reddy D.V., Rao, P.N. et al. Hydrogeochemical characterization of fluoride rich groundwater of Wailpalli watershed, Nalgonda District, Andhra Pradesh, India. Environ Monit Assess, 2010;171, 561–577.
CrossRef - Ahda C. P. and Suthar S., Assessment of human health risk associated with high groundwater fluoride intake in southern districts of Punjab India. Exposure and Health, 2017; 11, 267-275.
CrossRef - Kumar Deepak, Singh Anshuman, Jha Rishi Kumar and Sahoo, Sunil kumar, Using spatial statistics to identify the uranium hotspot in groundwater in the mid-eastern Gangetic plain, India. Environmental Earth Science, 2018 Oct, 77(19). DOI: 10.1007/s12665-018-7889-1.
CrossRef - Singh S, Rani A, Mahajan R K, and Walia T P., Analysis of uranium and its correlation with some physico-chemical properties of drinking water samples from Amritsar, Punjab. J Environ Monit. 2003;5:917-21.
CrossRef - United State Environmental Protection Agency (US EPA), Edition of the Drinking Water Standards and Health Advisories, 2011.
- Wu, J.L., Ho, C.R., Huang, C.C., Srivastav, A.L., Tzeng, J.H. and Lin, Y.T., Hyperspectral sensing for turbid water quality monitoring in freshwater rivers: empirical relationship between reflectance and turbidity and total solids. Sensors (Basel),2014; 14(12), pp.22670-22688. doi: 10.3390/s141222670.
CrossRef - Srivastav, A.L., Dubey, V.K., Singh, P.K. and Sharma, Y.C., 2013. Safe ground water: I, contamination of ground water of Varanasi, Uttar Pradesh, India by nitrate, sulfates and alkalinity. JOURNAL OF THE INDIAN CHEMICAL SOCIETY, 2013; 90(7), pp.983-989.
- Khaimer Mahesh R., Dodamani Arun S., Jadhav Harish C., Naik Rahul G., and Deshmukh Manjiri A., Mitigation of Fluorosis - A Review. Journal of Clinical & Diagnostic Research. 2015 Jun; 9(6): ZE05–ZE09.
- Published online 2015 Jun 1. doi: 10.7860/JCDR/2015/13261.6085.
CrossRef - Brindha K. and Elango L. Fluoride in Groundwater: Causes, Implications and Mitigation Measures. In: Monroy, S.D. (Ed.), Fluoride Properties, Applications and Environmental Management, January 2011;111-136. https://www.novapublishers.com/catalog/product_info.php?products_id=15895.


