Hyper Spectral Remote Sensing for Mapping Species and Characteristics of Mangroves in Krishna Delta Region
Jemima Undrajavarapu1
*
and M. Chandra Sekhar2

http://dx.doi.org/10.12944/CWE.15.3.25
Copy the following to cite this article:
Undrajavarapu J, Sekhar M. C. Hyper Spectral Remote Sensing for Mapping Species and Characteristics of Mangroves in Krishna Delta Region. Curr World Environ 2020;15(3). DOI:http://dx.doi.org/10.12944/CWE.15.3.25
Copy the following to cite this URL:
Undrajavarapu J, Sekhar M. C. Hyper Spectral Remote Sensing for Mapping Species and Characteristics of Mangroves in Krishna Delta Region. Curr World Environ 2020;15(3). Available From: https://bit.ly/37kKPdz
Download article (pdf)
Citation Manager
Publish History

Introduction
The flora and fauna of mangroves are pretty dynamic in nature and constitute evergreen type of varied life forms. Mangroves of Krishna delta are dominated by partial submerged selerophytic species which are taxonomically unrelated and consists of a group of salt tolerant species that occur in intertidal estuarine region, sheltered coast line and creeks.
Mangroves from nesting grounds for turtles, helps in soil formation by trapping debris. The mangroves of Godavari delta are rich depository of organic soils which are washed down by Krishna river. An enormous fauna from appropriate ecosystem is providing shelter for fish, marine invertebrates, birds and molluscan species[3].
Mangroves of Krishna are grown in estuaries coastal mud flats and lagoons of coastal region. These halophytic vegetation are protecting the coastal land forms against the natural calamities such as Tsunamis, storms and ocean currents. Apart from the above the mangroves play a vital role in maintaining the water quality and function as natural filter and provide healthy habitat to aquatics forms of life[4].
The major mangrove wetlands of India are located along the east coast where as it predominantly distributed in Gujarat in the west coast. Along the east coast the tidal amplitude as well as the volume and periodicity of fresh water inflow decreases from Sunder bans in the north to Muthupet mangroves located in the southern most end. Correspondingly the species diversity and area of mangrove wetlands also decreases from north to south indicating the influence of freshwater inflow and tidal amplitude on the health and wealth of mangrove wetlands. The state of Andhra Pradesh has a geographical area of 2,76000sq.km out of which an area of 63,770sq.km is under forests, which accounts to 23% of the geographical area. Out of 63,770sq.km of forests only 582 sq.km are under the mangrove forests, which accounts 0.9% of the total forest area of the state. Andhra Pradesh has the geographical advantage of having most of the east flowing rivers in the heart of the state bringing in copious supplies of sediments from the Western and Eastern Ghats and Deccan Plateau up to the coast. The major, medium and minor rivers, which flow through the state, are about 40.Out of these, the most important rivers are (1)The Godavari (2)The Krishna (3) The Pennar and (4)The Vamsadhara. The majority of the mangroves are present in the estuaries of these rivers. The Godavari mangroves are located in the Godavari estuary in the East Godavari district. Krishna mangroves are located in the Krishna estuary of Krishna and Guntur districts. Apart from these estuaries, mangroves are also found in small patches in the coasts of Visakhapatnam, West Godavari, Guntur and Prakasam districts.
The Krishna mangroves are between 15º 42ʹ- 15º 55ʹ N and 80º 42ʹ - 81º01ʹ E spread across Krishna and Guntur districts. In the present floristic enumeration 35 species have been recorded belonging to 27 genera of 20 families occurring in Godavari and Krishna mangrove areas.
Despite of having an extensive mangrove habitat in Andhra Pradesh region they are prone to decline day to day in last few decades as a result of climate change. The depletion of mangroves in proposed study area is identified to be encroachment by agricultural activity, aquaculture and soil erosion.
A Significant Research has been made towards exploring the mangroves using multispectral data fails in developing or understanding the perturbations and ecological process along with spatiotemporal distribution of vegetative communities at species level. wherein the hyper spectral remote sensing has high potential in demonstrating the species level composition along with physicochemical status of the vegetation.
Hyperion data E0-1-ALI data acquired on 05-Dec2000 is used for imaging spectroscopy. A spectral library has been created for mapping of plant species so as to generate standard harmonized protocol in hyper spectral data classification. As per the protocol in generation of species level classification standard procedures have been followed in estimating interspecies and intra species variability. Lankivanidibba a mangrove reserve forest is demonstrated as case study in the paper[6] using Envi software.
Study Area
The mangroves of coastal plains of Krishna delta include seven reserve forests covering up to a total area of 19,481 ha..From these seven reserve forest Lankivanidibba reserve forest is unique with a variety of species and covers a vast area of 5382 ha. of which 1974 ha. is covered with dense mangroves. The mangroves of Lankivanidibba have a sparse mangroves in land region and becomes thicker as we move forward seawards, due to remote access to the dense mangroves it is very difficult in classifying species of the mangroves, hence an attempt is made for classifying using hyper spectral imagery[5]. Figure1 show the key map of the study area.
The vegetation is fairly thick. Species such as Avicennia marina, A.officinalis, Xylocarpus granatum, Excoecaria agallocha, Ceriops decandra, Rhizophora apiculata and Bruguiera cylindrical have been recorded. Large degraded areas are found in this RF. Anthrapological pressure is noticed from villages nearby such as Molagunta, Kottapalem, Patur, Nakshatranagar and Lankivanidibba. The soil in this RF is clayey. Prosopis invasion is high in some areas.
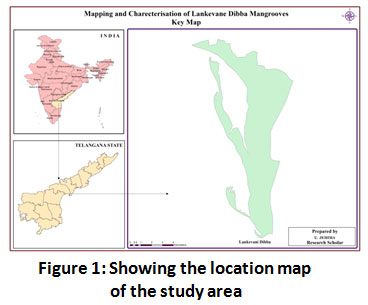 |
Figure 1: Showing the location map of the study area Click here to view figure |
Methodology
Field data collection of spectral signatures using Hand held spectrometer in the study area comprising of 751 ha..The signature of same plant species are acquired at different space locations in order to avoid confusion and checking similarity between species. The plant species whose spectral signatures are collected and listed in Table-1.
Preprocessing
The Satellite data which was acquired from VSGS has undergone georectification using GIS with toposheet as base layer. Ensuring the geometrically corrected data is subjected to radiometric calibration tool were the output interleave is band sequential and reflectance is noted as calibration type with 100scale factor. The resultant calibrated Hyperion data is undergone quick atmospheric correction for removal of any atmospheric errors. The resulted map is saved as Lankevanidibba_atm as shown in Figure2.
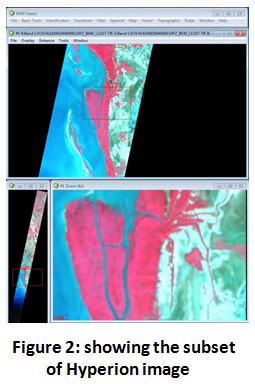 |
Figure 2: showing the subset of Hyperion image Click here to view figure |
Classification of End Member Selection
Data dimensionality reduction is undergone where the number of bands which have narrow band widths can be considered with no data are removed along with the data that have noise factors. This facilitates the continuous electromagnetic spectrum. Principal component analysis technique is the statistical procedure followed in reducing bands. Eigen values with greater ranges in the input bands are hypotenuse at right angles of the triangles and are separated using resampling method. Figure 3 shows the Eigen values.
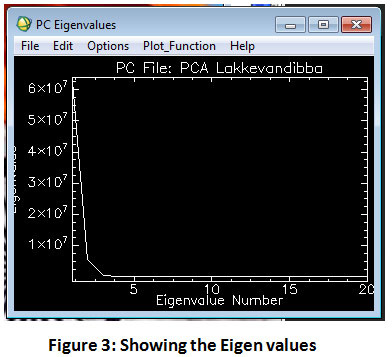 |
Figure 3: Showing the Eigen Values |
Using the spectral surface cover of the image spectral signatures are assigned by the values that are created from the field spectro radiometry n-dimensional scattering plots are plotted by continually projecting the extreme pixels and are recorded. Minimum noise fraction technique is applied as data sets having different noise levels are separated filtered. This technique is recommended as it makes difficulty in selecting cutoff point before applying standard principal component transformation. Pixel purity Index image Figure 4 is created based on the digital number where end member spectra are transcripted as spectral signatures. The subset of these end members are used for classifying in to different classes of the image.
 |
Figure 4: shows extraction of different classes Click here to view figure |
For training the algorithm we have chosen representation pixels. The MNF band compositions and data from the field testing plots are used for 260 training pixels.
Results and Discussion
After undergoing atmospheric correction by removal of bad bands and bad columns in the Hyperion data, spatial subset and spectral subset has been done to extract the study area. Spectral angular mapper tool is being used in collection of end member classes. For increasing the accuracy the end member classes are drawn from the population of the data points, this increases the limit and composition of the image pixels. This assist in the homogeneous pixels which are dominating in the study area are identified using the pixel purity index(PPI), which served as solution for end member extraction and delineating the classes. Figure 4 shows the spectral signatures of different species. In order to ensure appropriate end member classes, the spectral signatures are collected and the spectrophotometer are used as the validation.
Table 1: Showing percentage of different classes
|
Class |
Percentage |
|
Vegetation |
24.77% |
|
Avincenna marina |
10.83% |
|
Ceriops |
6.33% |
|
Rhizopora |
3.89% |
|
Excoecaria |
1.16% |
|
River |
4.92% |
|
Sand zone |
3.48% |
|
Avencenna offentialis |
2.97% |
|
Ocean |
41.66% |
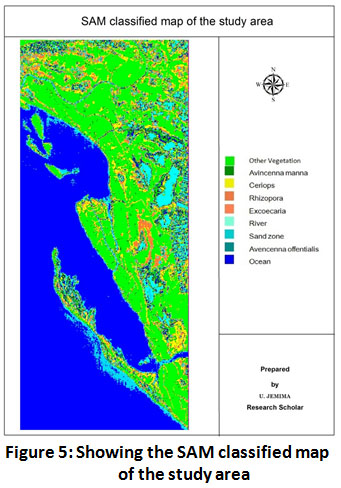 |
Figure 5: Showing the SAM classified map of the study area Click here to view figure |
High degree of classification has been done and various classes of species are mapped as resultant of SAM classifier. The Figure 5 demonstrates the combined classification output. The classification concludes that 10.83% of the mangrove area are dominated by Avicenna marina, the results are with regard to the Hyperspectral subset image. Such mangrove forest which are dominated by these species as described by Duke[8] exhibit remarkable adaptation to tidal inundation level, salinity, variability and temperature conditions as a very less percentage of Ceriops depends are found which are closely found with Avicennia species. The species that are identified classes using SAM classifier are shown in the table.
Acknowledgment
The author would like to express heartfelt thankfulness to my Guide Dr. M. Chandra Sekhar, Professor (retired), JNTU Hyderabad and gratefulness to Dr. M. Anji Reddy garu Prof environmental science for his kind support and enlightening towards the knowledge on Hyperspectral Remote sensing.
Conflict of Interest
The authors do not have any conflict of interest.
Funding Sources
The author(s) received no financial support for the research, authorship, and/or publication of this article.
References
- Roshanak Darvishzadeh(2008) Hyperspectral remote sensing of vegetaation parameters using statistical and physical models.
- R. Ramasubramanian (2006) Mangroves of Godavari – Analysis Through Remote Sensing Approach.
CrossRef - Dr Sridhar Vadlapudi (2009) Identification and quantification of changes in mangrove forest using Remote Sensing – A case study near Kakinada Bay, Andhra Pradesh, India.
- GIS and Remote Sensing for Mangroves Mapping and Monitoring(2019) by Hamdan Omar.
- Atlas of Mangrove wetlands of India from M. S. Swaminathan research foundation.
- Towards standard plant species spectral library protocol for vegetation mapping(2015) by Marcos Jim.
- A textbook by Odum, E.P. (1971) Fundamental of Ecology.
- Duke, N. et al. (2007). A world without mangroves.
CrossRef


