Lockdown Due to COVID-19 Pandemic Improves Overall Air Quality: An Evidence Based Study from Siliguri Metropolitan, West Bengal, India
Subham Roy1
*
 , Nimai Singha2
, Nishikanta Majumdar1
and Barsha Roy1
, Nimai Singha2
, Nishikanta Majumdar1
and Barsha Roy1
http://dx.doi.org/10.12944/CWE.15.3.20
Copy the following to cite this article:
Roy S, Singha N, Majumdar N, Roy B. Lockdown Due to COVID-19 Pandemic Improves Overall Air Quality: An Evidence Based Study from Siliguri Metropolitan, West Bengal, India. Curr World Environ 2020;15(3). DOI:http://dx.doi.org/10.12944/CWE.15.3.20
Copy the following to cite this URL:
Roy S, Singha N, Majumdar N, Roy B. Lockdown Due to COVID-19 Pandemic Improves Overall Air Quality: An Evidence Based Study from Siliguri Metropolitan, West Bengal, India. Curr World Environ 2020;15(3). Available From : https://bit.ly/3mkfXzh
Download article (pdf)
Citation Manager
Publish History

Introduction
World health organization declared an outbreak of pandemic due to SARS-COV-2 virus on 11th March 2020 and named the contagious diseases as COVID-19 due to thirteen-fold increases in the number of cases in China, with 114 countries affected and 4291 deaths1. "2019 Novel Coronavirus" or COVID-19 is not a new virus that causing the pandemic situation, earlier the same group of Corona viruses (CoV) known as Severe Acute Respiratory Syndrome (SARS) in 2003 and the Middle East Respiratory Syndrome coronavirus (MERS-CoV) in 2012 have already done a same chaotic situation2, 3. Since the first spread of COVID-19 at Wuhan, China, in December 2019, consequences in the report of total cases above one million within the first four months4. On 30th January 2020, India reported its first active case of COVID-19 patient with travel history from Wuhan5; since then, the number of cases was continued to spike in the country. As of 11th March, the advisory was released by the Indian government regarding visas restriction on travel history from China, Italy, Iran, Republic of Korea, France, Spain and Germany6. Due to continuing mounting in the number of cases, India finally initiates its first lockdown on 24th March 2020 and the lockdown will be effective from 25th March 20207. Since then, mass transportation activities, industrial and construction work, restaurants and malls, schools and colleges, gyms were suspended, which caused an enormous impact on the overall air quality.
Few recent studies proved that improvement in overall air quality due to the lockdown. For example, Nakada and Urban (2020) analyze the air quality of São Paul, Brazil due to partial lockdown by using the Copernicus Atmospheric Monitoring Service and found that drastic decline in the concentration of NO, NO2 and CO up to 77.3%, 54.3% and 64.8%, respectively, compared to mean of five years. The author also found a 30% overall increase in O3 during the lockdown period due to decreased nitrogen monoxide8. Also, Otmani et at., (2020) conducted their findings regarding changes in air quality (mainly PM10, NO2 and SO2) in Salé City, Morocco and found that significant reduction of all three pollutants by 75%, 49% and 96% respectively, compared to before lockdown9. On the other hand, Lian et al. (2020) initiate their findings in Wuhan city of China, where they discover lower air quality by 33.9% than before lockdown and 47.5% reduction compared to 2015-19. The authors also find that the reduction of NO2 (53.3%) was more compared to PM2.5 (36.9%)10. Sharma et al. (2020) conducted their in-depth research on restricted emission during the 22 Indian cities' lockdown period. They found PM2.5 had shown maximum reduction followed by PM10, CO and NO2. Also, they found a correlation between northern and eastern regions of India was improved than before4. Mahato et al. (2020), in their study over Delhi, India, found about 40 to 52% reduction in the concentration of PM2.5, PM10, NO2, SO2, CO and NH3 compared to pre-lockdown periods11. Kumar et al. (2020) also investigate that due to cut-off in anthropogenic emission due to lockdown from five major Indian cities, i.e., Chennai, Delhi, Hyderabad, Kolkata, and Mumbai resulted in a temporary diminution of fine particles12. Further, the lockdown had allowed us to adopt some new strategies like the need to update particulate standards, need to include new pollutants, e.g., Cl2/HCl (Hydrogen chloride and Chlorine) for measurement and also to define separate standards for North India due to different geographical proximity in order to achieve better air quality13.
Thus based on the above discussion and literature, our study is based on the Siliguri city of West Bengal, India. The importance of the lockdown to refurbish the air quality is not yet understood clearly. Through our quantitative analysis, we further try to fill the gap to better understand the actual scenario of changes in air quality by segregating the lockdown in different phases and knowing about the situation of air quality during post-lockdown period. Hence the investigation of this study attempts to understand the benefits of lockdown as an alternative approach to restrain the air quality of Siliguri. The objective of this paper is (i) to find out the tendency of concentration of pollutants at the period of before, during and after lockdown, (ii) to further assess the nature of changes in the air quality at different phases of lockdown, (iii) to compare changes in concentration of various pollutants for the period of before and during the lockdown, and for before and after lockdown, (iv) also to reveal the changes in AQI for same period. This study is very much feasible for the scientific community and the policymakers to better understand the nature of changes in the air quality at different phases of lockdown and to consider lockdown as alternative measures for restoring the air quality of Siliguri for forthcoming years.
The Study Area
Siliguri is one of the swiftly growing metropolises with a well-built base of trade commerce, located at the state of West Bengal, India (Fig. 1). Siliguri is also called the gateway of North-east India and thus, it acts as a break of the bulk point due to which it is always been an active center of merchandize activity for the entire North-east corridor. Siliguri's total area is 41.9 sq.km distributed over 47 wards, with more than five lakh population. Being an unplanned city, the enormous population growth over the last few decades makes the city congested, with a massive load over traffic and transport systems14. Thus the motto behind the selection of the study area was its strategic location, which makes Siliguri a hub of attraction in terms of employment, tourism activity, the nucleus of trade and business. All the factors lead to massive air pollution and poor ambient air quality of the city.
A very recent study reveals that PM10 and PM2.5 are the primary threats for the city due to the high motorization of vehicles and massive construction works13. Besides, NO2 also acts as secondary pollutants for the city and it is near the violation limit set by National ambient air quality standard (NAAQS)15. Thus, we try to reveal the changes in air quality through our present study due to the implementation of lockdown.
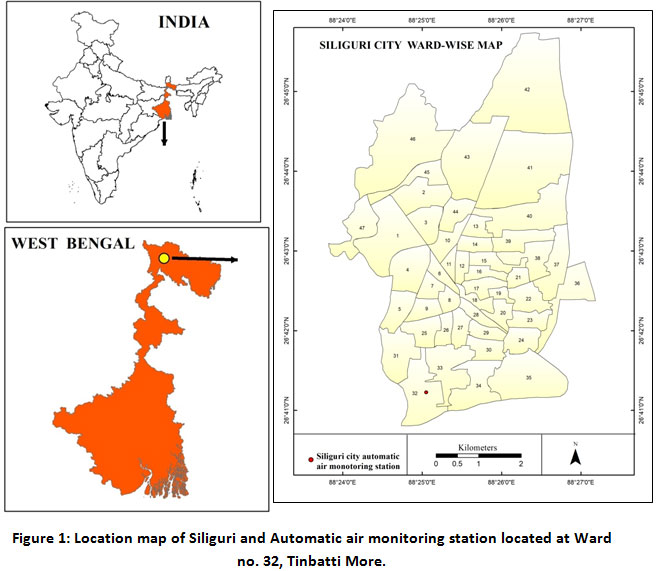 |
Figure 1: Location map of Siliguri and Automatic air monitoring station located at Ward no. 32, Tinbatti More. Click here to view figure |
Data and Methodology
In order to assess the changes in air quality status of Siliguri city due to lockdown, daily (24 hrs), automatic data from 1st January to 30th June 2020 was collected from air quality monitoring stations located at Siliguri, Tinbatti more, Ward no.32 (Fig. 1) The whole study is based on secondary data collected from an online portal of Central pollution control board (CPCB) (https://app.cpcbccr.com/ccr/#/caaqm-dashboard-all/caaqm-landing/data) and the data of a daily average AQI for six months was obtained separately from, CPCB bulletin (https://cpcb.nic.in/aqi-bulletin-3/) and West Bengal pollution control board (WBPCB) (http://emis.wbpcb.gov.in/airquality/aqiBulletin.jsp). The air quality data provided by CPCB is very standardized and authenticate as they follow a set of rules and protocols for sampling, assessment and evaluation of data11. We select a daily concentration of six pollutants for our assessment, PM2.5, PM10, NO2, SO2, O3 and NH3; also, the concentration of daily AQI obtained for the same period. We split the data in terms of before lockdown period (from 1st January to 24th March), during lockdown (25th March to 31st May) and after lockdown or Unlock 1 (from 1st June to 30th June) in order to assess the actual scenario of changes in air quality. For better understanding the real situation of air quality of the city during the lockdown period, we further segregate the data into four phases (Table 1.) These four phases of lockdown were imposed by the Government of India due to worsening the Covid-19 pandemic situation.
Table 1: Different phases of lockdown due to Covid-19 pandemic in India.
|
Lockdown phases in India |
Dates |
Source |
|
Lockdown phase 1 |
25th March to 14th April, 2020. |
www.nytimes.com/2020/03/24/world/asia/india-coronavirus-lockdown.html |
|
Lockdown phase 2 |
15th April to 3rd May, 2020. |
www.livemint.com/news/india/pm-modi-announces-extension-of-lockdown-till-3-may-11586839412073.html |
|
Lockdown phase 3 |
4th May to 17th May,2020 |
https://economictimes.indiatimes.com/news/politics-and-nation/govt-extends-lockdown-by-two-weeks-permits-considerable-relaxations-in-green-and-orange-zones/articleshow/75491935.cms |
|
Lockdown phase 4 |
18th May to 31st May, 2020. |
www.livemint.com/news/india/covid-19-lockdown-4-0-coronavirus-lockdown-extended-till-31-may-says-ndma-11589715203633.html |
|
Unlock 1 |
1st June to 30th June, 2020. |
https://indianexpress.com/article/india/lockdown-5-0-guidelines-6434777/ |
Data Analysis
To analysis the changes in air quality at different stage of lockdown, the average concentration of the pollutants, including AQI, was calculated for each phases. Further, the mean concentration of each pollutant was calculated for the period of before, during and after lockdown to compare the variation among before and during the lockdown, also for before and after lockdown (Table 2). Moreover, Trend analysis was carried out by computing the values of daily concentration of each pollutant for six months (January-June, 2020), which depicts the changing nature of air quality of the city due to lockdown. Finally, the daily values of AQI were analyzed to comprehend the changes in the air quality status of Siliguri during the lockdown period.
Table 2: Average concentration of various pollutants Particulate matter (PM2.5 and PM10), Nitrogen dioxide (NO2), Sulphur dioxide (SO2), Ammonia (NH3), Ozone (O3) and Air quality Index (AQI) during the period of before, during (includes four phases) and after lockdown in Siliguri city. Also consist of variation and changes (%) of air pollutants estimated among pre-during lockdown periods and pre-post lockdown of 2020.
|
Pollutants |
Pre-lockdown (Average from 1st January to March 24, 2020) |
During Lockdown |
Lockdown average (25th March to 31st May) |
Post lockdown |
Variations and Change in % |
||||||
|
Pre-During lockdown |
Pre-Post lockdown |
||||||||||
|
Phase 1 (25th March to 14th April) |
Phase 2 (15th May April to 3rd May) |
Phase 3 (4th May to 17th May) |
Phase 4 (18th May to 31st May) |
Unlock 1 (1st June to 30th June) |
Net |
% |
Net |
% |
|||
|
PM2.5 |
100 |
67 |
24 |
25 |
20 |
34 |
22 |
-66 |
-66.0 |
-78 |
-78.0 |
|
PM10 |
163 |
105 |
38 |
42 |
36 |
55 |
39 |
-108 |
-66.25 |
-124 |
-76.07 |
|
NO2 |
48 |
34 |
23 |
24 |
23 |
26 |
25 |
-22 |
-45.83 |
-23 |
-47.91 |
|
SO2 |
5 |
6 |
4 |
4 |
3 |
4 |
3 |
-1 |
-20.0 |
-2 |
-40.0 |
|
NH3 |
32 |
35 |
26 |
21 |
20 |
26 |
19 |
-6 |
-18.75 |
-13 |
-40.63 |
|
O3 |
24 |
35 |
24 |
36 |
21 |
29 |
18 |
+5 |
20.83 |
+6 |
25.0 |
|
AQI |
208 |
137 |
44 |
47 |
39 |
68 |
42 |
-141 |
-67.78 |
-166 |
-79.80 |
Result and Discussion
Changes in Concentration of Various Pollutants in Period of Before, During and After Lockdown.
Concentration of Pollutants Before Lockdown (1st January to 24th March, 2020)
According to the (Table 2) and (Figs. 2c and d), the mean concentration of PM2.5 and PM10 was very high and it infringed the limit of National ambient air quality standard (NAAQS) (Table 3). The primary sources of these two pollutants in the city is mainly due to high congestion in road traffic from diesel-run city autos and construction works of roads and multistorey buildings15. However, except PM10 and PM2.5, the mean concentration of other pollutants, namely SO2, O3 and NH3 is within the permissible limit (Figs. 2b, e and f). Besides, the diurnal tendency of NO2 shows near to the violation limit of NAAQS before the lockdown period (Fig. 2a), yet its mean average before lockdown is under acceptable limit. So it is clear that PM10 and PM2.5 followed by NO2 are the primary threat for the Siliguri city before the lockdown period.
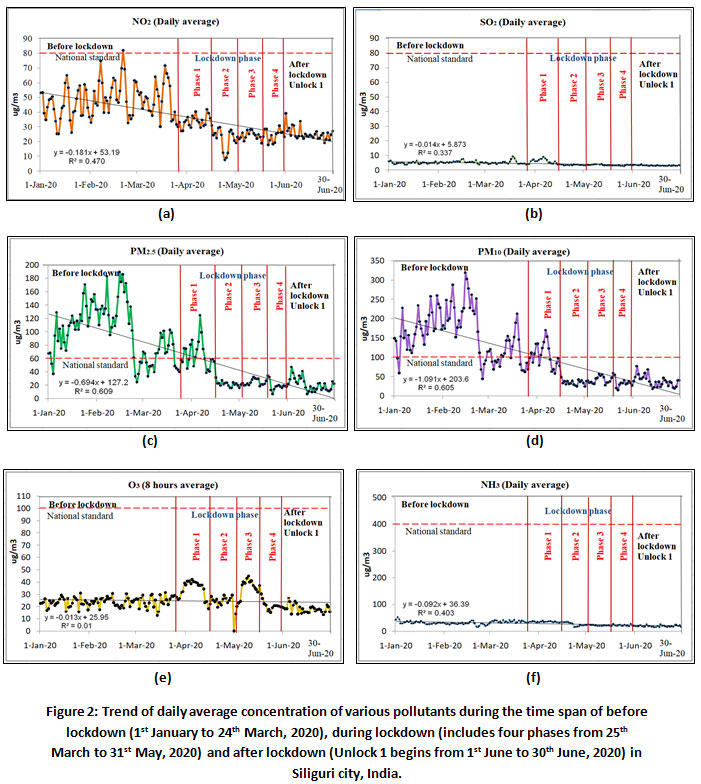 |
Figure 2: Trend of daily average concentration of various pollutants during the time span of before lockdown (1st January to 24th March, 2020), during lockdown (includes four phases from 25th March to 31st May, 2020) and after lockdown (Unlock 1 begins from 1st June to 30th June, 2020) in Siliguri city, India. Click here to view figure |
Concentration of Pollutants During the Overall Period of Lockdown (25th March to 31st May)
Since the lockdown commences due to the pandemic situation from the period of 25th March to 31st May, the Siliguri city witnessed a drastic change in the attenuation of the pollutants (Table 2). The mean concentration of PM10 and PM2.5 followed by NO2, which are a major threat for the city, show momentous declining trends during the overall lockdown period (Figs. 2d, c and a). The primary sources of SO2 emission are mainly from power plants and large industries, mainly due to the burning of fossil fuel16. Due to the lack of large power plants and industries in the city, the concentration of SO2 always remains low for the Siliguri. However, during the lockdown period, the mean concentration of SO2 is further reduced (Fig. 2b). Similarly, in the case of NH3, the primary source of emission is from agricultural activity and animal husbandry17. Thus for Siliguri, the concentration of NH3 is much below the permissible limit (Fig. 2f). Moreover, further reduction of NH3 in Siliguri is mainly due to the restriction of diesel and petrol run vehicles during the lockdown period, as diesel and petrol engines are the major contributors of urban NH318, 19. On the other hand, the concentration of O3 was slightly increased during the lockdown period (Fig. 2e) mainly due to the significant decline in concentration NOX which consequence in lower O3 titration by NO11, 20.
Tendency of Pollutants During Lockdown Phase 1 (25th March to 14th April)
With the beginning of the first phase of lockdown for 21 days, the concentration of PM2.5 and PM10 started to fall drastically (Figs. 2c and d). Similarly, NO2 was also showing a tendency to further dwindle in its concentration (Fig. 2b). On the other hand, the Mean concentration of SO2 and NH3, showing a negligible amount of increase compared to the pre-lockdown phase (Table 2). During the first phase of the lockdown, the concentration of O3 was started to increase as the reason stated above. However, during the month from April to August, the tendency of concentration of O3 in India is usually high due to insolation11,21. Generally, the effect of lockdown results in the massive impact over the mean concentration of all pollutants. As the mean average of PM10, PM2.5 and NO2 significantly reduced at the first phase of lockdown (Fig. 3a and Table 2) compared to pre-lockdown conditions. In contrast, the average concentration of SO2, NH3 and O3 was increased than before (Fig. 3a and Table 2).
Tendency of Pollutants During Lockdown Phase 2 (15th April to 3rd May)
The second phase of lockdown in India, as well as in Siliguri continues for 19 days, which begins from 15th April to 3rd May, which results in a further reduction in the concentration of pollutants (Figs. 2a, b, c, d and e). One interesting fact for the second phase revealed that the mean concentration of all the pollutants reduced (Fig. 3b and Table 2), unlike the first phase. Also, the mean average of the second phase was much lower compared to the pre-lockdown period and all the pollutants are under the permissible limit set by NAAQS.
Tendency of Pollutants During Lockdown Phase 3 (4th May to 17th May)
The restriction further escalates due to worsening conditions of the pandemic in the country and the lockdown enters in the third phase, continues for 14 days. Interestingly, during the third phase, the mean concentration of PM10, PM2.5, NO2 and O3 was slightly increased compared to the second phase (Figs. 2d, c, a, e and Table 2) but still under the tolerable limit. However, augmentation of pollutants in the city during the third phase might be due to some relaxation over lockdown. During the third phase, reducing restrictions over transportation activities like intra-city public bus movement, cabs and four-wheeler vehicles with limited passenger, starting of construction works with some limitations22 might be the reason for a minor increase in the pollutants in Siliguri. In contrast, the mean concentration of NH3 and SO2 shows negligible changes (Table 2). However, compared to the pre-lockdown phase, the average concentration of pollutants during the third phase shows a considerable reduction (Fig. 3c and Table 2).
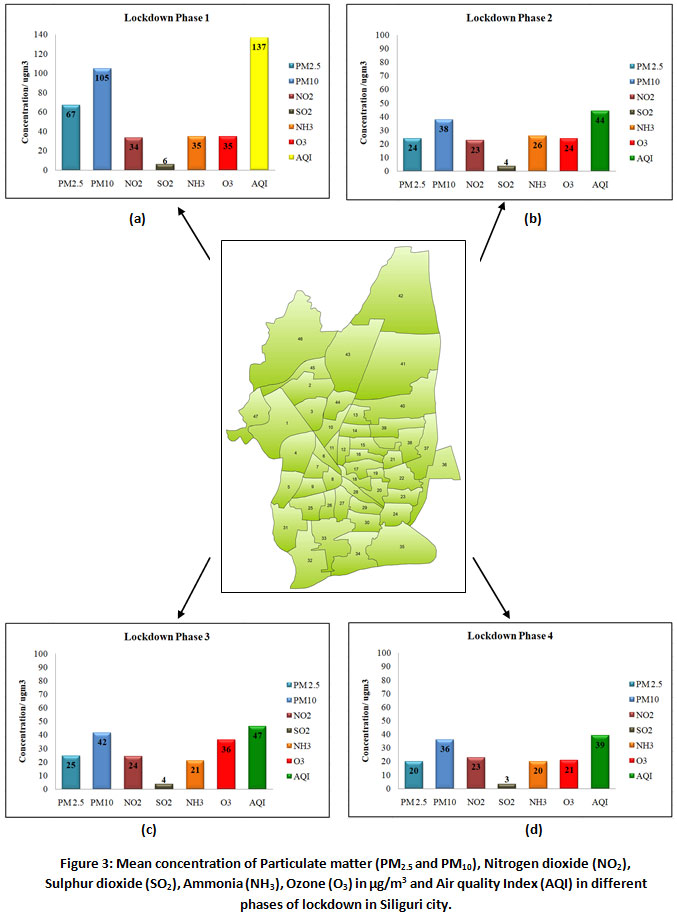 |
Figure 3: Mean concentration of Particulate matter (PM2.5 and PM10), Nitrogen dioxide (NO2), Sulphur dioxide (SO2), Ammonia (NH3), Ozone (O3) in μg/m3 and Air quality Index (AQI) in different phases of lockdown in Siliguri city. Click here to view figure |
Tendency of Pollutants During Lockdown Phase 4 (18th May to 31th May)
The last countrywide lockdown commences for 14 days show declining trends in the mean concentration of all pollutants in Siliguri (Figs. 2a, b, c, d and e). Compared to all the lockdown phases for the city, the fourth phase shows the lowest concentration means of all the pollutants (Fig. 3d and Table 2). Thus it is clear from the discussion that the restriction due to the lockdown over industries, transportations activities, malls and restaurants, construction works and many other activities for about two and half months resulted in a drastic enhancement in the overall air quality Siliguri City. Especially the concentration of PM10, PM2.5 and NO2, which are the city's primary threat, has been considerably improved.
Concentration of Pollutants After the Lockdown: Unlock 1 (1st June to 30st June)
The unlocking procedure started from 1st June and continues to the end of the month with specific constraints and limitations over the movement of people and goods23. With the beginning of citywide unlocking, the tendency of PM10, PM2.5 and NO2 shows a minimal increase within its first week (Figs. 2d, c and a). It reveals that disengaging the lockdown results in unrestricted of many activities and the city progressively returns to its regularity within the first week of June24. However, surprisingly the mean concentration of the pollutants during post-lockdown shows further decrease compared to the before and after the lockdown period (Table 2). Hence, one fact is undeniable that despite citywide unlocking, the situation of air quality of Siliguri was now at more stable and improved condition, as all the means of pollutants are within permissible limit compared to pre-lockdown.
Comparison Among Changes and Variations in Concentration of Pollutants
Comparison of Changes in Air Pollutants Between Before and During Lockdown Phases.
The comparison among the changes in concentration of pollutants reveals (Table 2) that PM10 (from 163 to 55 μg/m3) and PM2.5 (from 100 to 34 μg/m3) shows a remarkable decrease, which corresponds to the variation of -66% for both. In the case of NO2 concentration, it shows a significant decrease of 22 μg/m3 (from 48 to 26 μg/m3), similar to a change of about -46%. For SO2 and NH3 also shows the variation of -20% and 18%, respectively. Thus it is clear that restriction due to lockdown in the city results in a dramatic decrease in all the pollutants, especially PM10 and PM2.5. In contrast, O3 shows an increase in variation of 5μg/m3, which results in an increase in concentration by almost 21%.
Comparison of Changes in Air Pollutants Between Before and After Lockdown Phases
Interestingly Table 2, reveals that compared to pre and during the lockdown, the post lockdown phase shows significantly more improvement for all the pollutants except O3. The concentration of PM2.5 and PM10 was drastically improved by -78% (from 100 to 22 μg/m3) and -76% (from 163 to 39 μg/m3), respectively. For NO2, SO2 and NH3 the variation in concentration was -48%, -40% and -41%, respectively. However, O3 shows a further increase in its concentration from 21% to 25% during the post lockdown period. Thus, it reveals that due to the citywide blockade, the overall concentration of all the pollutants was more stable after the lockdown phase, as all the pollutants are below NAAQS limit (Table 3).
Table 3: National Ambient Air Quality Standard (NAAQS) by CPCB Showing Concentration of Pollutants
|
Pollutants |
Time average |
Concentration in Ambient Air |
|
|
Industrial, Residential and other area |
Ecological sensitive area (notified by GoI) |
||
|
PM 2.5(μg/m3) |
24 hrs |
60 |
60 |
|
PM10 (μg/m3) |
24 hrs |
100 |
100 |
|
NO2 (μg/m3) |
24 hrs |
80 |
80 |
|
SO2 (μg/m3) |
24 hrs |
80 |
80 |
|
NH3 (μg/m3) |
24 hrs |
400 |
400 |
|
O3 (μg/m3) |
8 hrs |
100 |
100 |
Source: CPCB,2009 (https://app.cpcbccr.com/ccr_docs/Air_quality_standards.pdf)
Improved AQI of Siliguri City Due to Lockdown
Status of Air Quality Before and During Lockdown Periods
The pattern of changes in the AQI of Siliguri was analyzed before (1st January to 24th March) and during (25th March to 31st May) lockdown periods (Fig. 4c). It reveals that before the lockdown period, the average AQI of the city was 208, which is an unsatisfactory condition (Fig. 4c and Table 2). The monthly mean of AQI before the lockdown (Fig. 4a) also depicts that the air quality status of Siliguri city ranges between poor to moderate polluted. On the other hand, weekly averages reveal that the air quality of January ranges between the poor to moderately pollute. Even during some daily average of January month, the air quality spikes to deplorable conditions (Figs. 4b and c). During February, the mean AQI was more than January (Fig. 4a), while weekly and daily AQI averages reveal fluctuation of air quality between poor to very poor conditions in February (Figs. 4b and c). In March, the air quality of Siliguri ranges between moderate polluted to satisfactory limit (Fig. 4b and c) and its monthly mean depicts moderately pollute condition (Fig. 4a).
 |
Figure 4: Status of Air quality index (AQI) on daily average basis during the period of before, during and after lockdown in Siliguri city. Also includes monthly and weekly average of AQI. |
As the lockdown begins from the end of March, the improvement of the air quality was visible (Fig. 4c). The mean AQI was at a satisfactory limit during lockdown (Table 2 and Fig. 4c). Simultaneously, the weekly averages of April to May (during lockdown periods) show that the air quality improved and ranges between satisfactory to good limit (Figs. 4b and c). Within the first four weeks of the beginning of the lockdown, the AQI drastically changed from moderately polluting to the satisfactory limit, further, in the fifth week of lockdown (end of April), AQI became suitable for Siliguri (Figs. 4b and c). While the monthly mean AQI of April is satisfactory and for May, it further enhanced to good AQI (Fig. 4a). Table 2 depicts that the city's air quality was changed from 208 to 68 AQI, which is almost -68% improvements in the overall AQI of the city.
Status of Air Quality After Lockdown Periods
Table 2 and Fig. 4c reveals that unlocking does not impact its Air quality of the city because, despite the unlocking, it shows a stable condition of AQI with a mean average of 42, which is considered a good air quality status. The variation of changes in AQI from before to after lockdown shows a remarkable decrease of 166 AQI (from 208 to 42 AQI), which corresponds to the variation of about -80% (Table 2). It is important to mention that Siliguri's air quality has a regular tendency to become stable and within a safe limit from June to September due to the monsoonal effects over north India15. Hence, due to the amalgamation of two factors, i.e., the impact of lockdown and monsoonal effects, the air quality of Siliguri became more stable after the lockdown period (Figs. 4a, b and c).
Conclusion
The present study reveals that the implementation of lockdown due to COVID-19 pandemic consequence in drastic changes in the Siliguri city's overall air quality from 1st January to 30th June 2020. A significant reduction in 66% concentration was noticed for PM2.5 and PM10, respectively, in the period before and during the lockdown. Also, the concentration of NO2, SO2 and NH3 was declined between 19% and 46% for the same period. The situation was more stable after the lockdown ended, as all the pollutants show very minimal concentration in the city. The study shows that PM2.5 shows a maximum reduction of about 78% during the post-lockdown, followed by PM10, about 76% compared to pre-lockdown. Besides, NO2, SO2 and NH3, also tend to decline drastically between 40% and 48% for the same period. In terms of AQI of the city, the value was poor before the lockdown, which reduced to the average during the lockdown period, and it was further improved to good air quality during post-lockdown.
The lockdown has brought a critical economic setback across the world, but a short-term environmental renovation is undeniable at the same time. Hence the beneficial effect of lockdown in curbing excessive pollution must be recognized by the policymakers and stakeholders in the future and short-term lockdown must be embraced as an alternative approach. However, before implementing such short-term lockdown, rational, cost-effective preparation is a must either it would be an economic disadvantage.
Limitation of study
- Factors like meteorological conditions, local topography, and air movements that influence pollutants concentration are not considered in the study.
- Some data regarding AQI at the initial phase of lockdown was not available due total lockup in the city.
Acknowledgements
The author would like to express their sincere gratitude to the Central pollution control board (CPCB) and West Bengal Pollution control board (WBPCB) for detailed data without which it is not possible to find such novel results. The author would also like to thank two anonymous reviewers for their insightful comments, which immensely helped in the upgrading of the earlier version of the manuscript.
References
- WHO, 2020. Retrieved from: https://www.who.int/dg/speeches/detail/who-director-general-s-opening-remarks-at-the-media-briefing-on-covid-19---11-march-2020. Accessed date: 09th October, 2020.
- Ramadan N., Shaib H., 2019. Middle East respiratory syndrome coronavirus (MERS-CoV): A review. GERMS. 9(1), 35-42. doi: 10.18683/germs.2019.1155.
CrossRef - Zhong N.S., Zheng B.J., Li Y.M., Poon L.L.M., Xie Z.H., Chan K.H., Li P.H., Tan S.Y., Chang Q., Xie J.P., Liu X.Q., Xu J., Li D.X., Yuen K.Y., Peiris J.S.M., Guan Y., 2003. Epidemiology and cause of severe acute respiratory syndrome (SARS) in Guangdong, People's Republic of China, in February, 2003. Lancet 362, 1353–1358. https://doi.org/10.1016/S0140-6736(03)14630-2.
CrossRef - Sharma S., Zhang M., Gao J., Anshika., Zhang H., Kota S.H., 2020. Effect of restricted emissions during COVID-19 on air quality in India. Sci. Total Environ. https://doi.org/10.1016/j.scitotenv.2020.138878.
CrossRef - India Today, 2020. Kerala reports first confirmed corona virus case in India. Retrieved from: https://www.indiatoday.in/india/story/kerala-reports-first-confirmed-novel-coronavirus-case-in-india-1641593-2020-01-30. Accessed date: 09th October, 2020.
- MoHFW, Ministry of Health and Family Welfare, Government of India, 2020. Retrieved from: www.mohfw.gov.in/pdf/VisarestrictionsrelatedtoCOVID19Ministries.pdf. Accessed date: 09th October, 2020.
- Deccan Herald, 2020. PM Narendra Modi announces 3-week national lockdown from March 24 midnight. Retrieved from: https://www.deccanherald.com/national/pm-narendra-modi-announces-3-week-national-lockdown-from-march-24-midnight-817221.html. Accessed date: 09th October, 2020.
- Nakada L.Y.K., Urban R.C., 2020. COVID-19 pandemic: impacts on the air quality during the partial lockdown in São Paulo state, Brazil. Sci. Total Environ. https://doi.org/10.1016/j.scitotenv.2020.139087.
CrossRef - Otmani A., Benchrif A., Tahri M., Bounakhla M., Chakir M., Bouch M., Krombi M., 2020. Impact of Covid-19 lockdown on PM10, SO2 and NO2 concentrations in Salé City (Morocco). Sci. Total Environ. https://doi.org/10.1016/j.scitotenv.2020.139541.
CrossRef - Lian X., Huang J., Huang R., Liu C., Wang L., Zhang T. Impact of city lockdown on the air quality of COVID-19-hit of Wuhan city. Sci. Total Environ. https://doi.org/10.1016/j.scitotenv.2020.140556.
CrossRef - Mahato S., Pal S., Ghosh K.G., 2020. Effect of lockdown amid COVID-19 pandemic on air quality of the megacity Delhi, India. Sci. Total Environ. https://doi.org/10.1016/j.scitotenv.2020.139086.
CrossRef - Kumar P., & Hama S., Omidvarborna H., Sharma A., Sahani J., Abhijith K.V., Debele S., Zavala-Reyes J., Barwise Y., Tiwari A., 2020. Temporary reduction in fine particulate matter due to ‘anthropogenic emissions switch-off’ during COVID-19 lockdown in Indian cities. Sustainable Cities and Society. https://doi.org/10.1016/j.scs.2020.102382.
CrossRef - Kulshrestha U. C. 2020. ‘New Normal’ of COVID-19: Need of New Environmental Standards. Curr World Environ; 15(2). http://dx.doi.org/10.12944/CWE.15.2.01.
CrossRef - Bhattacharyya D.B., Mitra S., 2013. Making Siliguri a walkable city. Procedia. https://doi.org/10.1016/j.sbspro.2013.08.307.
CrossRef - Roy S., Singha N., 2020. Analysis of Ambient Air Quality Based On Exceedance Factor and Air Quality Index for Siliguri City, West Bengal. Curr World Environ. 15 (2). https://doi.org/10.12944/CWE.15.2.11.
CrossRef - EPA, Environmental Protection Agency, 2019. Retrieved from: https://www.epa.gov/so2-pollution/sulfur-dioxide-basics. Accessed date: 02th October, 2020.
- Behera S.N., Sharma M., Aneja V.P., Balasubramanian R., 2013. Ammonia in the atmosphere: a review on emission sources, atmospheric chemistry and deposition on terrestrial bodies. Environ Sci Pollut. https://doi.org/10.1007/s11356-013-2051-9.
CrossRef - Bertoa R.S., Villafuerte P.M., Riccobono F., Vojtisek M., Pechout M., Perujo A., Astorga C., 2017. On-road measurement of NH3 emissions from gasoline and diesel passenger cars during real world driving conditions. Atmospheric Environment. http://dx.doi.org/10.1016/j.atmosenv.2017.07.056.
CrossRef - Kean A.J., Harley R.A., Littlejohn D., Kendall G.R., 2000. On-road measurement of ammonia and other motor vehicle exhaust emissions. Environ. Sci. Technol. https://doi.org/10.1021/es991451q.
CrossRef - Sicard P., Marco A., Agathokleous E., Feng Z., Xu X., Paoletti E., Rodriguez J.J.D., Calatayud, V., 2020. Amplified ozone pollution in cities during the COVID-19 lockdown. Sci. Total Environ. https://doi.org/10.1016/j.scitotenv.2020.139542.
CrossRef - Gorai A.K., Tchounwou P.B., Mitra G., 2017. Spatial variation of ground level ozone concentrations and its health impacts in an urban area in India. Aerosol Air Qual. Res. https://doi.org/10.4209/aaqr.2016.08.0374.
CrossRef - NDTV, 2020. Coronavirus - Offices, Liquor Shops, Cabs: What's Allowed And Where In Lockdown Phase 3. Retrieved from: https://www.ndtv.com/india-news/coronavirus-lockdown-phase-3-whats-allowed-what-isnt-2221819. Accessed date: 13th October, 2020.
- MHA, Ministry of Home Affairs, Government of India, 2020. Retrieved from: https://www.mha.gov.in/sites/default/files/MHAOrderDt_30052020.pdf. Accessed date: 15th October, 2020.
- Siliguri Times, 2020. Retrieved from: https://siliguritimes.com/coronavirus-unlock-1-several-people-in-siliguri-living-under-severe-crisis/. Accessed date: 17th August, 2020.


