Meteorological Drought Analysis Using Standardized Precipitation Index
Parthsarthi Pandya1
*
 , Rohit Kumarkhaniya1
, Ravina Parmar1
and Piyush Ajani1
, Rohit Kumarkhaniya1
, Ravina Parmar1
and Piyush Ajani1
http://dx.doi.org/10.12944/CWE.15.3.12
Copy the following to cite this article:
Pandya P, Kumarkhaniya R, Parmar R, Ajani P. Meteorological Drought Analysis Using Standardized Precipitation Index. Curr World Environ 2020;15(3).
DOI:http://dx.doi.org/10.12944/CWE.15.3.12Copy the following to cite this URL:
Pandya P, Kumarkhaniya R, Parmar R, Ajani P. Meteorological Drought Analysis Using Standardized Precipitation Index. Curr World Environ 2020;15(3). Available From: https://bit.ly/3kZ9Srs
Download article (pdf)
Citation Manager
Publish History

Introduction
Inappropriate agroecosystem management and frequent droughts have made the drylands increasingly susceptible and prone to rapid degradation.1 Drought is an extreme hydrological event relates to not only rainfall amount but also its intensity, duration, frequency as well as distribution. The parameters like temperature, evaporation, wind speed, relative humidity, etc. also play important role in drought occurrence. Drought can be categorized based on its impact in four basic approaches i.e. meteorological, hydrological, agricultural, and socioeconomic.2 It is difficult to analyze the drought due to its slow beginning, silent spread and unstructured complex impacts.
Drought has been analyzed by several indices across the world, the selection of an appropriate index is based on data availability and capability of the index to determine drought characteristics across space and time for a specific region.3 As good quality rainfall data are easily available for many locations as compared to other meteorological parameters, rainfall based drought indices are most popular for drought analysis. Out of various rainfall based indices, the superiority of Standardized Precipitation Index (SPI) 4 was advocated by researchers across the world as compared to other rainfall based indices based on various characteristics. 5,6,7,8,9,10 The SPI gives a quantity of standard deviations with respect to cumulative precipitation deficit deviation from long-term average. SPI has the advantage of being easily calculated and has modest data requirements.11 SPI has the strength to analyses the drought at various time scales based on various applications. 12 Drought was analyzed for 1, 3, 6 and 12-month time scales by researchers throughout the world.13, 14,15,16,17,18,19,20,21 SPI gives best result in absence of data on other climatic parameters.22
Many states in India are still relying on eye estimation and crop cutting experiments to assess drought and its effect.25 In such cases, final Kharif and Rabi crop estimates will be available after two-three months. To get timely information, rainfall based drought index like SPI has shown the capability of early warning to mitigate negative impacts of drought.26, 27. The SPI for various time scales were positively correlated with crop production. 28, 29, 30 Besides, SPI and yield correlation provide a good base for designing crop yield prediction. 31 Therefore, keeping the above facts in view, a study was planned to analyze meteorological drought for Junagadh (Gujarat) and correlate productivity major Kharif crops of the Junagadh district i.e. Groundnut and Cotton with Standardize Precipitation Index. This study will provide a base to evaluate drought characteristics of the region and its effect on major crops. It will help the scientific community, policymakers and stakeholders in for the beginning of Government response, contingency planning and impact assessment, freshwater planning and management as well as agricultural policies for food security based on an early warning.
Materials and Methods
Description of Study Area
Junagadh is located in the southwest of Gujarat State, India situated at 21.520 N latitude and 70.450 E longitude. It falls under semi-arid region with 900 mm average annual rainfall. The rainy season is spread between the month of June and September.32 June, July, August, September and October month contribute 17%, 40%, 20%, 20% and 3% in the total seasonal rainfall respectively. The location of Junagadh District is depicted in Figure 1. The rainfall distribution is uneven and irregular as the region is situated southwest monsoon periphery.
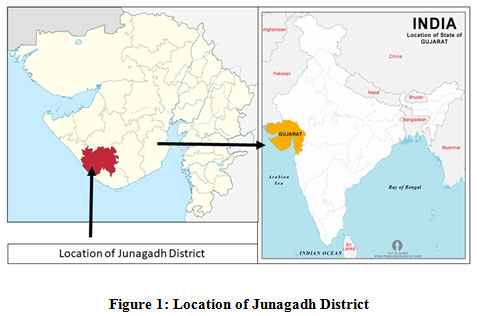 |
Figure 1: Location of Junagadh District Click here to view figure |
Junagadh falls in the Saurashtra region of Gujarat, looking at different districts' rainfall variability and SPI values, on an average one extreme drought (1987), four severe droughts 1972,1974,1985 and 1987) and four moderate droughts 1966,1991,2000 and 2012) were observed in Saurashtra with a little variation in different districts. In an extremely dry year (1987), the area, production and yield in Junagadh district were reduced to the tune of 52, 77 and 74% respectively as compared to normal year (1983-84) as well as 0.86 lakhs cattle were critically affected. 33 Therefore, drought analysis can prove an important tool for the region.
Junagadh district has a geographical area of 509336 ha out of which 70% area is cultivable. The surface and groundwater availability is 1124.8 Million Cubic Meter (MCM) against the demand of 2542 MCM with a total gap of 1417 MCM. There is no canal irrigation in the district and Agriculture is heavily dependent on groundwater which has 89% share in total water resources.34 Therefore, the dependency on seasonal rainfall is very high for crop production. Researchers based on the study in Pakistan were of the opinion that Agriculture activities remain at risk in a single weather system when there is a rainfall deficiency.27
Groundnut and Cotton crop
India is one of the largest producer of groundnut and cotton in the world. Gujarat recorded the highest groundnut production of the country (32%) and second-highest (21.22%) production of cotton in the year 2018-19.35 Groundnut and Cotton are the major Kharif crops of the Junagadh district with a share of 80% and 8% Kharif sowing area of the district respectively. Kharif crops are sown in the last week of June or early July. For groundnut, rainfall should be distributed well during the flowering and pegging. 36 Total growth period for groundnut is considered as 120 days five crop phases (i.e., Pre-sowing (23rd and 24th MSW), Germination and vegetative growth (25th to 27thMSW), Flowering and peg initiation (28th to 31st MSW), full pegging to pod development (32nd to 36th MSW) and Pod maturation (37th to 39thMSW). The critical stages of groundnut crop with respect to water requirement are flowering, peg penetration and pod development.37 The various phenological stages of cotton with respect to water requirement are emergence to flowering (7-47 days), first flower to first seed (47-66 days), first seed to ball formation (66-101 days) and ball formation to ball maturity (101-135 days). The first seed to ball formation is the most critical stage followed by ball formation to ball maturity. 38, 39
Standardized Precipitation Index
The Standardized Precipitation Index is a ratio of difference between precipitation for any duration and its long-term mean to standard deviation.2
Where,
Xij is actual precipitation of a given duration
Xim is long-term mean a given duration
SD is the standard deviation
SPI was evaluated based on monthly rainfall data of 1988 to 2018 for three-time scales and eight different durations, i.e. Monthly (SPI-1) for each of June to September, SPI -3 (August) considering accumulated rainfall of June-July-August, SPI -3 (September) considering accumulated rainfall of August-September-October and SPI-6 (November) considering total rainfall of June to November. McKee et al., 1993 suggested seven drought categories for SPI ranged between ≥2 to≤2 as extremely wet and extremely dry respectively. The classification of drought category based on SPI is depicted in Table 1. The researchers used the same calcification for drought analysis like in Gujarat 22, Iran 3 and Maharashtra21, etc.
Table 1: Classification of Drought based on SPI
|
SPI Values |
Category |
|
2.0 or more |
Extremely wet |
|
1.5 to 1.99 |
Severely wet |
|
1.0 to 1.49 |
Moderately wet |
|
0.0 to 0.99 |
Mild wet |
|
-0.99 to 0.0 |
Mild drought |
|
-1.0 to -1.49 |
Moderately drought |
|
-1.5-1.99 |
Severely drought |
|
-2 or less |
Extremely drought |
Positive SPI represents the wet condition and negative SPI represents the dry condition with respect to normal rainfall. Value of SPI 1.0 or less represents the drought. The SPIs for all eight durations were correlated with groundnut and cotton productivity of the Junagadh District.
Data
As long-term rainfall record is essential to analyse the drought, therefore 31 years monthly rainfall data from 1988 to 2018 obtained from Meteorological Station, Junagadh Agricultural University was used for drought analysis. The crop yield data of Kharif Groundnut and Kharif Cotton for Junagadh district from 1988 to 2018 was collected from the Directorate of Agriculture, Department of Agriculture and Farmers Welfare, Govt. of Gujarat.
Results and Discussion
Drought analysis based on SPI
The rainfall of 1988 to 2018 was analyzed for drought severity and duration for three-time scales with eight durations of the seasonal rainfall. The results of SPI values for eight different durations are depicted in Figure 2. A higher negative value of SPI suggests more severe drought, persistent of negative value in consecutive years for a given time scale represents the persistence of drought.
The drought analysis based on a monthly time scale reveals that Junagadh suffered from mild drought for 10 years and moderate drought for 7 years in June, with consecutive three years, i.e. 1991 to 1992 moderate drought was observed. There was no severe or extreme drought recorded in June for 31 years under study. The SPI-1 of July demonstrates that Junagadh experienced 13 years with mild drought, 2 years with moderate drought and 2 years with severe droughts in the years 1990 and 2002. Consecutive five years (1989 to 1993), consecutive four years (1999 to 2002) and (2014 to 2017) suffered from mild to severe drought. The SPI-1 for August month revealed that Junagadh faced 14 years with mild drought and 4 with moderate drought. For continuous seven years, i.e. from 1993 to 1999, mild/moderate drought occurred in August. The SPI-1 for September shows 14 years with mild drought and 4 years with moderate drought out of which years 1998 to 2004 i.e. continuous seven years with mild/moderate drought was recorded. October on average contributed only 3% of total seasonal rainfall with 11 years recorded no rainfall event, as a result, 21 mild droughts were recorded.
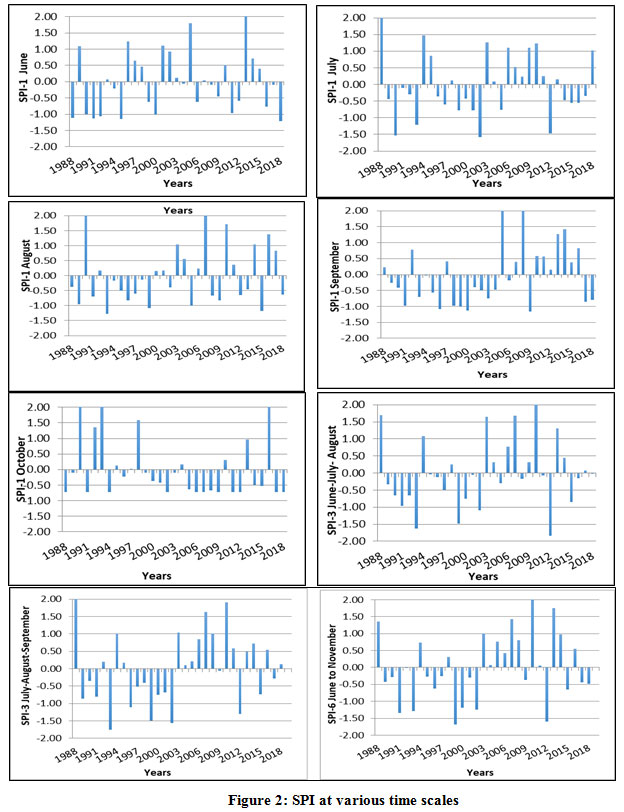 |
Figure 2: SPI at various time scales Click here to view figure |
The drought analysis based on a 3-months' time scale for SPI-3 (August), 15 mild droughts, 2 moderate droughts and 2 severe droughts years (1993 & 2012) were observed. Consecutive five years, i.e. 1989 to 1993 recorded to have mild to severe drought, consecutive four years, i.e.1999 to 2002 recorded mild/moderate drought for SPI-3 (August). The SPI-3 (September) portrays that 10 mild droughts, 3 moderate droughts and 2 severe droughts in 1993 & 2002 were observed. A long continuations drought duration for SPI-3 (September) was observed in the categories of mild/moderate/severe droughts for 1996 to 2002. For 6 monthly time scales, SPI-6 (November) suggests that 11 mild droughts, 4 moderate drought, and 2 severe droughts in 1999 and 2012 were observed in Junagadh. Five consecutive years, i.e. 1989 to 1993 suffered from mild/moderate drought and four consecutive years, 1999 to 2002 suffered from mild/moderate/severe drought considering SPI-6. Regarding drought duration, it has been observed that as the time scales increase, the drought duration was also increased. The drought frequency for a shorter time scale is high but with less duration and vice versa for longer time scales. 40
Table 2: Number of drought years for various time scales based on SPI
|
Severity |
SPI-1 June |
SPI-1 July |
SPI-1 August |
SPI-1 September |
SPI-1 October |
SPI-3 (June-Aug.) |
SPI- 3 (July -Sept.) |
SPI- 6 (June- Nov.) |
|
Mild Drought |
10 |
13 |
14 |
14 |
21 |
14 |
10 |
11 |
|
Moderate Drought |
7 |
2 |
4 |
4 |
0 |
2 |
3 |
4 |
|
Severe Drought |
0 |
2 |
0 |
0 |
0 |
2 |
2 |
2 |
|
Extreme Drought |
0 |
0 |
0 |
0 |
0 |
0 |
0 |
0 |
|
Total |
17 |
17 |
18 |
18 |
21 |
18 |
15 |
17 |
The abstract of the number of years falling under various drought categories is given in Table 2. The mild drought category was most dominant based on SPI-1 for all six months. For June to September, 32% to 45% of years out of 31 years fall under the mild drought category, while 68% of years fall under the mild drought category for October. Only July recorded 2 severe drought years. For SPI-3 (August), SPI- 3 (September) and SPI- 6 (November), 45%, 42 % and 35 % years recorded mild drought and 6%, 10% and 6% years have moderate drought respectively. 2 years (i.e. 6%) were observed severe drought category for SPI-3 and SPI-6. Overall, 58% of years were under drought for SPI-3 and SPI-6. The years 1993, 1999, 2002 and 2012 were severe drought years based on SPI-3 and SPI-6. No extreme drought was observed in 8 durations under various time scales for Junagadh based on SPI.
Table 3: Most severe SPI, Drought Category, Year and Rainfall amount
|
Duration |
Most Severe SPI |
Category |
Year |
Rainfall mm |
|
|
SPI-1 |
June |
-1.20 |
Moderate Drought |
2018 |
07.4 |
|
July |
-1.58 |
Severe Drought |
2002 |
45.3 |
|
|
August |
-1.27 |
Moderate Drought |
1993 |
03.7 |
|
|
September |
-1.16 |
Moderate Drought |
2009 |
00.0 |
|
|
October |
-0.72 |
Mild Drought |
2018 |
00.0 |
|
|
SPI-3 |
June to Aug. |
-1.84 |
Severe Drought |
2012 |
244.1 |
|
July to Sept. |
-1.75 |
Severe Drought |
1993 |
196.3 |
|
|
SPI-6 |
June to Nov. |
-1.68 |
Severe Drought |
1999 |
394.5 |
The values of most severe SPI, its year of occurrence and rainfall amount i.e. minimum amount of rainfall for a particular duration for the years under study is displayed in Table 3. The most intense drought was observed in 2012 with SPI-3 (August) -1.84 when rainfall of 244.1 mm occurred. On an average 50% of years were under drought for Junagadh, these results are in agreement with the study of neighboring district Rajkot which stated that on average there was a drought condition once in two years for Rajkot.8 Table 2 and Table 3 reflects that the intensity of extreme drought and no. of years with intense drought were less in case of SPI-1 for June, August, September and October as compared to SPI-1 for July, SPI-3 (June to Aug.), SPI- 3 (July to Sept.) and SPI- 6 (June to Nov.). The higher SPI is due to a smaller standard deviation indicates that more of the rainfall is clustered about the mean across the years under study. While the reverse is true for SPI-1 (July), SPI-3 and SPI-6 were rainfall is more spread out in various years for a particular duration with higher standard deviation. Only these durations showed severe drought, except these, SPI-1 for all months showed Mild/Moderate drought. A study also revealed that more intense drought category i.e. severe and extreme drought were not recorded for less than 3 months' time scale. 27
Correlation between SPI and productivity of Groundnut and Cotton
The average Kharif groundnut yield of Junagadh district was 1502 kg/ha with the highest and lowest yield as 3590 kg/ha in 2013 and 442 kg/ha in 1993 respectively. The average groundnut yield of Junagadh district is higher than the national average of 1320 kg/ha and some major growing states of the country Gujarat (1372 kg/ha), Maharashtra (1049 kg/ha) and Andhra Pradesh (892 kg/ha). However, it is lower than Rajasthan (1870 kg/ha) and Tamilnadu (2105 kg/ha). The average Kharif cotton yield of Junagadh district was 577 kg/ha with the highest being 1171 kg/ha in 2005 and the lowest as 263 kg/ha in 2000. The average cotton yield of the district is higher than the national average of 390 kg/ha and average state yield of Maharashtra (335 kg/ha) and Telangana (504.8 kg/ha), but lower than the average yield of Gujarat (669 kg/ha), Andhra Pradesh (558 kg/ha) and Tamilnadu (589 kg/ha). 35, 43, 44. The Coefficient of variation of yield was 50 % for groundnut and 44% for cotton.
Table 4: Correlation between SPI and Cotton & Groundnut yield
|
Duration |
Correlation Coefficient |
||
|
Groundnut |
Cotton |
||
|
SPI-1 |
June |
0.59* |
0.31 |
|
July |
0.31 |
0.29 |
|
|
August |
0.30 |
0.13 |
|
|
September |
0.49* |
0.48* |
|
|
October |
-0.03 |
-0.16 |
|
|
November |
0.32 |
0.20 |
|
|
SPI -3 |
June to August |
0.69* |
0.46* |
|
July to September |
0.57* |
0.48* |
|
|
SPI-6 |
June to November |
0.79* |
0.56* |
* Significant at 95%confidence level (p < 0.05)
The correlation of SPI with the average productivity of cotton and groundnut crops of Junagadh district is depicted in Table 4. SPI owned a positive correlation with the productivity of both the crops for different durations except for October month. For groundnut, the correlation was significant for SPI-1 June and SPI-1 September as well as for both SPI-3 and SPI-6. Similarly, for cotton, the correlation was significant for September, SPI-3 and SPI-6. For the monthly time scale, the correlation coefficient was highest as 0.59 for groundnut in the case for SPI of June month and 0.48 for cotton for SPI of September. The weakest correlation was observed for October as -0.16 for cotton and -0.03 for groundnut, however, it was non-significant. A similar correlation was observed for both SPI-3 for cotton, while in the case of Groundnut, SPI-3 (August) showed a higher correlation with a coefficient as 0.69 as compared to 0.57 for SPI-3 (September). As stated earlier in materials and methods, the crop sowing is done in the last week of June or early July. As the crop period of groundnut is 120 days, SPI 3 (September) did not show a higher correlation than SPI-3 (August) for groundnut as critical stages for water requirement falls within the duration of SPI-3 (August). While for cotton, an almost identical correlation was observed for both SPI-3 (August) and SPI-3 (September) as the crop period of cotton is 135 days with multiple picking. SPI-3 and SPI-6 failed to demonstrate the effect of drought on cotton crop yield in 1991. This results also confirmed with a study indicating a SPI-3 for September was found useful for evaluating food grain production anomaly. The precipitation of July to September was found decisive for major Kharif crops of Gujarat.28 A study also revealed that SPI-3 was better correlated with the irrigation requirement during the mid-season stages of rice crop.44 Groundnut yield was better correlated with all the time scales as compared to cotton across all eight durations. The highest significant correlation was observed for SPI-6 for both groundnut and cotton with correlation coefficient of 0.79 and 0.56 respectively. SPI-6 has a slightly better correlation with both the crop productivities as compared to SPI-3, but as stated in study 28, SPI-3 was able to evaluate production loss due to drought in advance. The same opinion was noted during a study for pearl millet and groundnut in Rajasthan and Gujarat respectively.44 Therefore, SPI-3 is also equally important. The years 1993, 1999, 2002 and 2012 were the most intense drought years as indicated by SPI-3 and SPI-6 for which the productivity as % of the long-term average for groundnut was 29% to 60% and cotton was 52% to 67%. Hence, it can be stated that SPI-3 and SPI-6 could quantify the yield loss caused by drought. Thus, longer duration time scales of 6 and 3 months showed the better ability for judging the crop productivity as compared to monthly time scales.46 Based on SPI-3 and SPI-6, the year 1990 falls under mild drought, however, for SPI-1 July, the year 1990 in severe drought category with yield of groundnut and cotton as 62% and 55% of the average yield respectively. In such cases, it can be seen that the adverse effect of less precipitation at the critical stage of crop may be nullified for a longer duration of SPI-3 and SPI-6 showing less severe drought for that particular year which may sometimes lead to a misleading conclusion. Therefore, SPI of a monthly time scale should also be taken into consideration. Thus, the standardized precipitation index has proven its ability to explain the drought occurrence, its severity and duration also probable impact on crop yield of groundnut and cotton for Junagadh district.
Conclusion
This study was undertaken to analyze the drought of Junagadh districts and its correlation with the productivity of major Kharif crop groundnut and cotton. The mild drought was the most dominant drought category for Junagadh. No extreme drought was observed for the duration under study in Junagadh. The years 1993, 1999, 2002 and 2012 qualified as the most intense drought by SPI-3 and SPI-6. It can be concluded that better judgment of the drought occurrence and its probable impact on agriculture and water resources can be obtained using standardized precipitation index for 3 months and 6 months' time scales. In addition to this multiple indices based on rainfall and other climatic parameters may showcase a better idea about drought analysis and its effect on crop production. The results obtained point to a significant correlation between these two random variables, i.e. SPI and crop yield at the district level. Therefore, this study is a good base for designing a model for good-quality crop yield prediction. In the future, studies should be conducted for predicting drought yield losses based on SPI and other indices using various technics such as regression, artificial neural network, copula function, etc. for the forecast of drought and its impact on agriculture.
Acknowledgment
The authors are thankful to the department of Agro-meteorology, Junagadh Agricultural University, Junagadh for providing necessary data.
Funding
The author(s) received no financial support for the research, authorship, and/or publication of this article.
Conflict of Interest
The authors do not have any conflict of interest.
References
- Rathore, L.S. Challenges and opportunities in agrometeorology. Journal Agrometeorology, 2020; 22(1):3-6. http://agrimetassociation.org/journal-view/dr.-l.a.-ramdas-memorial-lecture.
- Wilhite, D.A. and Glantz, M.H. Understanding the drought phenomenon: the role of definitions. Water International, 1985; 10(3):111–120. https://digitalcommons.unl.edu/cgi/viewcontent.cgi?article=1019&context=droughtfacpub.
CrossRef - Zarei, A., Asadi, E., Ebrahimi, A., Jafari, M., Malekian, A., Tahmoures, M. and Alizadeh, E. Comparison of meteorological indices for spatio-temporal analysis of drought in Chahrmahal-Bakhtiyari province in Iran. Croatian Meteorology Journal, 2017; 52:13-26.
- McKee, T.B., Doesken, N.J. and Kleist, J. The relationship of drought frequency and duration to time scales. Paper presented at: 8th Conference on Applied Climatology. American Meteorological Society, Boston, 1993; 179-184.
- Manatsa, D., Mukwada, G., Siziba, E. and Chinyanganya, T. Analysis of multidimensional aspects of agricultural droughts in Zimbabwe using the standardized precipitation index (SPI). Theoretical and Applied Climatology, 2010; 02:287-305.
CrossRef - Palchaudhuri, M. and Biswas, S. Analysis of Meteorological drought using standardized precipitation index - A case study of Puruliya district, West Bengal, India. International Journal of Environmental, Ecological, Geological and Geophysical Engineering, 2013; 7: 119-126.
- Mundetia, N. and Sharma, D. Analysis of rainfall and drought in Rajasthan state, India. Global Nest Journal, 2014; 6:1-10.
- Rachchh, R. and Bhatt, N. Monitoring of drought event by standardized precipitation index (SPI) in Rajkot district, Gujarat, India. International Journal of Science and Research, 2014; (1): 2321-9939.
- Solanki, J. K. and Parekh, F. Drought assessment using standardized precipitation index. International Journal of Science and Research, 2014; 3(7):1073-1076.
- Rajasivaranjan, T., Patel, N.R., Ponraj, A., Kumar V. and Surendran U. Development and application of SPI generator using open source for analyzing drought at a varying time scale. Journal of Agrometeorology, 2019; 21(4):420-426.
- Agnew, C. T. Using the SPI to identify drought. Drought Network News (1994-2001), 2004.
- Wu, H. Hayes, M.J. Weiss, A. and Hu, Q. An evaluation of the standardized precipitation index, the China-Z-index and the statistical Z-score, International Journal of Climatology, 2001; 21, 745–758.
CrossRef - Sigdel, M. and Ikeda M. Spatial and temporal analysis of drought in Nepal using standardized precipitation index and its relationship with climate indices. Journal of Hydrology and Meteorology, 2010; 7 (1): 59-74.
CrossRef - Christos, A., Karavitis, S. A., Demetrios E. T. and George, A. Application of the standardized precipitation index (SPI) in Greece. Water, 2011; 3: 787-805.
CrossRef - Capra, A. and Scicolone, B. Spatiotemporal variability of drought on a short-medium time scale in the Calabria region (Southern Italy). Theory Applied Climatology, 2012; 110:471–488.
CrossRef - Xie, H., Ringler, C., Zhu, T. and Waqas, A. Droughts in Pakistan- a spatiotemporal variability analysis using the standardized precipitation index. Water International, 2013; 38(5): 620-631.
CrossRef - Topcu, E. and Seckin, N. Drought analysis of the Seyhan Basin by using standardized precipitation index (SPI) and L-moments, Tarim Bilimleri Dergisi. Journal of Agricultural Sciences, 2015; 22:196-215.
CrossRef - Carlos, B. C, Brenda, C., Gonzalo, P. and Hugo, J. Drought assessment in Zacatecas, Mexico. Water, 2016; 8: pp. 416.
CrossRef - Kumar, A. Characterizing meteorological drought using standardized precipitation index for Dehradun, Uttarakhand. Indian Journal of Soil Conservation, 2016; 44(2): 157-162.
CrossRef - Malakiya, L. A. and Suryanarayana, T. Assessment of drought using standardized precipitation index (SPI) and reconnaissance drought index (RDI): a case study of Amreli district. International Journal of Science and Research, 2016; 5 (8): 1995-2002.
- Mishra, S. and Chauhan, M. Performance evaluation of two meteorological indices for drought assessment in Jalna. International Journal of Current Research, 2019; 11(01): 521 -525.
- Shah, R., Bharadiya, N. and Manekar, V. Drought index computation using standardized precipitation index (SPI) method for Surat district, Gujarat. Aquatic Procedia, 2015; 4:1243-1249.
CrossRef - Adnan S, Ullah K, GAO S. Characterization of drought and its assessment over Sindh, Pakistan during 1951–2010. Journal of Meteorological Research, 2015; 29:837-857.
CrossRef - Guttman, N.B. Accepting the standardized precipitation index: a calculating algorithm. Journal of American Water Resource Association, 1999; 35:311–323.
CrossRef - Anonymous. "Manual for Drought Management". Department of Agriculture, Cooperation & Farmers Welfare, Ministry of Agriculture & Farmers Welfare Government of India, New Delhi, 2016;31p.
- Karavitis, C.A., Alexandris, S., Tsesmelis, D.E. and Athanasopoulos, G. Application of the standardized precipitation index (SPI) in Greece. Water, 2011; 3: 787-805.
CrossRef - Adnan, S., & Ullah, K. Development of drought hazard index for vulnerability assessment in Pakistan. Natural Hazards, 2020; 1-22.
CrossRef - Patel, N., Chopra B. P, and Dadhwala, V. Analyzing spatial patterns of meteorological drought using standardized precipitation index. Meteorological Applications, 2007; 14: 329–336.
CrossRef - Deepa, B.K., Shweta, G., Himani, B., Shraddha, R. and Arnab, K. Drought assessment for Kharif rice using standardized precipitation index (SPI) and vegetation condition index (VCI). Journal of Agrometeorology, 2019; 21(2):182-187.
- Marina, G., Vicente-Serrano, S., Domínguez-Castro, F. and Beguería, S. The impact of drought on the productivity of two rainfed crops in Spain. Natural Hazard and Earth System, 2019; 19:1215-1234.
CrossRef - Zurovec, J. and Cadro, S. The relationship between standardized precipitation index and yield reduction of significant agricultural crops in northeastern Bosnia. Paper presented at: 22nd International Scientific-Expert Conference of Agriculture and Food Industry, Sarajevo, Bosnia and Herzegovina, 2011; 265-268.
- Pandya, P.A., Mashru, H.H. Patel, R.J. and Rank. H.D. Rainfall variations and its correlation with groundnut productivity. International Journal of Multidisciplinary Research and Development, 2019; 6: 87-90.
- Pathak, A. R., Mathukia R. K., and Chopada M. C. Saurashtra, the drought prone region of Gujarat. In: “Droughts and the Way Forward”. (Eds. M.C. Varshneya, A. Javalekar, R. G. Shah and D. B. Patil), 2016; 86-104. (Kamdhenu University, Gandhinagar).
- Anonymous. Pradhan Mantri Krishi Sinchayee Yojana (PMKSY), District Irrigation Plan (2016-2020), Junagadh, Gujarat
- Anonymous. PocketBook of Agricultural Statistics 2019. Government of India Ministry of Agriculture & Farmers Welfare Department of Agriculture, Cooperation & Farmers Welfare Directorate of Economics & Statistics New Delhi, 2019. pp
- Madhusudhana, B. A Survey on Area, Production and Productivity of Groundnut Crop in India. IOSR Journal of Economics and Finance, 2013; 1:1-7.
CrossRef - Parmar, R.S. Influence of rainfall distribution on the productivity of groundnut in Bhavnagar district of Gujarat state. International Journal of Agricultural Sciences and Veterinary Medicine, 2013; 1(1): 2320-3730.
- Shikha, A., Maharana, P., Singh, K.K. and Dimri, A.P. Cotton crop in changing climate. Article in current science, 2018; 115(5):948-954.
CrossRef - Loka, D. and Oosterhuis, D. Water stress and reproductive development in cotton. Flowering and Fruiting In Cotton, 2012: 51-58.
- Yang, X., Shao, X.H., Mao, X.Y., Li, M.H., Li, X.N. and Li, R.Q. An analysis of drought evolution characteristics based on standardized precipitation index: a case study in Southwest Guizhou Autonomous Prefecture, China. Journal Agrometeorology, 2019; 21(1):31-35.
- Yaseen, K. AL-Timimi and Osamah, A. Comparative study of four meteorological drought indices in Iraq. IOSR Journal of Applied Physics, 2016; 8(5)76-84. https://cotcorp.org.in/statistics.aspx
- Gayathri, J. A Trend Analysis of Area, Production, and Yield of Groundnut in India. Shanlax International Journal of Economics, 2018; 6(3), 15–21.
- Pradhan, S., Sehgal, V., Das, D. and Singh, R. Analysis of meteorological drought at New Delhi using SPI. Journal of Agrometeorology, 2011; 13(1): 68-71.
- Chaudhari, K.N. and Dadhwal, V.K. Assessment of impact of drought- 2002 on the production of major Kharif and Rabi crops using standardized precipitation index. Journal of Agrometeorology, 2004; 6:10–15.
- Sangita, M. S. and Nagarajan, R. Spatio-temporal drought assessment in Tel river basin using Standardized Precipitation Index (SPI) and GIS, Geomatics, Natural Hazards and Risk,2011; 2:1, 79-93.
CrossRef


