Seasonal Nature and Trends of Tropical Cyclone Frequency and Intensity over the North Indian Ocean
Abhisek Pal1
*
 and Soumendu Chatterjee1
http://dx.doi.org/10.12944/CWE.15.3.16
Copy the following to cite this article:
Pal A, Chatterjee S. Seasonal Nature and Trends of Tropical Cyclone Frequency and Intensity over the North Indian Ocean.Curr World Environ 2020; 15(3). DOI:http://dx.doi.org/10.12944/CWE.15.3.16
Copy the following to cite this URL:
Pal A, Chatterjee S. Seasonal Nature and Trends of Tropical Cyclone Frequency and Intensity over the North Indian Ocean.Curr World Environ 2020; 15(3). Available from: https://bit.ly/3qfP56R
Download article (pdf) Citation Manager Publish History

Introduction
TCs are the rotating atmospheric vortices which develop over the tropical oceanic environments. They are one of the most dangerous climatic phenomena on the earth which cause an enormous amount of loss of lives and property every year by producing high-velocity winds, oceanic surges, and a huge amount of rainfall. Generally, they have a diameter of about 500 to 1000 km extending up to the tropopause. About 15% of the world population are living at risk from tropical cyclones1. The potential loss due to the hazardous impacts of TCs are particularly higher in the less developed and highly populated countries like India. India has experienced some of the deadliest TCs of the world such as the Andhra Pradesh cyclone of 1946 and 1977, the Tamil Nadu cyclone in 1979, the Bengal cyclone in 1993, Odisha cyclone in 1999, Phailin in 2013 etc. To mitigate the hazardous impacts of TCs, it is very important to try to have a better understanding of their nature so that timely accurate forecasts can be made. Researchers have documented that the climatic characteristics of the earth is changing which can significantly change the overall character of TC genesis. An increasing trend in TC frequency is observed over the eastern coastal region of India2whereas a decreasing trend in TC genesis is observed in the north America3 and Australian region.4Furthermore, increased TC intensity is observed in the western north Pacific.5,6Numerical models7,8 suggest decreasing TC genesis inamore warming environment but the intensity of TCs will be maximized.9,10,11ACE is a measure of intensity and duration of a TC. ACE is calculated from the maximum sustained wind at 6-hours interval over the entire TC lifespani.e. from generation of a low pressure system to dissipation of the TC.12,13,14, 15Environmental factors havea significant influence on ACE of the TCs. The TCs during the El-Nino yearsgenerally have higher ACE compared to the La-Nina year over the western north Pacific15
Several authors have discussed the nature of TC activity over the NIO region.17,18,19Because of the NIO surrounded coastal region of India is one of the most densely populated areas in the world, it is very important to try to better understand the seasonal nature in terms TCfrequency, movement and intensity over the NIO regionwhich will help us to take better management strategies. Furthermore, it is also important to understand that present trends in TC frequency and intensity keeping climate change in mind. The present paper tried to explore the seasonal nature of TCs in terms of genesis location, movement and estimate the recent trends in TC frequency and intensity over the NIO region.
Materials and Methods
The study is based entirely on secondary data. The study area considered in the present study is the entire NIO region extending from 0° to 24°N latitudes and 55°E to 100°E longitudes. The monthly TC (intensity >34 kts) frequency data were collected from Regional SpecializedMeteorological Centre (RSMC) New Delhi,Cyclone E-Atlas spanning from 1891 to 2018. The 6-hourly TC intensity data were collected RSMC New Delhi best track data (1982-2018). In the present study, the term ‘tropical cyclone’ is used in a generic form referred to all those low pressure systems which have sustained wind >34kts.The TCs with intensity >48 kts were termed as severe cyclonic storms (SCS).
ACE15 was calculated to quantitatively access the intensity of the TCs. ACE is a representation of the total kinetic (wind) energy produced by a single TC during its entire lifespan. The ACE is defined as:

Where vmaxis the sustained wind speed measured in knots at 6 hours interval. The kinetic energy produced by wind is proportional to square of the wind speed. The summation represents the entire life span i.e. from generation of a low pressure system to dissipation of the TC at 6 hours interval. The ACE is multiplied by 10-4 to make the value more manageable.
The linear regression model20 has been used to assess the recent trends in TC frequency and ACE. The linear regression model is specifically used to predict the relationship between two variables.
Results and Discussion
Seasonal nature of TCsover the NIO region
The NIO region experiences monsoon type of climate where winds change their directions seasonally. We found a significant amount of seasonal variability in terms of frequency, movement,and intensity ofTCs over the AS and BoB region. The season-wise TC and SCS frequencies are shown in fig. 1. In the AS, 26.98% TCs occurred during the pre-monsoon season. The monsoon and post-monsoon season were responsible for generating 28.57% and 43.65% TCs respectively. In the BoB,18.26% TCs occurred during the pre-monsoon season. The monsoon season was responsible for generating 29.03% TCs and 50.96% TCs occurred during the post-monsoon season. The rest of.8% and 1.75% TCs occurred during January-February (not shown) over AS and BoB respectively. Considering the SCS, 32.87% SCS occurred during the pre-monsoon over the AS whereas 26.02% and 41.11% occurred during the monsoon and post-monsoon season. In the BoB region, pre-monsoon accounted for 24.78% SCS, monsoon accounted for13.67%, and lastly, the post-monsoon season generated 60.25% SCS.It is important to note that the TC frequency was lower in the AS compared to the BoB. The higher TC frequency for the BoB when compared (using two sample unpaired t-test) with AS, we found the difference to be statistically significant at 99% confidence level. We have calculated the mean monthly TC frequency for each region. In the AS, on an average .08, .07 and .14 TCs occurred during each month of the pre-monsoon, monsoon and post-monsoon season respectively. In the case ofBoB, on an average.24, .29 and .67 TCs occurred during each month of pre-monsoon, monsoon and post-monsoon season respectively.The monthly differences in TC events were tested using two sample unpaired t-test. The TC frequency differences between the pre-monsoon and monsoon were not statistically significantbut the increase in TC frequency during the post-monsoon compared to pre-monsoon and monsoon season were statistically significant at 99% confidence level in both AS and BoB. It was observed that both for AS and BoB, SCS frequency was greatly reduced during the monsoon season. We tested the differences in monthly mean SCS frequency and found that the lower SCS count during the monsoon compared to pre-monsoon and post-monsoon was statistically significant at 95% confidence level or both AS and BoB.
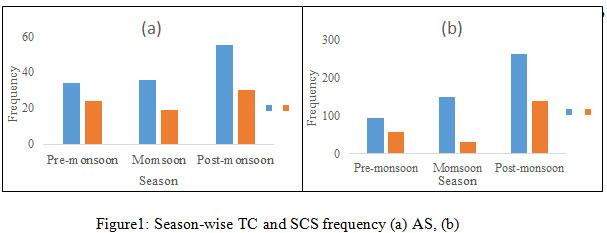 |
Figure 1: Season-wise TC and SCS frequency (a) AS, (b) BoB. |
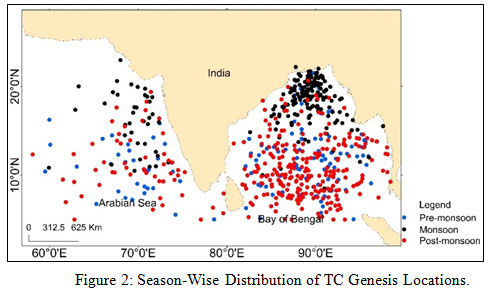 |
Figure 2: Season-wise distribution of TC genesis locations. |
The seasonal nature of the TCs were not only restricted in terms of their frequency but also reflected in their spatial distribution. The season-wise genesis TC genesis locations are shown on fig. 2. We observed that the mean TC genesis locations shifted season-wise over both theAS and BoB. Table 1 is showing the season-wise mean TC genesis and dissipation location, latitudinal and longitudinal movement and life span separately for BoB and AS region. It was observed that during the monsoon season, the TC genesis locations were shifted about 4 degrees in AS and 6 degrees in BoBnorthward compared to the pre-monsoon season. The difference in the genesis latitude between them when examined by using two sample unpaired t-test, we found that the differences were statistically significant at 99% confidence level. The longitudinal differences were found to be not significant. During the post-monsoon season, we found that the TC genesis locations were again shifted about 4 degrees in AS and 6 degrees in BoBsouthward compared to the monsoon season. The difference in the latitudinal shift between the monsoon and post-monsoon season was statistically significant at 99% confidence level. However, the longitudinal difference was again not significant between them.
Table 1: Season-wise TC track characteristics
|
Track Characteristics |
AS |
BoB |
||||
|
Pre-monsoon |
Monsoon |
Post-monsoon |
Pre-monsoon |
Monsoon |
Post-monsoon |
|
|
Genesis location |
12.27°N 63.88°E |
16.04°N 68.04°E |
12.06°N 66.55°E |
11.79N 88.71°E |
17.15°N 88.35°E |
11.34°N 88.83°E |
|
Dissipation location |
19.38°N 61.16°E |
21.75°N 63.72°E |
17.46°N 60.88°E |
21.31°N 91.12°E |
22.36°N 82.4°E |
19.23°N 83.47°E |
|
Latitudinal movement (°) |
7.11 |
5.7 |
5.4 |
9.51 |
5.21 |
7.88 |
|
Longitudinal movement (°) |
-2.72 |
-4.31 |
-5.66 |
2.41 |
-5.95 |
-5.35 |
|
Life span (hr) |
104 |
74 |
85 |
78 |
54 |
68 |
The latitudinal and longitudinal movement of the TCs portrayed some significant seasonal differences. The pre-monsoon TCs in both AS and BoB showed comparatively higher northward movement compared to monsoon and post-monsoon. The higher northward movement of the pre-monsoon TCs in the BoB was significant at 99% confidence level. The BoB TCs also showed significant longitudinal movement. It was observed that the pre-monsoon TCs of the BoBmoved further westward compared to the other two season and the higher westward movement of the pre-monsoon TCs was significant at 99% confidence level. The pre-monsoon TCs in AS and BoB showed a higher lifespan compared to the other two seasons although the differences are not statistically significant.
ACE is a function of both the intensity and lifespan of a TC. A higher ACE value reflects a greater amount of wind energy produced by a particular TC during its entire lifespan. We have discussed in the previous section that the frequency of the TCs varied significantly from season to season in AS and BoB. Now we have focused on their intensity. Fig. 3 is showing the season-wise average TC ACEfor AS and BoB. We have calculated ACE for each of the TCs for BoB and AS. We found that there was a tendency to form relatively weaker TCs during a particular season. Higher ACE was observed during the pre-monsoon and post-monsoon season compared to the monsoon season in both AS and BoB. To test whether the seasonal differences in ACE were significant or not, we performed two sample unpaired t-test. We found that the increased ACE during the pre-monsoon and post-monsoon compared to the monsoon was statically significant at 99% confidence level in AS. Whereas in BoB, only the difference between pre-monsoon and monsoon was statistically significant at 99% confidence level. On average we found higher (statistically significant at 95%confidence level) ACE for the AS compared to the BoB region.
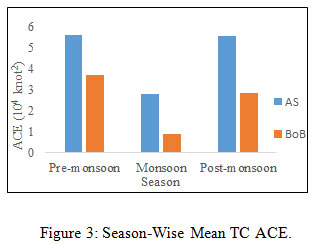 |
Figure 3: Season-wise mean TC ACE. |
Recent Trends of TC frequency and ACE over the NIO region
Trend is a smooth, regular and long term movement of a variable. It can grow, decline, or stagnate over time. Fig. 4 is showing the time series of TC frequency and fig. 5 is showing the time series of SCS frequency for AS, BoB and NIO region. The year-wise TC and SCS frequencyover the AS showed no significant trend. However, the time series of TC frequency over the BoB presented a decreasing trend with a correlation coefficient value of -.39 which is statistically significant at 99% confidence level. The time series SCS frequencydisplayed no such trend over the BoB. The time series of TC frequency for the NIO showed a negative trend with a correlation coefficient value of -.32 which is statistically significant at 99% confidence level. The time series of SCS frequency displayed no trend for the NIO.Similar kinds of results were noted by Nicholls et al. 19984 in the Australian region. Numerical simulations bySugi et al. 200921also found reduced TC frequency in a warming world due to changes in tropical circulation patterns and relative change in sea surface temperature. Contrasting results also reported by Korty et al. 201722, Bengtsson et al. 2007,23Wehner et al. 201824 andBengstsson et al. 1996.25 They argued that the increase in TC frequency due to increase in air temperature and water vapor content.
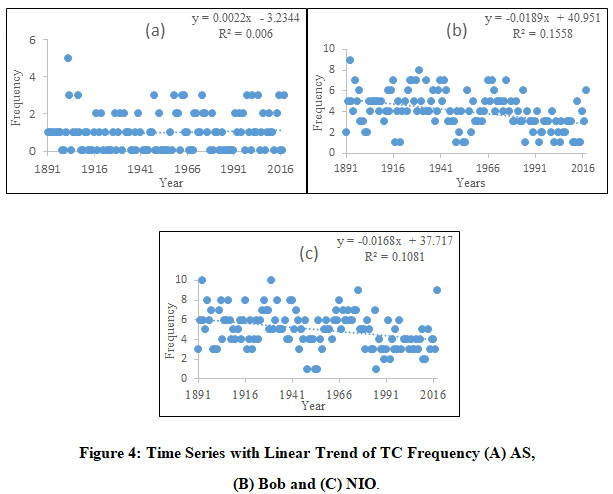 |
Figure 4: Time series with linear trend of TC frequency (a) AS, (b) BoB and (c) NIO. |
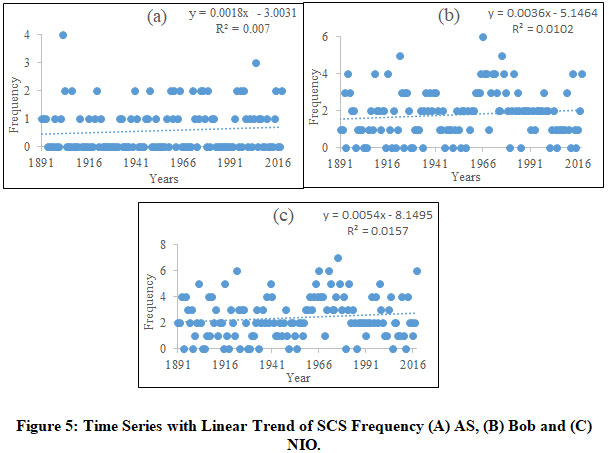 |
Figure 5: Time series with linear trend of SCS frequency (a) AS, (b) BoB and (c) NIO Click here to view figure |
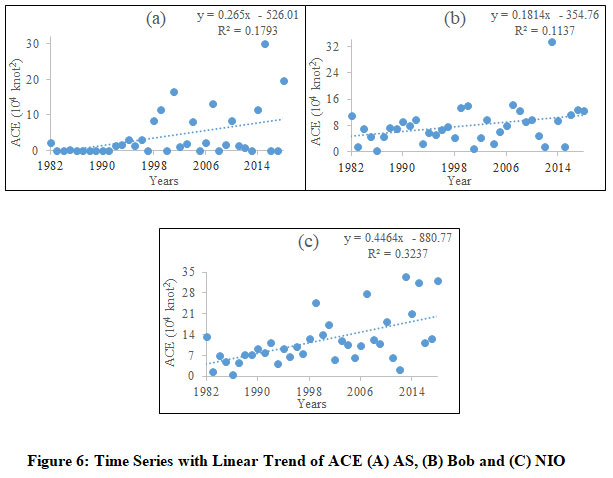 |
Figure: 6 Time series with linear trend of ACE (a) AS, (b) BoB and (c) NIO |
We calculated year-wise ACE of the TCs over the AS,BoB and NIO.Fig. 6 is showing the time series of ACE for AS, BoB and NIO.The time series of ACE for AS showed an upward trend with a correlation coefficient value of .42 which is statistically significant at 99% confidence level. The time series of ACE for BoB also showed an upward trend with a correlation coefficient value of .34 which is statistically significant at 95% confidence level. It is very important to point out that AS showed no trendin terms of TC frequency but the ACE was increased significantly. The BoB displayed a decreasing trend in TC frequency but showed an increasing trend in ACE. The ACE of the NIO showed an upward trend with a correlation coefficient value of .56 which is statistically significant at 99% confidence level. The studies of knuston et al. 2001,26 and Knuston and Tuleya 200427also confirmed the increase in TC intensity in climate models however contrasting results also reported by Yu et al.2010.28
Conclusion
The present work tried to explore the seasonal nature of TCsin terms of genesis location, movement, intensity,and estimated the present trend of TC frequency and ACE over theNIO region. We found that the characters of the TCs overAS and BoB varied significantly season-wise. TC frequency was maximized significantly during the post-monsoon season compared to the pre-monsoon and monsoon, and SCS frequency was reducedsignificantly during monsoon compared to the other two seasons for both the AS and BoB region. The TC genesis locations were also showed significant seasonal variations. During the monsoon season, TC genesis locations were significantly shifted northward compared to the pre-monsoon season and again retreated significantly southward during the post-monsoon season in both the regions. The movement of TCs also showed season-wise variations. The pre-monsoon TCs dissipated further northward compared to the monsoon and post-monsoon TCs in BoB. The pre-monsoon TCs over the BoB also significantly moved westward compared to the other two seasons.We examined theACE and found that the monsoon season TCs were the weakest compared to pre-monsoon and post-monsoon. The AS TCs were comparatively stronger than the BoB TCs. The time series of the TCs and SCSfor AS showed no significant trend however the TC frequency over BoB showed a significant decreasing trend. The time series of TCs for NIO further showed a significant reduction in frequency. Both the AS and BoB regions showed a statistically significant upward trend in terms of ACE which suggests that in the near future, the number of TCs might be decreased but they will be more intensified.
Acknowledgement
The first author is thankful to the University Grants Commission of India for funding the research work under the scheme of ‘JRF in Science, Humanities & Social Sciences’.
Conflict of Interest
The authors have no conflict of interest.
Funding
The author(s) received no financial support for the research, authorship, and/or publication of this article.
References:
- Smith K, Petley D. N. Environmental Hazards. Fifth Edition. New York: Routledge; 2008. ISBN? PAGES?
- Mishra A. Temperature Rise and Trend of Tropical Cyclones over the Eastern Coastal Region of India. Journal of Earth Science & Climatic Change, 2014; 5(9) PAGES?
CrossRef - Reitan C. H. Trends in the Frequencies of Cyclone Activity over North America. Monthly Weather Review, 1980; 170: 1684-88.
CrossRef - Nicholls N, Landsea C, Gill J. Recent Trends in Australian Region Tropical Cyclone Activity. Meteorology and Atmospheric Physics, 1998; 65:197-205.
CrossRef - Park D. S. R, Ho C. H, Kim J. H, Kim H S. Spatially Inhomogeneous Trends of Tropical Cyclone Intensity over the Western North Pacific for 1977-2010. Journal of Climate, 2013; 26:5088-5101.
CrossRef - Kossin J. P, Olander T. L, Knapp K. R. Trend Analysis with a New Global Record of Tropical cyclone Intensity. Journal of Climate, 2013; 26:9960-9976.
CrossRef - Oouchi K, Yoshimura J, Yoshimura H, Mizuta R, Kusunki S, Noda A. Tropical Cyclone Climatology in a Global-warming Climate as Simulated in a 20 km-Mesh Global Atmospheric model: Frequency and wind Intensity Analyses. Journal of the Meteorological Society of Japan, 2006; 84(2):259-276.
CrossRef - Yongping L, Xiaofeng W, Runling Y, Zenghao Q. Analysis and Prognosis of Tropical Cyclone Genesis over the Western North Pacific on the Background of global Warming. ActaOceanologicaSinica, 2007; 26(1):23-34.
- Yu J, Wang Y. Response of Tropical Cyclone potential Intensity over the North Indian Ocean to Global Warming. Geophysical Research Letters, 2009; 36. PAGES?
CrossRef - Kang N Y, Elsner J. B. Climate Mechanism for Stronger Typhoons in a Warmer world. Journal of Climate, 2016; 29:1051-1057.
CrossRef - Vecchi G. A, Fueglistaler S, Held I. M. Knuston T. R. Impacts of Atmospheric Temperature Trend on tropical Cyclone activity. Journal of climate, 2013; 26:3877-3891.
CrossRef - Collins D. J. Worldwide Tropical Cyclone Activity Measured Using the Actuaries Climate Index Methodology. Causality Actuarial Society E-Forum, 2018; 2. PAGES?
- Bell G. D. and others Climate Assessment for 1999. Bull. Amer. Meteor. Soc, 1999; 81. PAGES?
CrossRef - Yu J. Y, Chou C, Chiu P. G. A revised Accumulated Cyclone Energy Index. Geophysical Research Letters, 36. PAGES?
CrossRef - Davis K, Zeng X. Seasonal Prediction of North Atlantic Accumulated Cyclone Energy and Major Hurricane Activity. Weather and Forecasting, 2019; 34: 221-32.
CrossRef - Camargo S. J, Sobel A. H. Western North Pacific Tropical Cyclone Intensity. Journal of Climate, 2005; 18:2996-3006.
CrossRef - Evan A. T, Camargo S. J. A Climatology of Arabian Sea Cyclonic Storms. Journal of Climate, 24: 140-158.
CrossRef - Alam M. M, Hossain M. A, Shafee S. Frequency of Bay of Bengal Cyclonic Storms and Depressions Crossing Different Coastal Zones. International Journal of Climatology, 2003; 23:1119-1125.
CrossRef - Subbaramayya I, Rao S. R. M. Frequency of Bay Of Bengal Cyclones in the Post-Monsoon Season”, Monthly Weather Review, 1984; 112:1640-1642.
CrossRef - Kothari C. R. Research Methodology. Second Edition. New Delhi: New Age International Publishers: 2004. ISBN? PAGES?
- Sugi M. and others. A reduction in Global Tropical Cyclone Frequency due to Global Warming. SOLA, 2009; 5:164-167.
CrossRef - Korty R. L. and others. Tropical cyclones Downscaled from Simulations with Very high Carbon Dioxide levels. Journal of Climate, 2017; 30: 649-667.
CrossRef - Bengtsson L. and others. How may Tropical Cyclones Change in a Warmer Climate? Tellus, 2007; 59A: 539-561.
CrossRef - Wehner M. F. and others. Changes in Tropical cyclones under Stabilize 1.5 and 2.0°C Global Warming Scenarios as Simulated by the Community Atmospheric model under the HAPPO Protocols. Earth System Dynamics, 2018; 9: 187-195.
CrossRef - Bengsson L, Botzet M, Esch M. will greenhouse Gas-Induced warming over the Next 50 Years Lea to Higher Frequency and Greater Intensity of Hurricanes. Tellus, 1996; 48A: 57-73.
CrossRef - Knuston T. R. and others. Impact of CO2 Induced Warming on Hurricane Intensities as Simulated in a hurricane Model with Ocean Coupling. Journal of climate, 2001;14: 2458-2468.
CrossRef - Knuston T. R, Tuleya R. R. Impact of CO2 Induced Warming on Simulated Hurricane Intensity and Precipitation: Sensitivity to the Choice of Climate Model and Convective Parameterization. Journal of Climate, 2004; 17(18): 3477-3495.
CrossRef - Yu J, Wang Y. Response of Tropical cyclone Potential Intensity to a Global arming scenario in the IPCC AR4 CGCMs. Journal of Climate, 2010; 23: 1354-1373.
CrossRef


