Spatiotemporal Pattern Assessment of Precipitation for the Wainganga Sub-Basin
Aradhana Thakur1,2
*
 , Prabhash Kumar Mishra2
, A K Nema1
and Souranshu Prasad Sahoo1
, Prabhash Kumar Mishra2
, A K Nema1
and Souranshu Prasad Sahoo1
1
National Institute of Hydrology,
Roorkee,
Uttarakhand,
India
http://dx.doi.org/10.12944/CWE.15.3.15
Copy the following to cite this article:
Thakur A, Mishra P. K, Nema A. K, Sahoo S. P. Spatiotemporal Pattern Assessment of Precipitation for the Wainganga Sub-Basin. Curr World Environ 2020;15(3). DOI:http://dx.doi.org/10.12944/CWE.15.3.15
Copy the following to cite this URL:
Thakur A, Mishra P. K, Nema A. K, Sahoo S. P. Spatiotemporal Pattern Assessment of Precipitation for the Wainganga Sub-Basin. Curr World Environ 2020;15(3). Available From: https://bit.ly/3fVGj99
Download article (pdf) Citation Manager Publish History

Introduction
Fluctuations in the occurrence of superfluous weather and climate phenomena can have an unfortunate effect on the local weather situation and are responsible for an unreasonably large stint of climate-related risk.1 The fluctuations are primarily expressed in terms of changes in the environment, economy, water resources, agricultural activities, industrial production, and human lives. Rainfall is considered as a leading meteorological variable that has a direct relationship with water availability and affects the water availability of a region. The variation in precipitation causes situations like drought, flood, low agriculture productivity, and loss in biodiversity, which can be overcome by planning and applying prevention measures based on the assessment of long term precipitation patterns. A time-series analysis of rainfall and temperature enables the water resources manager to foresee the probable consequences of these climatic variables, which will ultimately support in timely preparedness to cope with the adverse effect. In many river basins of India, expecting a reduction in the availability of freshwater because of climate change.2 Many researchers had assessed the past decade's precipitation variation and analyzed the trend of rainfall amount and the number of rainy days over the river basins of India.3 They found that out of 22 basins, 16 basins followed downward trends of monsoon rainfall, and 15 basins followed the annual rainfall, however in both time series, yearly and monsoon 15 basins showing the number of rainy days is decreasing. Some researchers studied the extreme precipitation events and zero rainfall events and observed that both events following an increasing trend.4, 5 Researchers studied the behavior of climatic variables at district 6 or basin 7 or watershed level 8 or station level 9, on seasonal, monthly or annual scale.9,10 The temporal and spatial variation in a hydro-meteorological variable like precipitation affects water resource availability and livelihood. For the WSB, the trend for 112 years (1901 -2012) have been analyzed and found an upward trend of precipitation for 1901 to 1948, while for the remaining period, i.e., 1949-2012, there was a downward trend. 11
To analyze the temporal trend of climatic variables, in general, the non-parametric MK test 12 and Sen's slope estimator 13 are adopted. However, to visually interpret the spatial variation in precipitation patterns, GIS software is needed. 14,15 It is a common practice to consider long-term historical data of 30-35 years to analyze the temporal pattern of climatic variables. In the present paper, the precipitation trend has been inquired for the WSB.
Materials and Methods
Study Area
The Wainganga sub-basin (WSB) is existing between 19°60′ to 22°07′ N and 78°00′ to 81°00′ E. The elevation of the sub-basin varies from 146 to 1048 m above the MSL (Figure 1). The basin contributes the water through 567 km long stream, from an area of 51758.65 km2. The average precipitation in the basin is fluctuating spatially as well as temporally. In the eastern part of the sub-basin, rainfall varies from 1400 mm to 1600 mm while for the western region, 900 to 1200 mm.
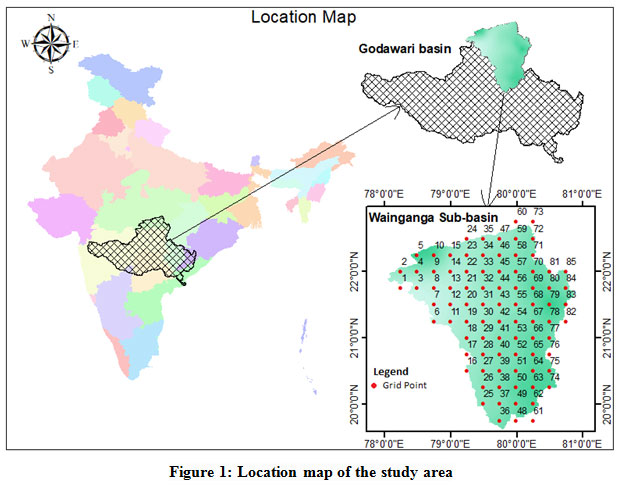 |
Figure 1: Location map of the study area |
In the present study, temporal alteration in precipitation (1951 to 2015) were investigated by trend analysis using a non-parametric MK test, and the change in magnitude was detected by Sen's slope estimator.16, 17, 18, 19 Apart from investigating the time series, the change point analysis has also been performed in the study to detect the time when notable change witnessed in the previous. A long term series may not accurately depict the changes occurring in the last one or two decades due to speedy economic expansion. Consequently, change point analysis is done to assess the rise or fall in the trend in the recent past. For this, tests like Pettitt's test, Standard Normal Homogeneity Test (SNHT), and Buishand's test was used to detect changing points.20 The spatial variation was recognized by Inverse Distance Weighting (IDW) approach in the ArcGIS environment.21
The methods used to fulfill the aim of the study are the following:
- Mann–Kendall (MK) test was used to examine the monthly, annual, and seasonal precipitation trend. 12, 22
- The magnitude of a trend was calculated by Theil and Sen׳s slope estimator test.13
- Homogeneity/ Similarity in the yearly/annual series was verified by the Pettitt׳s test 23, SNHT test 24, and the Buishand׳s test 25.
- To examine the spatial dispersal of AAP and Seasonal, precipitation of each grid point was interpolated by ArcGIS based on the value of each grid. An IDW method is utilized in the present study.26 The study area covers 85 grid points of precipitation.
In this section, long term historical data of precipitation were analyzed for trend using the MK test and Sen's slope estimator for three different time series viz. entire series, series before breakpoint, and after the breakpoint. Homogeneity tests observed shift points for seasonal precipitation in addition to AAP. The grid wise spatial unevenness of AAP and seasonal rainfall was plotted in ArcGIS software using the IDW method.
Entire-time series
Statistical analysis of precipitation indicates significant variation in August, where precipitation decreased by 70.6mm although the amount increased in June, i.e., 34.58 mm. From the investigation, it was concluded that the monthly rainfall for April and August is showing a significant negative trend with Zc statistics values -1.77 and -1.74, respectively, at a 10% level of significance. However, the rate of change in the precipitation magnitude is 0.07 mm and 1.09 mm, respectively, as per the Sen's slope estimator. The precipitation showed a non-significant positive trend in February, July, and November, while for March, May, October, and December reflects a negative trend. From the seasonal analysis of rainfall, the maximum decline has been found in the monsoon season, which is 78.9 mm over 65 years. In pre-monsoon and post-monsoon seasons, precipitation dropping insignificantly with -1.33 and -0.22 respectively Zc values (Table-1), which is the same as the previous findings for the WSB.11 For the winter season, a positive trend was observed. AAP reveals a negative non-significant trend with -0.79 Zc value and a 6.69 mm variation in rainfall (Table-1). Overall the rainfall in the WSB is declining although insignificantly, particularly during monsoon.
Table 1: Statistics of precipitation for the entire time series (1951-2015)
|
Time series |
Test Z |
Significance |
Q |
|
January |
-0.40 |
|
-0.005 |
|
February |
0.76 |
|
0.037 |
|
March |
-0.58 |
|
-0.021 |
|
April |
-1.77 |
+ |
-0.070 |
|
May |
-0.31 |
|
-0.013 |
|
Jun |
1.06 |
|
0.532 |
|
Jul |
0.29 |
|
0.280 |
|
Aug |
-1.74 |
+ |
-1.086 |
|
Sep |
-1.06 |
|
-0.702 |
|
Oct |
-0.23 |
|
-0.029 |
|
Nov |
1.38 |
|
0.008 |
|
Dec |
-0.03 |
|
0.000 |
|
Monsoon |
-0.76 |
|
-1.229 |
|
Pre-monsoon |
-1.33 |
|
-0.179 |
|
Post-monsoon |
-0.22 |
|
-0.063 |
|
Winter |
0.01 |
|
0.005 |
|
Average annual |
-0.79 |
|
-0.103 |
Homogeneity test (Change/ Shift point detection)
Before examining the pattern with time, the homogeneity of the precipitation series was reviewed to identify the years when a significant change took place. These tests examined the entire series and determined if a series is uniform with time, or if there is a time at which an alteration happens.
The shift detection analysis detected the changes for monsoon precipitation in the early part of the sixties (1961) (Figure-2). In winter, it shifted during the late nineties (1998), although for pre-monsoon and post-monsoon season shift points were found near the seventies (1971, 1970). The AAP shifted in the early part of the sixties (1961) (Table-2). Although all three tests indicated the change year varies for different time series, it can be concluded that the early sixties were the periods (1961) when the precipitation took a considerable change in the Wainganga basin.
Table 2: Results of Homogeneity test
|
Precipitation |
Pettitt's test |
SNHT test |
Buishand's test |
|||||||
|
K |
t |
p |
T0 |
t |
p |
Q |
t |
p |
||
|
|
Pre-Monsoon |
437 |
1971 |
0.043 |
10.99 |
2014 |
0.043 |
9.688 |
1971 |
0.073 |
|
|
Monsoon |
224 |
1970 |
0.917 |
3.589 |
1961 |
0.55 |
5.77 |
1961 |
0.58 |
|
|
Post-Monsoon |
201 |
1970 |
0.646 |
1.990 |
1970 |
0.893 |
5.291 |
1970 |
0.697 |
|
|
Winter |
242 |
1998 |
0.906 |
3.071 |
2005 |
0.644 |
5.530 |
1998 |
0.633 |
|
|
Average annual |
218 |
1961 |
0.86 |
3.565 |
1961 |
0.566 |
5.752 |
1961 |
0.582 |
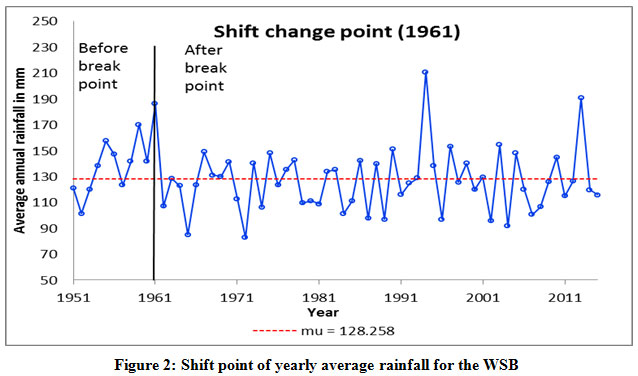 |
Figure 2: Shift point of yearly average rainfall for the WSB Click here to view figure |
Before the breakpoint (1951-61)
Before shifting in the precipitation pattern, the AAP series (1951-61) exhibited a significant upward trend with the changing precipitation of 6.07 mm/year. The time series from 1951 to 2015 demonstrated an insignificant rising trend (Figure-2). Seasonal analysis for this period displayed a noteworthy upward trend for monsoon and winter, while pre-monsoon and post-monsoon showed a negligible trend during these 11years (Table-3).
Table 3: Statistics of precipitation before breakpoint and after the breakpoint
|
Time series |
Before breakpoint (1951-61) |
After breakpoint (1962-2015) |
||||
|
Test Z |
Signific. |
Q |
Test Z |
Signific. |
Q |
|
|
Jan |
1.40 |
|
1.629 |
0.04 |
|
0.000 |
|
Feb |
-0.47 |
|
-0.275 |
-0.02 |
|
-0.001 |
|
Mar |
-0.31 |
|
-0.321 |
-0.26 |
|
-0.010 |
|
Apr |
-0.62 |
|
-0.488 |
-0.28 |
|
-0.010 |
|
May |
0.78 |
|
0.806 |
-0.19 |
|
-0.013 |
|
Jun |
0.62 |
|
6.522 |
0.63 |
|
0.468 |
|
Jul |
2.02 |
* |
27.244 |
1.46 |
|
2.232 |
|
Aug |
0.16 |
|
3.505 |
-1.13 |
|
-0.912 |
|
Sep |
1.25 |
|
22.717 |
-0.09 |
|
-0.075 |
|
Oct |
0.93 |
|
4.619 |
0.90 |
|
0.230 |
|
Nov |
1.65 |
+ |
0.048 |
0.33 |
|
0.002 |
|
Dec |
1.15 |
|
0.057 |
-1.20 |
|
-0.003 |
|
Monsoon |
1.87 |
+ |
62.161 |
0.45 |
|
0.629 |
|
Pre-monsoon |
0.00 |
|
0.097 |
-0.37 |
|
-0.090 |
|
Post-monsoon |
0.93 |
|
4.966 |
0.21 |
|
0.087 |
|
Winter |
2.34 |
* |
2.206 |
-1.16 |
|
-0.247 |
|
Average annual |
2.34 |
* |
6.067 |
0.34 |
|
0.085 |
After the breakpoint (1962-2015)
After the breakpoint, the annual and seasonal analysis of precipitation series reflected non-significant changes in precipitation during the years 1962-2015. The AAP, monsoon, and post-monsoon precipitation series showed an increase in rainfall with 0.08, 0.63, and 0.09 mm/year, respectively. In contrast, pre-monsoon and winter precipitation followed the downward trend with Sen's slope 0.09 and 0.25 (Figure-2).
Spatial variation (1951-2015)
Here, in addition to annual mean precipitation variation, seasonal precipitation variation concerning space was analyzed using the IDW method in the ArcGIS environment. The AAP varies from 956.56 mm of grid 6 (western part) to 1637.01mm of grid 79 (eastern part) in the study area.
Pre-monsoon
Spatial variations of pre-monsoon precipitation were investigated using the z-statistics value of each grid point, which has been analyzed by the MK test. The z-statistics varies from -3.5 of grid 13(western part) to 3.24 of grid 85 (eastern region) (Table-4), which showed the significantly increasing precipitation trend in the eastern part as well as in the southern part might be because of good forest density while significantly decreasing precipitation trend in the western side of the study area. The middle part reflected the little changes in precipitation patterns (Figure-3).
Table 4: Spatial Z-statistics for all-time series
|
Grid Code |
Monsoon |
Pre-Monsoon |
Post-Monsoon |
Winter |
Average Annual |
Grid Code |
Monsoon |
Pre-Monsoon |
Post-Monsoon |
Winter |
Average Annual |
|
1 |
0.88 |
-1.12 |
-0.53 |
0.4 |
0.71 |
44 |
0.04 |
-0.4 |
0.01 |
-0.61 |
0.08 |
|
2 |
1.65 |
-1.52 |
-0.71 |
-0.07 |
1.43 |
45 |
-1.51 |
0.84 |
0.69 |
0.39 |
-1.19 |
|
3 |
0.13 |
-2.03 |
-0.36 |
-0.28 |
-0.24 |
46 |
-1.89 |
-0.58 |
0.38 |
0.2 |
-1.67 |
|
4 |
-1.18 |
-2.54 |
-0.74 |
-1.08 |
-1.43 |
47 |
0.04 |
-1.5 |
-0.83 |
-0.93 |
-0.16 |
|
5 |
-2.09 |
-2.44 |
-0.9 |
-1.15 |
-2.19 |
48 |
-1.06 |
-0.2 |
0.35 |
1.17 |
-0.75 |
|
6 |
0.16 |
-2.39 |
-0.12 |
-0.69 |
-0.32 |
49 |
-1.23 |
1.02 |
0.88 |
1.62 |
-0.77 |
|
7 |
-0.65 |
-3.18 |
0.68 |
-0.9 |
-0.85 |
50 |
-0.79 |
0.45 |
0.36 |
0.4 |
-0.29 |
|
8 |
-1.12 |
-3.43 |
0.11 |
-1.14 |
-1.57 |
51 |
-0.53 |
-0.59 |
-0.7 |
-0.18 |
-0.33 |
|
9 |
-1.57 |
-2.76 |
-0.42 |
-0.19 |
-2.02 |
52 |
-1.89 |
-0.77 |
-0.89 |
-0.67 |
-2.31 |
|
10 |
-1.42 |
-2.17 |
-0.67 |
-0.49 |
-1.59 |
53 |
-1.5 |
-0.4 |
-0.82 |
-0.08 |
-1.92 |
|
11 |
0.78 |
-0.69 |
0.55 |
-0.03 |
0.49 |
54 |
-0.46 |
-0.56 |
-0.23 |
0.11 |
-1.04 |
|
12 |
0.08 |
-1.4 |
0.32 |
-0.36 |
-0.27 |
55 |
-0.32 |
-0.39 |
-0.18 |
-0.23 |
-0.65 |
|
13 |
-0.41 |
-3.5 |
-0.15 |
-1.25 |
-0.92 |
56 |
-1.29 |
-1.05 |
-0.12 |
-1.03 |
-1.52 |
|
14 |
-1.18 |
-1.66 |
-0.92 |
0.32 |
-1.34 |
57 |
-1.37 |
-1.47 |
0.64 |
-0.28 |
-1.32 |
|
15 |
-0.22 |
-1.9 |
-0.65 |
0 |
-0.14 |
58 |
-3.03 |
-2.27 |
-0.01 |
-1.12 |
-3.07 |
|
16 |
2.41 |
-1.7 |
-0.66 |
-1.79 |
1.59 |
59 |
-2.28 |
-2.52 |
-0.52 |
-1.58 |
-2.37 |
|
17 |
-1.73 |
-0.97 |
-0.4 |
-0.68 |
-1.81 |
60 |
-1.45 |
-2.08 |
-0.19 |
-1.73 |
-1.74 |
|
18 |
0.15 |
-0.16 |
-0.23 |
0.18 |
-0.05 |
61 |
0 |
-0.37 |
0.27 |
0.27 |
0.17 |
|
19 |
0.23 |
-1.51 |
-0.23 |
-0.59 |
-0.6 |
62 |
-0.08 |
-0.27 |
0.15 |
0.94 |
-0.19 |
|
20 |
0.88 |
-1.29 |
-0.22 |
-0.78 |
0.28 |
63 |
0.29 |
-0.35 |
-0.12 |
0.45 |
0.02 |
|
21 |
-0.08 |
-2.64 |
-0.96 |
-0.94 |
-0.53 |
64 |
0.31 |
-1.39 |
-0.31 |
-0.07 |
0.19 |
|
22 |
0.18 |
-2.46 |
-1.08 |
-0.42 |
-0.17 |
65 |
0.14 |
-0.85 |
-0.27 |
-0.71 |
-0.26 |
|
23 |
1.54 |
-1.94 |
-0.57 |
-0.25 |
1.59 |
66 |
-1.77 |
-0.14 |
-0.14 |
0.31 |
-1.43 |
|
24 |
-0.05 |
-1.9 |
-0.69 |
-0.79 |
-0.36 |
67 |
-0.05 |
-0.79 |
-0.58 |
0.02 |
-0.22 |
|
25 |
-0.49 |
1.47 |
0.9 |
0.9 |
-0.11 |
68 |
-0.65 |
-0.85 |
-0.84 |
-0.61 |
-1.12 |
|
26 |
-1.79 |
-1.62 |
0.07 |
-0.92 |
-1.65 |
69 |
-0.96 |
-0.23 |
0.53 |
-0.54 |
-1.03 |
|
27 |
-2.18 |
-2.38 |
-1.1 |
-1.63 |
-2.19 |
70 |
-1.95 |
-2.09 |
0.53 |
-0.43 |
-2.2 |
|
28 |
-0.24 |
-0.01 |
-0.2 |
0.37 |
-0.23 |
71 |
-1.99 |
-1.54 |
0.07 |
-0.37 |
-2.02 |
|
29 |
-1.17 |
-1.73 |
-0.78 |
-1.08 |
-1.68 |
72 |
-1.64 |
-1.59 |
-0.49 |
-1.28 |
-2.39 |
|
30 |
-0.75 |
-1.66 |
-0.31 |
-0.88 |
-1.7 |
73 |
-1.47 |
-0.52 |
0.31 |
-0.73 |
-1.27 |
|
31 |
0.08 |
-0.86 |
-0.52 |
-0.58 |
-0.29 |
74 |
-0.05 |
-0.91 |
-0.47 |
0.14 |
-0.03 |
|
32 |
-0.24 |
-0.01 |
-0.2 |
0.37 |
-0.22 |
75 |
-0.25 |
-1.02 |
-0.27 |
-0.09 |
-0.08 |
|
33 |
-1.04 |
-0.33 |
-0.07 |
0.52 |
-0.64 |
76 |
-0.97 |
-1.18 |
-0.46 |
-0.42 |
-1.19 |
|
34 |
-0.37 |
-0.59 |
-0.25 |
0.2 |
0.15 |
77 |
-1.69 |
-0.2 |
-0.69 |
0.49 |
-1.82 |
|
35 |
0.56 |
-0.86 |
-0.58 |
-0.4 |
0.52 |
78 |
-1.25 |
-1.08 |
-0.85 |
0.06 |
-1.09 |
|
36 |
-0.73 |
-0.35 |
0.22 |
1.64 |
-0.45 |
79 |
-0.55 |
-1.67 |
-0.66 |
-1.24 |
-0.82 |
|
37 |
-0.27 |
-1.64 |
0.61 |
1 |
0.18 |
80 |
-1.62 |
1.12 |
0.5 |
0.02 |
-1.46 |
|
38 |
-1.83 |
-2.04 |
-0.31 |
-0.9 |
-1.89 |
81 |
-2.53 |
0.55 |
0.2 |
0.01 |
-2.26 |
|
39 |
-1.1 |
0.34 |
-0.85 |
0.09 |
-1.26 |
82 |
0.57 |
-1.09 |
-0.67 |
0.3 |
0.03 |
|
40 |
-1.16 |
-0.96 |
-0.57 |
-0.44 |
-1.64 |
83 |
-0.08 |
-1.44 |
-0.85 |
-0.53 |
-0.4 |
|
41 |
-1.05 |
-0.33 |
-0.52 |
-0.22 |
-1.22 |
84 |
-0.63 |
1.81 |
0.5 |
0.54 |
-0.05 |
|
42 |
-0.91 |
-1.08 |
-0.35 |
-0.27 |
-1.26 |
85 |
-1.98 |
3.24 |
0.99 |
0.67 |
-1.36 |
|
43 |
1.23 |
-0.57 |
-0.22 |
0.22 |
0.8 |
|
|
|
|
|
|
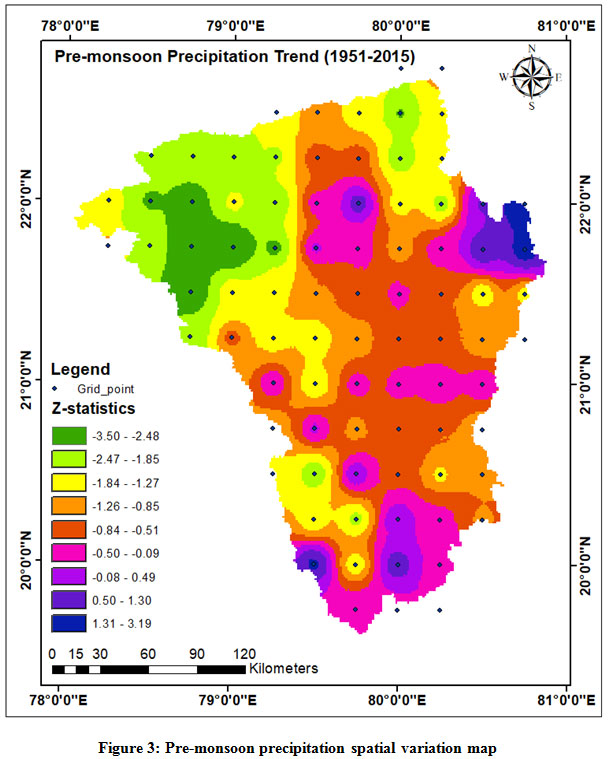 |
Figure 3: Pre-monsoon precipitation spatial variation map Click here to view figure |
Monsoon
The N-W part of the basin marked the most positive trend during monsoon season while in N-E part marked the most negative trend. The z-statistics values fluctuated between -3.03 (grid-58) to 2.41 (grid-16), where mostly all grid points showed a downward trend in precipitation (Figure-4) (Table-4).
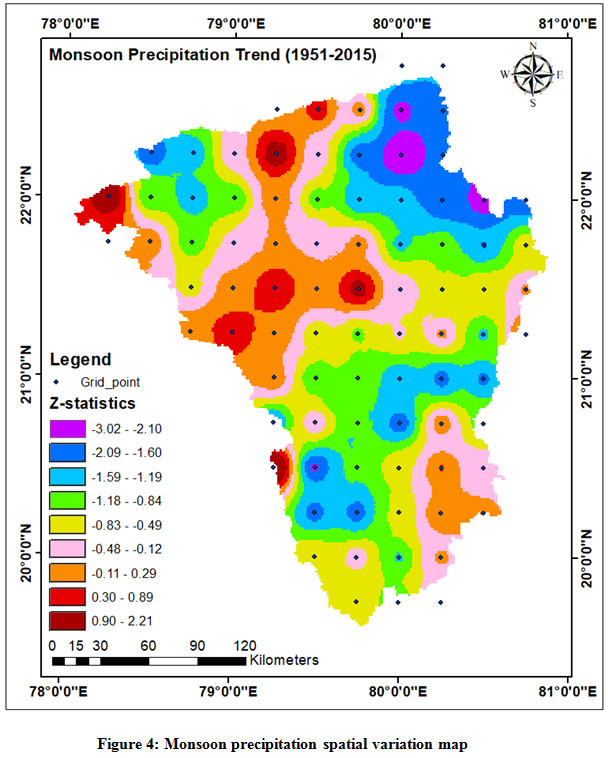 |
Figure 4: Monsoon precipitation spatial variation map Click here to view figure |
Post-monsoon
For post-monsoon season z-statistics ranges from -1.1 (grid-27) to 0.99 (grid-85) (Table-4). Results showed that the N-E part, the western part, and southern part of the basin followed an upward trend while S-E, S-W, and N-W parts followed a downward trend (Figure-5).
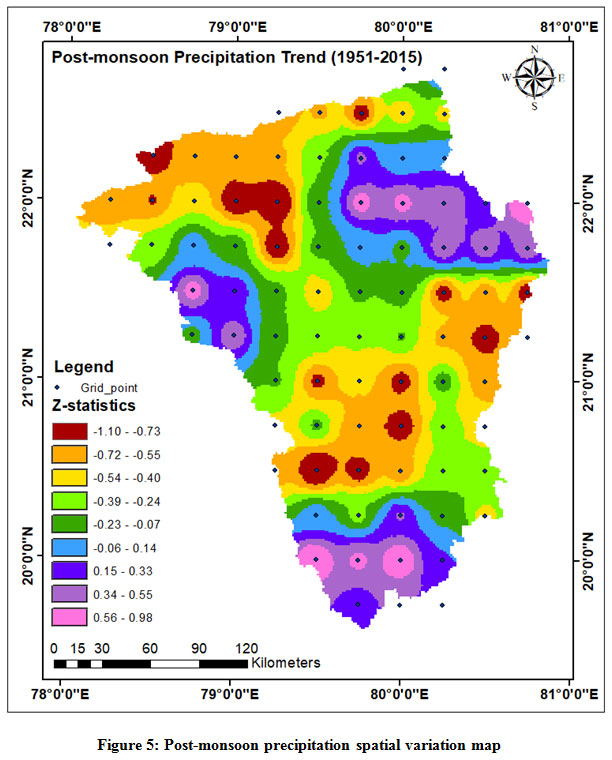 |
Figure 5: Post-monsoon precipitation spatial variation map Click here to view figure |
Winter
The trend was evaluated by the MK test for each grid point showed the variation in z-statistics from -1.79 to 1.64. It was noticed that the winter precipitation pattern showed a significantly increasing trend in the downstream side, i.e., in the southern part. In contrast, in the rest area, it showed a notable downward trend. In the study area, out of 85 grid points, only 22 points were showing a positive trend in the winter precipitation series. (Figure-6) (Table-4).
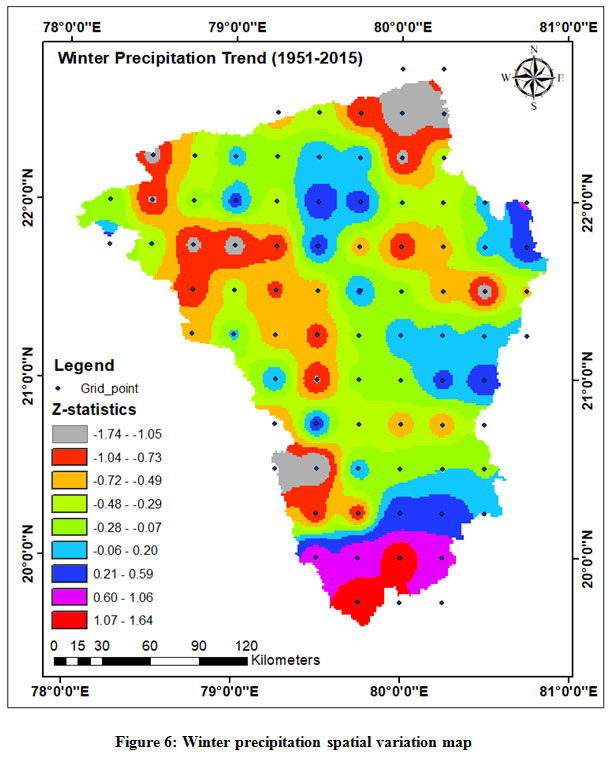 |
Figure 6: Winter precipitation spatial variation map Click here to view figure |
Average Annual
Z-statistics for AAP varies from -3.07 (grid 58) to 1.59 (grid-16), which followed the same pattern as that of monsoon precipitation trend. Approximately 50% of the N-W part of the WSB exhibits a positive trend, whereas the remaining area follows the negative trend but not much significantly (Figure-7). Mostly grids in the N-E and S-E part of the WSB follow the negative trend.
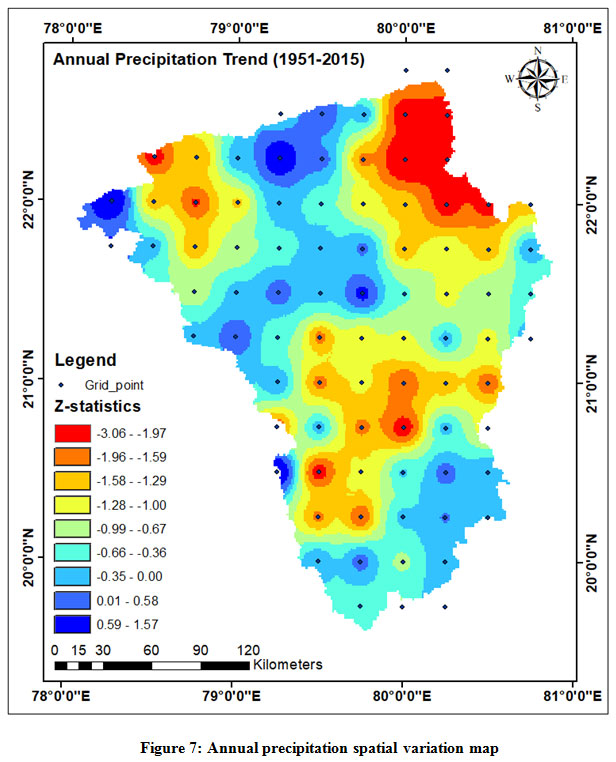 |
Figure 7: Annual precipitation spatial variation map Click here to view figure |
The study reveals that the grid points 58 and 59 covering the Mandla district, Madhya Pradesh are most vulnerable to climate change, where precipitation is following a downward trend seasonally as well as annually due to a rising temperature, which may be probably due to expanding urban and industrial activities, a shift in global climate and deforestation.15,27 The findings observed by few researchers, also corroborated the same. 11,28
Conclusions
In the present study, spatiotemporal precipitation variation on different time series was explored for the WSB using 65 years (1951-2015). Further, based on the homogeneity test, the time series was split into three parts viz. entire time series, before and after shift point to investigate trend using MK tests and Sen's slope estimator test.
Here, we found that during the monsoon season, particularly in June and July, precipitation showed a non-significant positive trend, while in August, it showed a significant negative trend along with a higher negative trend slope (i.e., -1.09). In September, it showed a non-significant negative trend. In comparison, the overall precipitation trend for the monsoon season is non-significantly negative. The study indicated that the temporal variability of precipitation during the monsoon season is becoming non-uniform, which is a terrible condition for rainfed kharif crops. Therefore, it is recommended to adopt some water harvesting measures in the WSB for better water resource utilization within it. Nature-based climate solutions like reforestation and appropriate land management practices play a vital role in confronting climate change. Therefore, reforestation practices that have a higher potential to mitigate the adverse impacts of climate change, followed by adopting advanced forest management practices, will serve as longterm cost-effective practice for the global community.
References
- Jiang, F. Q., Hu, R. J., Wang, S. P., Zhang, Y. W., & Tong, L. Trends of precipitation extremes during 1960–2008 in Xinjiang, Northwest China. Theor Appl Climatol. 2013;111(1-2), 133-148.https://doi.org/10.1007/s00704-012-0657-3.
CrossRef - Gosain, A. K., Sandhya Rao, and Debajit Basuray. "Climate change impact assessment on hydrology of Indian river basins." Curr. Sci.. 2006; 346-353.DOI: 10.2307/24091868.
- Kumar, V., & Jain, S. K. Trends in rainfall amount and number of rainy days in river basins of India (1951–2004). Hydrol. Res.2011;42(4), 290-306. https://doi.org/10.1016/j.atmosres.2015.08.018.
CrossRef - Deshpande NR, Kothawale DR, Kulkarni A. Changes in climate extremes over major river basins of India. International Journal of Climatology. 2016 ;36(14) : 4548-59. https://doi.org/10.1002/joc.4651.
CrossRef - Bhatti, Asher Samuel, Guojie Wang, Waheed Ullah, Safi Ullah, Daniel Fiifi Tawia Hagan, Isaac Kwesi Nooni, Dan Lou, and Irfan Ullah. "Trend in Extreme Precipitation Indices Based on Long Term In Situ Precipitation Records over Pakistan. Water .2020; 12(3) 797. https://doi.org/10.3390/w12030797.
CrossRef - Pal, S., Mazumdar, D., & Chakraborty, P. K. District-wise trend analysis of rainfall pattern in the last century (1901-2000) over the Gangetic region in West Bengal, India. ANSF. 2015;7(2), 750-757. DOI: 10.31018/jans.v7i2.678.
CrossRef - Bera, S. Trend Analysis of Rainfall in Ganga Basin, India from1901-2000. Am. J. Clim. Change. 2017; 6(01), 116. https://doi.org/10.4236/ajcc.2017.61007.
CrossRef - Burn, D. H., Sharif, M., & Zhang, K. Detection of trends in hydrological extremes for Canadian watersheds. Hydrol. Process. 2010;24(13), 1781-1790. https://doi.org/10.1002/hyp.7625.
CrossRef - Sayemuzzaman, M., & Jha, M. K. Seasonal, and annual precipitation time series trend analysis in North Carolina, United States. Atmos. Res.2014;137, 183-194. https://doi.org/10.1016/j.atmosres.2013.10.012.
CrossRef - Jain, S. K., & Kumar, V. Trend analysis of rainfall and temperature data for India. Curr. Sci. 2012;102(1), 37-49. DOI: 10.2307/24080385
- Taxak, A. K., Murumkar, A. R., & Arya, D. S. Long term spatial and temporal rainfall trends and homogeneity analysis in Wainganga basin, Central India. Weather Clim. Extremes. 2014;4, 50-61. http://dx.doi.org/10.1016/j.wace.2014.04.005.
CrossRef - Mann, H. B. Nonparametric tests against trend. Econometrica. 1945; 13:245-259.
CrossRef - Sen, P. K. Estimates of the regression coefficient based on Kendall's tau. J. Am. Stat. Assoc.1968;63(324), 1379-1389. DOI: 10.1080/01621459.1968.10480934.
CrossRef - Adarsh, S., & Janga Reddy, M. Trend analysis of rainfall in four meteorological subdivisions of southern India using non-parametric methods and discrete wavelet transforms. Int. J. Climatol. 2015; 35(6), 1107-1124. https://doi.org/10.1002/joc.4042.
CrossRef - Thakur, A., Mishra, P. K., Nema, A. K., & Sahoo, S. P.. Spatio-temporal trends and shift analysis of temperature for Wainganga sub-basin, India. Int J Environ stud. 2019; 77(3), 464-479. https://doi.org/10.1080/00207233.2019.1686884.
CrossRef - Chattopadhyay, S., & Edwards, D. Long-term trend analysis of precipitation and air temperature for Kentucky, United States. Climate. 2016;4(1), 10. https://doi.org/10.3390/cli4010010.
CrossRef - Cui, Lifang, et al. "Innovative trend analysis of annual and seasonal air temperature and rainfall in the Yangtze River Basin, China during 1960–2015. JASTP. 2017; 48-59.https://doi.org/10.1016/j.jastp.2017.08.00.
CrossRef - Meshram, S. G., Singh, V. P., & Meshram, C. Long-term trend and variability of precipitation in Chhattisgarh State, India. Theor Appl Climatol. 2017;129(3-4), 729-744. DOI: 10.1007/s00704-016-1804-z.
CrossRef - Xu, Y., Xiaohou, S., Xinyu, M., Minhui, L., Xiuneng, L., & Rongqi, L. Variability and trend analysis of precipitation during 1961-2015 in Southwest Guizhou Autonomous Prefecture (SGAP), China. J.Agrometeorol..2019; 21(1), 31-35.
- Jaiswal, R. K., A. K. Lohani, and H. L. Tiwari. "Statistical analysis for change detection and trend assessment in climatological parameters." Environ. Process. 2015; 2(4) 729-749. https://doi.org/10.1007/s40710-015-0105-3.
CrossRef - Childs, C. Interpolating surfaces in ArcGIS spatial analyst. ArcUser.2004; July-September, 3235, 569.
- Kendall MG (1975). Rank Correlation Methods, 4th edition. Charles Griffin, London, U.K.
- Pettitt, A. N. A non-parametric approach to the changeâ€point problem. J. R. Stat. Soc.: Series C (Applied Statistics). 1979; 28(2), 126-135.DOI: 10.2307/2346729.
CrossRef - Alexandersson, H. A homogeneity test applied to precipitation data. J. Climatol. 1986; 6(6), 661-675.https://doi.org/10.1002/joc.3370060607.
CrossRef - Buishand, T. A. Some methods for testing the homogeneity of rainfall records. J.Hydrol., 1982;58(1-2), 11-27. https://doi.org/10.1016/0022-1694(82)90066-X.
CrossRef - Pai, D. S., Sridhar, L., Rajeevan, M., Sreejith, O. P., Satbhai, N. S., & Mukhopadhyay, B. Development of a new high spatial resolution (0.25× 0.25) long period (1901–2010) daily gridded rainfall data set over India and its comparison with existing data sets over the region. Mausam.2014;65(1), 1-18.
- Duhan D, Pandey A. Statistical analysis of long term spatial and temporal trends of precipitation during 1901–2002 at Madhya Pradesh, India. Atmospheric Research. 2013 ;122:136-49. https://doi.org/10.1016/j.atmosres.2012.10.010.
CrossRef - Sushant. Impact of Climate Change in Eastern Madhya Pradesh, India. Trop Conserv Sci. 2013; 6(3), 338-364. DOI:10.1177/194008291300600304.
CrossRef


