Study on Seasonal Variations and Spatial Distribution of Major Ions with Focus on Paper Industry Effluents - A Case study of Sirpur Paper Mills (SPM) Telangana
Harish Kumar Agre
*

1
School of Interdisciplinary Sciences,
Symbiosis Skills and Professional University,
Pune,
India
http://dx.doi.org/10.12944/CWE.15.3.05
The present paper examines the seasonal variations in groundwater quality (Pre-monsoon & Post- Monsoon) with an emphasis on paper industry effluents from the Sirpur-Kaghaznagar area. Spatial distribution of samples from 24 sites collected during pre and post-monsoon using surfer software gives an insight of important parameters such as pH, EC, TDS, BOD, COD, DO, Ca+, Mg2+, Na+, F, Cl-, NO3,- SO42- and TH to be significantly elevated beyond the acceptable and permissible levels prescribed by BIS limits. Also, the Physico-chemical analysis of paper mill effluent collected from 12 different sites revealed that parameters such as pH, EC, TDS, BOD, COD, Alkalinity, SO42-, Cu, and Fe were beyond the BIS permissible limits for effluent discharge and designated a profound negative impact on groundwater quality and lead us to conclude that the overall quality is deteriorated due to the influx of paper industry effluents.
Copy the following to cite this article:
Agre H. K. Study on Seasonal Variations and Spatial Distribution of Major Ions with Focus on Paper Industry Effluents - A Case study of Sirpur Paper Mills (SPM) Telangana. Curr World Environ 2020;15(3). DOI:http://dx.doi.org/10.12944/CWE.15.3.05
Copy the following to cite this URL:
Agre H. K. Study on Seasonal Variations and Spatial Distribution of Major Ions with Focus on Paper Industry Effluents - A Case study of Sirpur Paper Mills (SPM) Telangana. Curr World Environ 2020;15(3). Available From : https://bit.ly/37Wf3DW
Download article (pdf)
Citation Manager
Publish History

Introduction
Water is a prime resource, its effective use and management are considered very important for the future demands of the increasing population. The quality and quantity of water is of much value specifically in the rural areas. The quality of water is characterized by various physico-chemical parameters influenced by many natural and anthropogenic factors like weathering, sources of water, type of pollution, seasonal fluctuations, etc. causing a diverse change. A tremendous change and growth in the industrial sector that benefit mankind on one side and another side of the advancement, there is an ever increased concern on the burden of pollution load on each sphere of the environment. The altered environments may pose a great threat to the living organization in the world. Pulp and paper industry is considered as one of the major polluting industry which consumes large quantities of water for processing the pulp and paper. Nearly it consumes about 250-300 m3 of water per ton of paper produced and the estimated production capacity soon will be huge. Both water and soil systems are at higher risk of contamination due to direct discharge of toxic effluents making the water and soil unsuitable for drinking and irrigation purposes. Also, people living in nearby surrounding areas are more prone to long term health hazards. So far there is no serious attempt and significant contributions were made by any investigator in this area to investigate the impact of paper mill effluent, uses a wide range of resources and contributes to maximum pollution load in the surrounding area. Considering the long term adverse effects of pulp and paper industry, the research work was begun to know the exact status of water quality due to the influence of paper mill effluents surrounding area of kaghaznagar, Telangana.
Study Area
Sirpur-Kaghaznagar located in the eastern Telangana being part of Adilabad district is a small town. It lies between 19.33330 N-79.48330 E (Fig-1) with an average elevation of the area is 174 meters (574 feet). The total study area is 59.6 sq. km. The district is bounded by Yeotmal and Chandrapur districts of Maharashtra, on the East by Chandrapur, on the South by Karimnagar and Nizamabad districts and the West by Nanded districts of Maharashtra. As per the 2011 census, the population of the Sirpur-Kaghaznagar area is 57,583. The study area receives water from Peddavagu River which is a tributary of Godavari. The types of soils in the study area are red loamy soils derived from country rocks and black cotton soils mainly derived from basaltic rocks. The climate in the region is usually hot and reach to a peak of 460 C during the summers. Usually the rainfall in kaghaznagar area ranges around 1094 mm, during that year it recorded a rainfall of 861.4 mm, geologically the area represents the Sullavai formation comprising grits, conglomerates, and sandstones of the Gondwana age. The sandstone, limestone, and shale of Penganga and sullavai formations belong to sedimentary origin but are mostly hard and compact due to which they perform like crystalline rocks and aquifers are formed due to weathering and fracturing. Water in the study area is usually found in shallow sub surface aquifers and deeper aquifers in the saturated zone. Water level difference observed during pre-monsoon was 0.22-31.25 m below the ground and post-monsoon recorded 0.3-17.15 m.
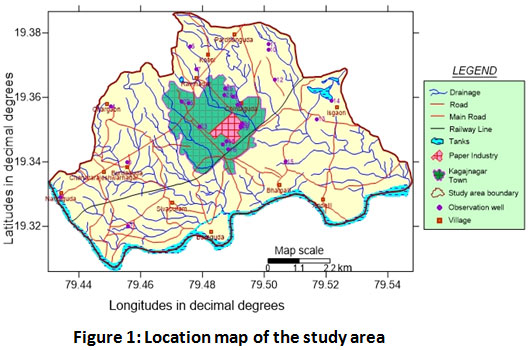 |
Figure 1: Location map of the study area Click here to view figure |
Materials and Methods
Groundwater samples were collected individually from water locations including boreholes and dug wells in acid cleaned high-density 1-liter linear polythene sampling bottles with strict adherence to the sampling protocols between 7 A.M to 9.A.M as described by American Public Health Association (APHA 2012). 24 water sampling stations were randomly fixed, covering an extended area of 59 km2 in the Sirpur-Kaghaznagar. Sampling was done twice in a month for a year i.e. during March 2011 (pre-monsoon) and February 2012 (post-monsoon). Samples collected underwent for analysis in the lab adhering to the guidelines prescribed. For effluent sampling 2.5 litre sized polythene bottles cleansed with hydrochloric acid were used, again washed with distilled water and then collected the effluent. Proper care was taken to seal the sample bottles with paraffin wax and were shifted to the laboratory with extreme care. The collected effluent samples were stored at - 40C to stop the chemical reactions and the samples were characterized for its chemical properties by adopting standard protocols.
Result and Discussion: (Effluent Characterization)
Temperature and pH
Temperature plays an important role in chemical reactions and increase the evaporation rate of wastewater making it unsuitable for beneficial uses such as irrigation (Metcalf and Eddy 2003). The temperature recorded ranged between 30 to 320C with a mean value of 31±1 depicted in (Table.1) for the year 2011-2012. pH: The Acidity and alkalinity of effluent depend upon various chemicals used in paper manufacturing. The pH of the raw effluent ranged from 8.1 to 8.9 with a mean value of 8.5 ± 0.4 for the year 2011-2012. Addition of caustic soda to obtain colour and bleaching agents in the pulping process is the reason for enhanced alkalinity (Table.1), further this alkaline compounds produce more number of hydroxyl ions after reaction and mount pH to make it more alkaline (Pooja Tripathi et al., 2013). Higher pH indicates salt accumulation due to effluent exposure (Saravana Sundaram et al., 2014). Electrical Conductivity & Total Dissolved Solids: The conductivity recorded values in the range of 2120 to 2280 µmhos/cm with arithmetic mean 2200 ± 80 for the year 2011-2012 which was beyond the BIS limits indicating accumulation of organic wastes and salts from paper industry (Table.1). The results of our samples matched with the studies of other researchers (Surabhi Yadav and Nidhi Yadav 2014 and Reddy et al., 2013). TDS of the raw effluent ranged from 980 to 1289 mg/L with an average value of 1134.5 ± 154.5 from (Table.1). High value of TDS could be due to solubilisation of maximum chloro-lignin compounds present in the effluent which would create problems and ailments in humans. The results confirmed with those studied by (Giri et al., 2014) which were found to be beyond the BIS limits.
BOD and COD
BOD and COD values of Paper mill effluent ranged between 150 to 188 mg/L and 1090 to1155 mg/L with a mean value of 169.0 ±19 and 1122.50 ± 32.50 (Table.1). It would be complex to exactly indicate the chemical composition of Paper mill effluent, however BOD and COD is high and contains lignin and its derivatives including chlorinated compounds, acetic acid, formic acid, sulphur compounds (Jukka et al., 1994). Paper industry uses significant amounts of organic material, specific chemical compounds implies excess pollution levels. Paper mill effluent with substantial BOD and low levels of oxygen content alter metabolism of most animals. (Sawyer CC and Mc Carty 1978) whereas high COD levels indicate the toxic state of wastewater along with the presence of biologically resistant organic substances. The results are in agreement with those of (Anju Bhatnagar 2015), wherein the values of BOD & COD were above permissible limits. Suspended Solids & Alkalinity: The number of suspended solids ranged from 180 to 225 mg/L with a mean value of 202.5 ± 22.5 for the year 2011-2012 in (Table.1). Alkalinity: The values of Alkalinity ranged between 252.0 to 485.0 mg/L with a mean value of 368.5 ± 116.5 for the year 2011-2012 (Table.1). Microbial activity degrades the organic matter and forms carbonate and bicarbonate in the water. Alkalinity does not show any harmful effect but the bicarbonates present in the wastewater can release fluoride from CaF2 present in the soils with precipitation of CaCO3- due to the high rate of evapotranspiration caused by semi-arid climate (Keshav Deshmukh, 2013).
Chlorides and Sulphates
Chloride content in the effluent varied from 302 to 325 mg/L with arithmetic mean 313.5 ± 11.5 for the year 2011-2012 as shown in (Table.1). In the study area significant primary source of chloride is the paper mill itself where an excess amount of chloride is used in the pulping process. However, chloride values were within the prescribed limits given by BIS for irrigation. Sulphate concentration in the effluent ranged between 1050 to 1075 mg/L with an average value of 1062.5 ± 12.5 for the year 2011-2012 in (Table.1) which is quite higher than the BIS limits for irrigation. Micronutrients & Heavy metals (Zn, Fe, Cu, Cd, Ni & Pb) in effluent: The Zinc concentrations in the study area for the year 2011-2102 ranged between 2.01 to 2.30 mg/L with an average of 2.15 ± 0.14, Pb concentrations ranged between 2.0 to 2.2 mg/L with a mean value of 2.1 ± 0.1, Ni values for both the seasons observed as 3.0 to 3.1 mg/L with a mean value of 3.05 ± 0.05, Cu values during the study period varied from 3.0 to 3.2 mg/L with an average value of 3.1 ± 0.1, Fe content in the raw effluent from paper mill recorded for the year 2011-2012 as 3.0 to 3.5 mg/L with a mean value of 3.25 ± 0.25 and Cd values ranged as 1.0 to 1.2 mg/L with an average value of 1.1 ± 0.1 for the year 2011-2012 from the Sirpur-Kaghaznagar town as depicted in (Table.1). The results indicated that the values of Cd, Cu and Fe were found higher than the prescribed limits of BIS standards for irrigation water which reflect the toxic nature of paper mill effluents. The Findings confirmed to those of (Kumar et al., 2015 and Tariq et al., 2006).
Table 1: Extent of similarity in paper mill effluent characteristics from Sirpur-Kaghaznagar Town.
|
S. No |
Parameter |
Min |
Max |
Mean ± St. Dev |
Max Permissible limit (BIS) |
|
1 |
Temperature |
30 |
32 |
31.0 ± 1.0 |
Shall not exceed 5oC |
|
2 |
pH |
8.1 |
8.9 |
8.50 ± 0.40 |
5.5-9.0 |
|
3 |
EC |
2120 |
2280 |
2200.0 ± 80.0 |
- |
|
4 |
COD |
1090 |
1155 |
1122.50 ± 32.50 |
250 |
|
5 |
BOD |
150 |
188 |
169.0 ± 19.0 |
30 |
|
6 |
TDS |
980 |
1289 |
1134.50 ± 154.50 |
- |
|
7 |
SS |
180 |
225 |
202.5 ± 22.50 |
- |
|
8 |
Alkalinity |
252 |
485 |
368.5 ± 116.50 |
- |
|
9 |
Chlorides (Cl-) |
302 |
325 |
313.5 ± 11.50 |
- |
|
10 |
Sulphates |
1050 |
1075 |
1062.50 ± 11.50 |
- |
|
11 |
Zinc (Zn) |
0.01 |
0.31 |
0.16 ± 0.15 |
5 |
|
12 |
Lead (Pb) |
0 |
0.002 |
0.001 ± 0.001 |
- |
|
13 |
Nickel (Ni) |
0.025 |
0.075 |
0.05 ± 0.025 |
3 |
|
14 |
Copper (Cu) |
0.032 |
0.099 |
0.065 ± 0.033 |
3 |
|
15 |
Iron (Fe) |
0.312 |
0.374 |
0.343 ± 0.031 |
3 |
|
16 |
Cadmium (Cd) |
0.025 |
0.1 |
0.062 ± 0.037 |
2 |
Note: Except pH & EC all values are in mg/L, Values are Mean ± SD of 12 sampling stations.
Table 2: Summary of physico-chemical composition of groundwater samples collected from the Sirpur-Kaghaznagar area
|
S. No |
Parameter |
Min |
Max |
Mean ± St. Dev |
Max Permissible limit (BIS) |
|
1 |
pH |
8.76 |
8.9 |
8.83 ± 0.07 |
6.5-8.5 |
|
2 |
EC |
2250 |
2280 |
2265.0 ± 15.0 |
2000 |
|
3 |
TDS |
1972 |
2005 |
1988.50 ± 16.50 |
2000 |
|
4 |
BOD |
4 |
8.32 |
6.16 ± 2.16 |
30 |
|
5 |
COD |
107 |
123.5 |
115.25 ± 8.25 |
250 |
|
6 |
DO |
3.3 |
6.71 |
5.00 ± 1.70 |
5 |
|
7 |
TH |
478 |
502 |
490.0 ± 12.0 |
600 |
|
8 |
Cl- |
690 |
710 |
700.0 ± 10.0 |
1000 |
|
9 |
Co3-2 |
274 |
295 |
284.50 ± 10.50 |
- |
|
10 |
HCo3- |
374 |
402 |
388.0 ± 14.0 |
- |
|
11 |
F |
0.14 |
4 |
2.06 ± 1.94 |
1.5 |
|
12 |
SO42- |
386 |
420 |
403.0 ± 17.0 |
400 |
|
13 |
NO3- |
52 |
81 |
66.50 ± 14.50 |
45 |
|
14 |
Ca2+ |
218 |
238 |
228.0 ± 10.0 |
200 |
|
15 |
Mg2+ |
132 |
153 |
142.5 ± 10.5 |
100 |
|
16 |
Na+ |
460 |
486 |
473.0 ± 13.0 |
- |
|
17 |
K+ |
47 |
66.29 |
56.64 ± 9.64 |
- |
Note: Excepting pH and EC all the values are in mg/L. All values are mean ± SD of 24 sampling stations.
Physico-Chemical Characterization of Groundwater
pH
The normal range of pH is 6.5 to 8.5 as per the WHO and IS standards. In the present study carried out on Sirpur-Kaghaznagar town of Adilabad district, Telangana has shown moderate fluctuation in pH from 8.76 to 8.9 with a mean value of 8.83 ± 0.07 (Table.2) for the year 2011-2012. pH values were observed to be less in post monsoon compared to values recorded in Pre monsoon season. Average pH observed during both the seasons was 8.84 ± 0.06 and 8.83 ± 0.07 (Table.3). pH variation in the study area for both the seasons is shown in (Fig.2) which is mostly alkaline, the raised pH above 8.7 could be due to interface with subsurface water table and agricultural overflow. The results in our study area were similar to the observations made by (Singh et al., 2014 and Pichaiah, et al., 2013).
 |
Figure 2: Contour Maps Showing Variations in pH During Pre Monsoon Season & Post Monsoon Seasons. Click here to view figure |
Electric Conductivity
It ranged between 2250 ± 2280 µmhos/cm with an average value of 2265.0 ± 15.0 for the year 2011-2012 as depicted in (Table.2). Seasonal fluctuation in the values of conductivity in both the seasons varied from 2270 ± 10 and 2259 ± 9.0 µmhos/cm and depicted in (Table.3). The Spatio-temporal variation in EC concentration is shown in (Fig.3) the lowest value of EC was recorded at sample stations 1 & 3 (Pedaavagu & Burdaguda) during the post-monsoon season whereas the highest value was recorded at sample station 20 (Sardar Basthi) in pre-monsoon season. Excessive dissolved organic and inorganic salts in groundwater increased electrical conductivity. Present results are in agreement with the observations made by (Yeole and Shrivastava 2013; Pichaiah, et al., 2013; Keshav Deshmukh, 2013).
 |
Figure 3: Contour Maps Showing Variations in EC During Pre Monsoon Season & Post Monsoon Seasons. Click here to view figure |
Total Dissolved Solids (TDS)
Elevated values observed in the groundwater may be due to the presence of dissolved solids like bicarbonates, carbonates, sulphates, chlorides, nitrates, calcium, magnesium, sodium, potassium and some heavy metals. Usually, major ions in the water are present due to weathering or disintegration of rocks, surface runoff, atmospheric deposition, and anthropogenic activities. TDS content in high rainfall areas may be as less as 20mg/L and it may go beyond 100000 mg/L in some desert brines (Hem 1985). As per Indian Standards 500 mg/L is the required range of desirability and the highest limit is 2000 mg/L.TDS has been reported in the range between 1972 ± 2005 mg/L with a mean value of 1988.50 ± 16.50 for the year 2011-2012 as represented in (Table.2). Analysis for the two seasons indicated high values of TDS in pre-monsoon and lowered values in post-monsoonal season. The mean TDS values for pre-monsoon and post-monsoon period are reported as 1993 ± 12.0 and 1986 ± 14.0 mg/L respectively for the period 2011-2012 from (Table.3). TDS values in groundwater for both periods shown in (fig.4) indicating higher values of TDS in pre-monsoon season at Vijay Basthi and Ram Mandir area which reflects the influence of the paper industry and the improper treatment of industry effluents in the study area. Research carried out by (Bamakanta, et al., 2013) on water quality around JK paper mills also found similar type of observations. Also investigated results are concerning that of observations made by (Patil and Patil, 2011; Srinivas et al., 2000).
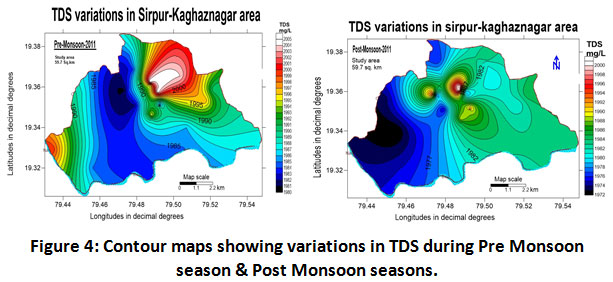 |
Figure 4: Contour Maps Showing Variations in TDS During Pre Monsoon Season & Post Monsoon Seasons. Click here to view figure |
Biological Oxygen Demand (BOD)
It is the most commonly used parameter which represents a quantitative index of degradable organic waste and measures the strength of the sewage. BOD ranged from 4 to 8.32 mg/L with an average of 6.16 ± 2.16 mg/L as depicted in (Table.2) for the study period of 2011-2012. Moderate fluctuating seasonal variation in the values of BOD was found during the period of study. BOD values during the year 2011-2012 recorded as 6.28 ± 2.03 and 6.05 ± 2.05 mg/L for pre-monsoon and post-monsoon as shown in (Table.3). BOD variations for both the seasons are shown in (fig.5). 66 per cent of the total samples in pre-monsoon and 41 per cent in the post-monsoon season surpassing the agreeable threshold mentioned by W.H.O. The BOD values showed improper sanitary conditions of the water. The permissible limit for BOD is 5 mg/L by W.H.O. Similar studies were reported by (Surendra Kumar Yadav, 2006; Abdo et al., 2010; Kesalkar et al., 2012; Giri et al., 2014).
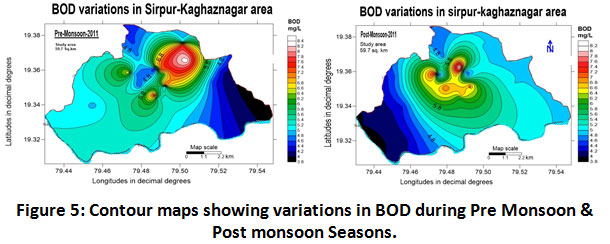 |
Figure 5: Contour Maps Showing Variations in BOD During Pre Monsoon & Post Monsoon Seasons. Click here to view figure |
Chemical Oxygen Demand (COD)
Efficient means to ascertain the sewage capacity and measure the required amount of oxygen to oxidize organic matter. (Mc Cuaig W.B. et al., 1974). Some of the industrial wastes do not respond to the BOD test then pollution strength of such wastes can be easily found out by COD. Elevated BOD values represent the excess usage of organic material along with other suspended and colloidal impurities. The concentration of COD was recorded as 107.0 to 123.50 mg/L with a mean average of 115.25 ± 8.25 mg/L for the study period of 2011-2012 as depicted in (Table.2). Seasonal variation in COD value for the year 2011-2012 observed is 116.75 ± 6.75 and 114.5 ± 7.50 mg/L for pre-monsoon and post-monsoon periods (Table.3.) (Fig.6) show the variations in COD values. The maximum prescribed limit for COD is 4 mg/L by USPHS for drinking water. The present investigated results are attributed to observations made by (Abdo et al., 2010; Giri et al., 2014).
 |
Figure 6: Contour Maps Showing Variations in COD During Pre Monsoon & Post Monsoon Seasons. Click here to view figure |
Dissolved Oxygen (DO)
Imply the level of oxygen present in the available water. Optimum levels of dissolved oxygen depends on exposure to air and photosynthetic activity in the water (Yodsanti and Srisatit, 2009). The saturation value of DO varied from 8.0 to 15.0 mg/L. Reduced amount of DO leads to increased fish mortality and designate that the water sources are highly polluted by organic contaminants. During the study, BOD showed a positive correlation with COD which represents organic pollution by runoff from solids. The availability of lignin, organic matter and toxic materials from the paper industry consumes more oxygen and reduces DO levels (Senthil Kumar et al., 2011). The DO concentrations in the study area ranged from 3.3 to 6.71 mg/L with an average of 5.0 ± 1.70 mg/L for the year 2011-2012 (Table.2). The data on seasonal variations (Pre-monsoon and post-monsoon) were also reported as 5.11 ± 1.60; and 4.95 ± 1.65 mg/L (Table.3) however standard limit for DO by WHO is 5.0 mg/L. The variation in DO concentration is shown in (Fig.7). 50% of the samples in pre-monsoon and 54% in post-monsoon seasons had less DO than the standard limits.
Carbonates and Bicarbonates
The values pertaining to the parameters are clearly shown in (Table.2) and (Table.3) and depicted in (Fig.8) and (Fig.9).
Chloride
Values of chloride content of Sirpur-Kaghaznagar area reported in the range between 690.0 to 710.0 mg/L with a mean value of 700.0 ± 10.0 for the year 2011-2012 from (Table.2). The mean values of the chloride content during pre-monsoon and post-monsoon period lie in the range of 700.0 ± 10.0 and 696.0 ± 6.0 mg/L respectively (Table.3) for the study period of 2011-2012 and were found to be quite higher than the BIS acceptable limits. However, they were within the BIS permissible limits. High concentration of chloride was found at Vijay Basthi and Ram Mandir area as shown in (Fig.10) which is very near to the paper industry.
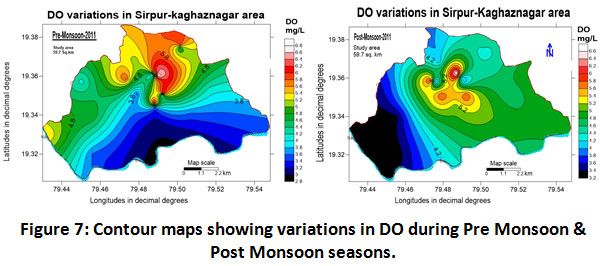 |
Figure 7: Contour Maps Showing Variations in DO During Pre Monsoon & Post Monsoon Seasons. Click here to view figure |
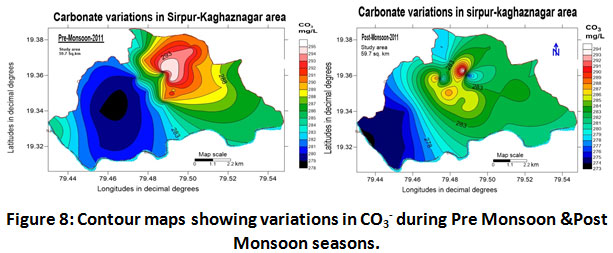 |
Figure 8: Contour Maps Showing Variations in CO3- During Pre Monsoon & Post Monsoon Seasons. Click here to view figure |
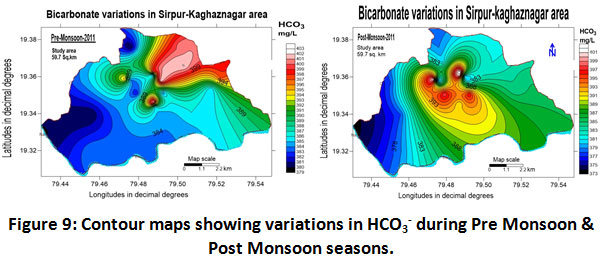 |
Figure 9: Contour Maps Showing Variations in HCO3- During Pre Monsoon & Post Monsoon Seasons. Click here to view figure |
Fluoride
In general fluoride content in water is through geological pathway. Dissolution of minerals like fluorite and fluorapatite is considered the chief mechanism behind the contamination of fluoride in groundwater. Fluoride concentrations in the Sirpur-Kaghaznagar area ranged from 0.14 to 4 mg/L with a mean of 2.06 ± 1.94 mg/L for the year 2011-2012 (Table.2). Seasonal variations for Fluoride ranged as 0.14 ± 4.0 and 0.14 ± 3.90 mg/L for pre-monsoon and post-monsoon seasons (Table.3). High Fluoride concentrations of 3.3, 3.8 and 4 mg/L (Pre-monsoon), and 3.4 mg/L, 3.9 and 3.9 mg/L (Post Monsoon) were recorded at Ram Mandir, Dada Nagar and Sarsilk area of Sirpur-Kagaznagar as shown in (fig.11). Geology in the study area majorly is the reason for raised fluoride vales. Sodium gained from chemical weathering of rocks leads to leaching of fluorine from soil and rocks (Murkute et al., 2013). Amplified fluoride values outside permissible limit WHO & BIS (<1.5 mg/l) in all the seasons is predominantly because of weathering and dissolution of parent rock mineral (Handa, 1975).
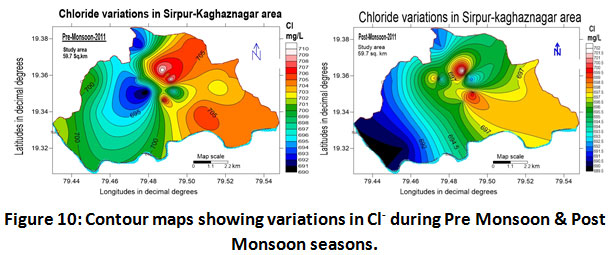 |
Figure 10: Contour Maps Showing Variations in Cl- During Pre Monsoon & Post Monsoon Seasons. Click here to view figure |
 |
Figure 11: Contour Maps Showing Variations in F During Pre Monsoon & Post Monsoon Seasons. Click here to view figure |
Sulphates
High concentrations of sulphates can lead to dehydration and gastrointestinal problems, Ellen horn, and Barceloux, (1988) if it exceeds a concentration of more than 400 mg/l it imparts a bitter taste to cause laxative effects (Raghunath 1987). The use of sulphur-rich fertilizers can be considered as a potential source in groundwater. In the present investigation carried out in the Sirpur-Kaghaznagar area, the Sulphate content fluctuated between 386.0 to 420.0 mg/L with a mean value of 403.0 ± 17.0 for the year 2011-2012 (Table.2). Sulphate content in the study area during the two periods was also observed and its values were 412.5 ±7.5 and 393 ± 7.0 mg/L for pre-monsoon and post-monsoon respectively as shown in (Table.3).The raised sulphate values far from standard limit specifically in pre-monsoon indicated amalgamation of wastewater from industry and sewage from domestic areas. The highest concentration was observed at Vijay Basthi and Ram Mandir area as depicted in (Fig.12). The results were similar to those of (Patterson et al., 2008).
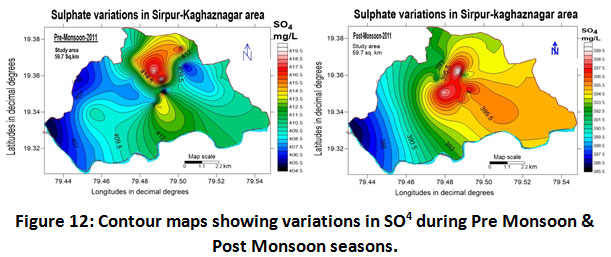 |
Figure 12: Contour Maps Showing Variations in SO4 During Pre Monsoon & Post Monsoon Seasons. Click here to view figure |
Nitrate
Nitrate levels lie between 52.0 to 81.0 mg/L with an average value of 66.50 ± 14.50 for the year 2011-2012 as depicted in (Table.2). The seasonal variations were also studied during the study period and the values recorded are 69.50 ±11.50 and 66.0 ± 14.0 mg/L for pre-monsoon and post monsoonal seasons as depicted in (Table.3). Significantly high levels of nitrate beyond the prescribed standards by BIS (< 45 mg/L) were observed in both the seasons as shown in (Fig.13) indicate the use of nitrogen-based chemicals in agriculture and mixing of paper mill effluents along with groundwater in the vicinity.
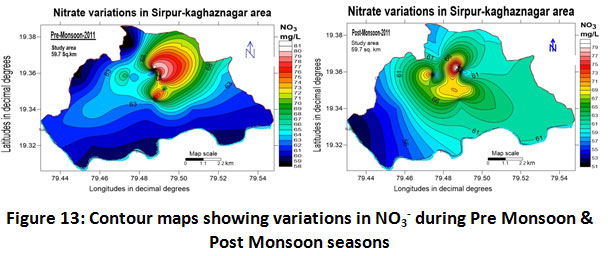 |
Figure 13: Contour Maps Showing Variations in NO3- During Pre Monsoon & Post Monsoon Seasons. Click here to view figure |
Calcium
The main source of calcium is the disintegration of silicate mineral clusters of plagioclase, pyroxene, and amphiboles available in rocks. It is also dissolved from rocks such as limestone, marble, calcite, dolomite, gypsum, and apatite. Less concentration of calcium has no adverse effects, however, higher concentrations are not suitable for domestic and washing purposes, (Davis and Dewiest 1996). The calcium concentrations in groundwater ranged between 218.0 to 238.0 mg/L with a mean value of 228.0 ± 10.0 mg/L for the year 2011-2012 from (Table.2). The variation in calcium content during both the seasons recorded as 231.0 ± 7.0 and 226.5 ± 8.5 mg/L for the year 2011-2012 as depicted in (Table.3). The highest value of 238.0 mg/L was observed at the Sarsilk colony in pre-monsoon as shown in (Fig.14) which is very close to the paper industry. The high values are due to the open dumping of municipal solid waste and the industrial effluents released. The range of calcium values in all the seasons was beyond the permissible limit mentioned by BIS.
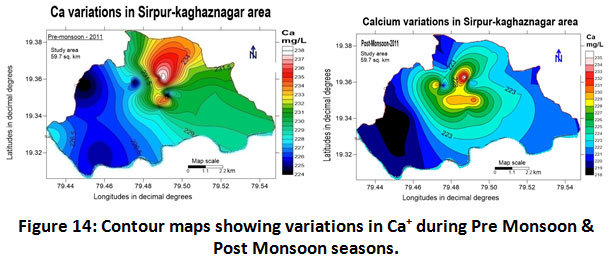 |
Figure 14: Contour Maps Showing Variations in Ca+ During Pre Monsoon & Post Monsoon Seasons. Click here to view figure |
Magnesium
The magnesium values lie in the range of 132.0 to 153.0 mg/L with a mean value of 142.5 ± 10.50 for the year 2011-2012 (Table.2). Seasonal variation was also recorded as 146.5 ± 6.5 and 141.5 ± 9.5 mg/L for pre-monsoon and post-monsoonal seasons respectively (Table.3). Magnesium concentrations in the study area in both the seasons exceeded the BIS permissible limits are depicted in (fig.15). This shows the clear influence of industry on groundwater quality. Study carried out by (Sharma et al, 2013) supports the findings.
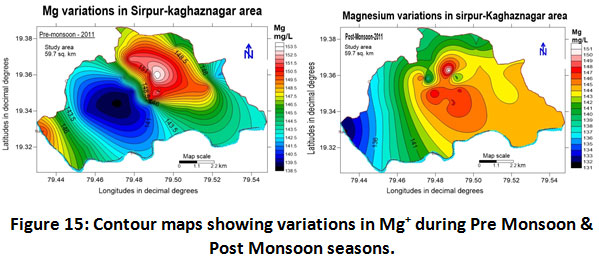 |
Figure 15: Contour Maps Showing Variations in Mg+ During Pre Monsoon & Post Monsoon Seasons. Click here to view figure |
Sodium, Potassium and Total Hardness
Discharge of soluble salts during the weathering of plagioclase feldspars are the prime source of sodium in water. Sodium concentrations in soils can be increased by the repetitive use of irrigated water thereby changing the soil permeability and texture and therefore making it unsuitable for irrigation (Trivedi and Goel, 1984). The recommended value for sodium in drinking water by WHO is 200 mg/L (WHO, 2004). In the present investigated area the sodium content observed for the year 2011-2012 ranged between 460.0 to 486.0 mg/L with an average value of 473.0 ± 13.0 mg/L from (Table.2) and the seasonal variations found ranged as 478.0 ± 8.0 and 471.0 ± 11.0 mg/L for pre-monsoon and post-monsoon periods which were quite higher than the permissible limit suggested by WHO (Table.3). The Spatio-temporal variations of sodium concentrations are shown in (fig.16). (Kumar et al., 2011; Yeole and Shrivastava 2013). Potassium: Geochemical weathering of mineral compounds like orthoclase, microcline, biotite, leucite and nepheline in the bedrocks is considered the basic source for the occurrence of potassium in groundwater. Potassium concentrations during the study period of 2011-2012 ranged between 47 to 66.29 mg/L with a mean value 56.64 ± 9.64 mg/L (Table.2). Similarly, the seasonal variations recorded ranged as 58.14 ± 8.14 and 55.5 ± 8.5 mg/L for pre-monsoon and post- monsoon seasons as depicted in (fig.17) & (Table.3).
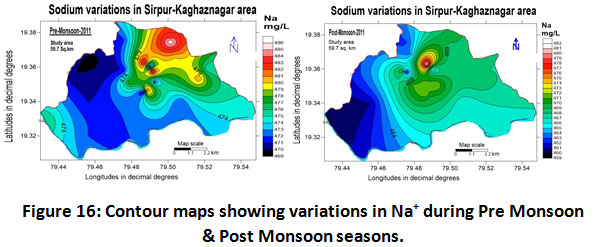 |
Figure 16: Contour Maps Showing Variations in Na+ During Pre Monsoon & Post Monsoon Seasons. Click here to view figure |
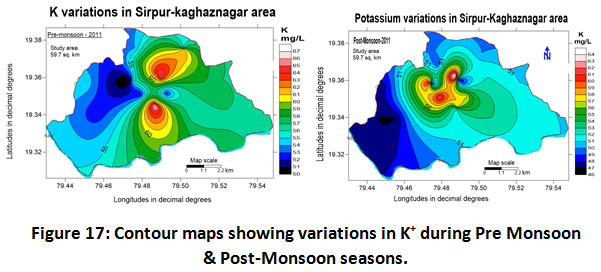 |
Figure 17: Contour Maps Showing Variations in K+ During Pre Monsoon & Post Monsoon Seasons. Click here to view figure |
Total Hardness
Total hardness measured varied between 478 to 502 mg/L for the year 2011-2012 (Table.2). The seasonal variations recorded in both seasons ranged as 490.0 ±12.0 and 490.0 ± 12.0 mg/L which exceeded the agreeable threshold prescribed by BIS, (2012), however, they were within the permissible limits (Table.3). Spatial variation of Hardness concentration in groundwater during March 2011 and February 2012 are shown in (Fig.18). Study on water quality by (Bamakanta et al., 2013 and Sharma et al., 2013) strengthen our findings.
 |
Figure 18: Contour Maps Showing Variations in TH During Pre Monsoon & Post Monsoon Season. Click here to view figure |
Table 3: Summation of seasonal variations in physico-chemical composition of ground water samples collected from the Sirpur-Kaghaznagar area.
|
S. No |
Parameter |
Pre monsoon |
Post Monsoon |
||||||
|
Min |
Max |
Mean ± St. Dev |
Min |
Max |
Mean ± St. Dev |
||||
|
1 |
pH |
8.78 |
8.90 |
8.84 ± 0.06 |
8.76 |
8.90 |
8.83 ± 0.07 |
||
|
2 |
EC |
2260.0 |
2280.0 |
2270 ± 10.0 |
2250.0 |
2268.0 |
2259.0 ± 9.0 |
||
|
3 |
TDS |
1981.0 |
2005.0 |
1993.0 ± 12.0 |
1972.0 |
2000.0 |
1986.0 ± 14.0 |
||
|
4 |
BOD |
4.25 |
8.32 |
6.28 ± 2.03 |
4.0 |
8.10 |
6.05 ± 2.05 |
||
|
5 |
COD |
110.0 |
123.5 |
116.75 ± 6.75 |
107.0 |
122.0 |
114.5 ± 7.50 |
||
|
6 |
DO |
3.51 |
6.71 |
5.11 ± 1.6 |
3.30 |
6.60 |
4.95 ± 1.65 |
||
|
7 |
TH |
478.0 |
502.0 |
490.0 ± 12.0 |
478.0 |
502.0 |
490.0 ± 12.0 |
||
|
8 |
Cl- |
690.0 |
710.0 |
700.0 ± 10.0 |
690.0 |
702.0 |
69.0 ± 6.0 |
||
|
9 |
Co3-2 |
279.0 |
295.0 |
287.0 ± 8.0 |
274.0 |
294.0 |
284.0 ± 10.0 |
||
|
10 |
HCo3- |
380.0 |
402.0 |
391.0 ± 11.0 |
374.0 |
402.0 |
388.0 ± 14.0 |
||
|
11 |
F |
0.14 |
4.0 |
2.07 ± 1.93 |
0.14 |
3.90 |
2.02 ± 1.88 |
||
|
12 |
SO42- |
405.0 |
420.0 |
412.5 ± 7.5 |
386.0 |
400.0 |
393.0 ± 7.0 |
||
|
13 |
NO3- |
58.0 |
81.0 |
69.50 ± 11.50 |
52.0 |
80.0 |
66.0 ± 14.0 |
||
|
14 |
Ca2+ |
224.0 |
238.0 |
231.0 ± 7.0 |
218.0 |
235.0 |
226.50 ± 8.50 |
||
|
15 |
Mg2+ |
140.0 |
153.0 |
146.5 ± 6.5 |
132.0 |
151.0 |
141.5 ± 9.50 |
||
|
16 |
Na+ |
470.0 |
486.0 |
478.0 ± 8.0 |
460.0 |
482.0 |
471.0 ± 11.0 |
||
|
17 |
K+ |
50.0 |
66.29 |
58.14 ± 8.14 |
47.0 |
64.0 |
55.5 ± 8.5 |
||
All values except pH and EC are in mg/L. Values are mean ± SD of 24 sampling stations
Cluster Analysis
An easy way to understand the extent of the relationship between two different variables is through the application of cluster analysis, wherein it gives an understanding of maximum and minimum relationship. This tool was used to interpret the similarity between parameters of two different datasets and interpolate the sequence of clusters they form. Cluster analysis was applied to two different datasets of groundwater quality from the Sirpur-Kaghaznagar area (Pre-monsoon and Post-monsoon) to understand the cohesive wellness among similar parameters by means of the resulted dendrogram. Cluster analysis connote the correlation between various water quality parameters and based on the study, the 17 parameters of two seasons were grouped into statistically significant clusters as shown in (Fig.19 & Fig.20).
Conclusion
The overall results obtained from the study carried out on the spatial distribution of major ions during pre and post-monsoon seasons and the chemical characterization of paper mill effluent in the Sirpur-Kaghaznagar area is of immense help in yielding the information on the genuine condition of water quality and the pollution outcome prevailing in that area. Since its inception in the year 1942, the industry is responsible for discharging various toxic chemical contaminants into the nearby surroundings; the long term release of industrial effluents with indefinite treatment methods along with domestic sewage and use of pesticides and fertilizers in agriculture has led to pollution load altering the quality of the same in the research area. Furthermore, the effluent parameters such as pH, EC, TDS, BOD, COD, Alkalinity, SO42-, Cu, and Fe were exceeding the BIS limits. The spatial distribution of major ions with few other parameters through contour maps clearly depicts that the pollution load is high in the vicinity of the paper industry in the pre-monsoon season. Therefore from the above study, it is very much evident that the paper industry effluents are acting as one of the factors influencing the water quality besides domestic and agricultural activity in the Sirpur-Kaghaznagar area.
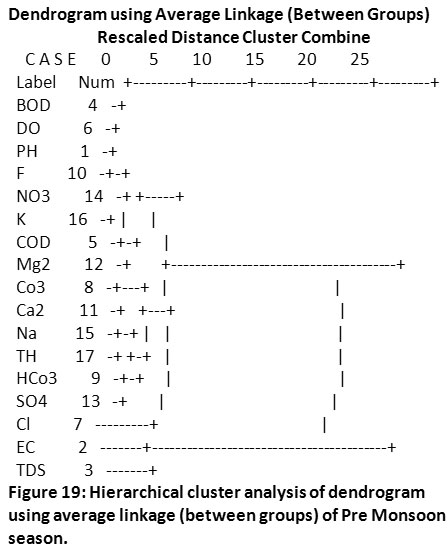 |
Figure 19: Hierarchical cluster analysis of dendrogram using average linkage (between groups) of Pre Monsoon season. Click here to view figure |
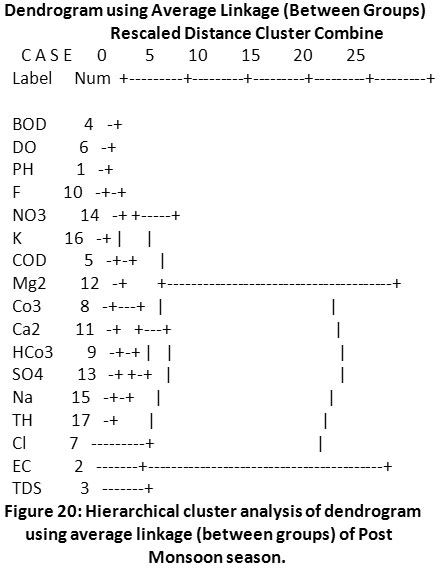 |
Figure 20: Hierarchical cluster analysis of dendrogram using average linkage (between groups) of Post Monsoon season. Click here to view figure |
Acknowledgements
It is with a deep sense of gratitude that the author is thankful to University college of Science, Osmania University, Hyderabad for allowing to carry out the research and also extend sincere thanks to the management of Symbiosis Skills & Professional University.
Funding Source
The author(s) received no financial support for the research, authorship, and/or publication of this article.
Conflict of Interest
The authors do not have any conflict of interest.
References
- Abdo, M.H., Nasharty, S.M.E. (2010). Physico–chemical evaluations and trace metals distribution in water–surficial sediment of Ismailia canal, Egypt, Nature and Science; 8(5):198-206.
- Anju, Bhatnagar (2015). Assessment of physic-chemical characteristics of paper industry effluents, Rasayan Journal of Chemistry; 8(1): 143-145.
- APHA, AWWA, WEF (2012). Standard Methods for Examination of Water and Wastewater. 22nd ed. Washington: American Public Health Association; 2012, 1360 pp.
- Davis, S.N., and De Wiest (1996): “Hydrogeology”, John Wiley & Sons, New York, P. 463.
- Ellenhorn M.J., Barceloux D.G. (1998). Polycyclic Aromatic Hydrocarbons in: Medical Toxicology: Diagnosis and Treatment of Poisoning. Elsevier, New York, NY: 952-954.
- Garnaik Bamakanta., Panda Sunakar, Tripathy Sathyabhama., and Tripathy Upendra Prasad., (2013). Seasonal variation of Nagavali River water quality at the vicinity of paper mill near Jaykapur, odisha, India International Research Journal of Environmental Sciences; 2(5): 46-52.
- Handa BK (1975) Geochemistry and genesis of fluoride contains groundwater in India. Ground Water 13:275–281.
CrossRef - Jitendra, Giri, Anjana, Srivastava, Pachauri, S.P., and Srivastava, P.C., (2014). Effluents from paper and pulp industries and their impact on soil properties and chemical composition of plants in Uttarakhand, Indian Journal of Environment and Waste Management; 1(1): 026-032.
- Jukka A, Rintala. J A, and Puhakka D (1994). Anaerobic treatment in pulp and paper mill waste management: A review. Bio resource Technol 47: 1-18.
CrossRef - Kesalkar, V.P. Isha. P. Khedikar, A.M Sudame (2012). Physico-chemical characteristics of wastewater from paper industry, Int. J. of Engineering Research and Applications; 2(4): 137-143.
- Keshav, K. Deshmukh., (2013). Impact of Human activities on the quality of ground water from Sangamner area, Ahmednagar district, Maharashtra, India. International Research Journal of Environment Sciences; 2(8): 66-74.
- Manju, Sharma, and Smita, Chaudhry, (2013). Assessment of ground water quality in vicinity of industries and along Yamuna River in Yamuna Nagar, Haryana, India, Asian Journal of Science and Technology; 4(10): 054-061.
- Metcalf, & Eddy, Inc., Revised by Tchobananoglous, G. & Burton, F.L. (2003). Wastewater engineering: treatment, disposal and reuse.4th Ed. McGraw-Hill series in water resources and environmental engineering, New York, USA.
- Murkute, Yogesh, A, Khond, Mrunalini, V, and Salankar, Ashish R., (2013). Fluoride contamination in groundwater from Korpane Tehsil, Chandrapur District, Maharashtra, Journal of Applied Geochemistry; 15(4): 47-487.
- Patil, V.T. and Patil, P.R., (2011). Groundwater quality of open wells and tube wells around Amalner town of Jalgaon, district, Maharashtra, India, Electronic Journal of Chemistry; 8(1): 5378.
CrossRef - Pattamaporn Yodsanti and Thares Srisatit (2009). Effect of domestic wastewater treatment options on water quality of the lower phetchaburi River, Thailand, Journal of Environmental Research And Development; 4( 1):1-8.
- Patterson, S.J, Chanasyk DS, Mapfumo E, Naeth MA (2008).Effects of diluted Kraft pulp mill effluent on hybrid poplar and soil chemical properties. Irrig. Sci; 26: 547-560.
CrossRef - Pichaiah, S, Senthil Kumar, G.R. Srinivasamoorthy, K., and Sarma V.S. (2013). Hydro chemical characterization and quality assessment of Groundwater in Tirupur Taluk, Tamil Nadu India: Emphasis on irrigation utility, J. Acad. Indus. Res; 1(12): 805-812.
- Pooja Tripathi, Virendra Kumar, Gyanesh Joshi, Sat Pal Singh, Suresh Panwar, Sanjay Naithani, Raman Nautiyal (2013). A comparative study on physico-chemical properties of pulp and paper mill effluent, International Journal of Engineering Research and Applications; 3(6): 811-818.
- Raghunath, H.M. (1987). Ground water. Wiley Eastern Ltd., Delhi, India, 563p.
- Saravana Sundaram, E.J., Elayaperumal, R. Kiruthika, M. Ramya, V and Dharmalingam, P., (2014). Effluents of Paper Mill: Physico-Chemical Properties of Water, International Journal of Chem. Tech Research; 6(7): 3541-3545.
- Sawyer, C.C. and Mc Carty, P.L. (1978).Chemistry for Environmental Engineers,
- Senthil Kumar, D., Sateesh kumar, P., and Gopalakrishnan P., (2011). Ground water quality assessment in paper mill effluent irrigated area –using multivariate statistical analysis, World Applied Sciences Journal; 13(4): 829-836.
- Srinivas, Ch., Ravi Shankar, Piska, Venkateshwar, C, Satyanarayana rao, M.S., and Ravinder Reddy, R., (2000). Studies on groundwater quality of Hyderabad, Pollution Research; 19(2): 285-289.
- Surabhi Yadav and Nidhi Yadav (2014).Physico chemical study of paper mill effluent: To assess pollutant release to environment, International Journal of Environmental Sciences; 4(5):
- Surendra Kumar Yadav (2006). Human Health Implications Due to Water Toxicity by Pulp and Paper Mill Journal of Human Ecology; 20(2): 91-96.
CrossRef - Tariq, M, Ali, M, Shah, Z (2006). Characteristics of industrial effluents and their possible impacts on quality of underground water. Soil & Environment; 25(1): 64–69.
- Trivedi, R.K. and Goel, P.K., (1984). Chemical and Biological methods for water pollution studies, Environmental Publications, Karad, India, pp: 251.
- Venkateswar Reddy, K. Vijayalakshmi, T. Archana, Giri., and Janaki Ganga Bhavani, A. (2013). Effect of paper industry effluents on physico-chemical and biological properties of soil, International Journal of Innovative Research in Science, Engineering and Technology; 2(8): 3811-3815.
- Vinod Kumar and A. K. Chopra (2011). Impact on physico-chemical characteristics of soil after irrigation with distillery effluent Archives of Applied Science Research, 2011, 3 (4):63-77.
- Vinod Kumar, A.K. Chopra, Sandeep Kumar, Jogendra Singh and Roushan K. Thakur (2015). Effects of Pulp and Paper Mill Effluent Disposal on Soil Characteristics in the Vicinity of Uttaranchal Pulp and Paper Mill, Haridwar (Uttarakhand), India, International Journal of Agricultural Science Research; 4(6): 117-125.
- WHO/UNICEF-JMP, (2004). Meeting the MDG Drinking water and Sanitation. A Midterm Assessment of Progress. Geneva World Health Organization. ISBN 924156278 1
- Yeole, P.M, and Shrivastava, V.S, (2013). Impact Assessment of Paper Mill Effluents on Soil and Ground water, Asian Journal of Biochemical and Pharmaceutical Research; 3(4): 85-9.


