Assessment of Heavy Metals in Ground Water of Different Locations of National Capital Region, Delhi, India
J. Dinakaran1
 , N. S. Abbas1
*
, Shvetambri Arora2
, Sujata Bhardwaj1
and Babeeta C. Kaula3
, N. S. Abbas1
*
, Shvetambri Arora2
, Sujata Bhardwaj1
and Babeeta C. Kaula3
http://dx.doi.org/10.12944/CWE.16.1.14
Copy the following to cite this article:
Dinakaran J, Abbas N. S, Arora S, Bhardwaj S, Kaula B. C. Assessment of Heavy Metals in Ground Water of Different Locations of National Capital Region, Delhi, India. Curr World Environ 2021;16(1). DOI:http://dx.doi.org/10.12944/CWE.16.1.14
Copy the following to cite this URL:
Dinakaran J, Abbas N. S, Arora S, Bhardwaj S, Kaula B. C. Assessment of Heavy Metals in Ground Water of Different Locations of National Capital Region, Delhi, India. Curr World Environ 2021;16(1). Available From : https://bit.ly/3pS6vFc
Download article (pdf) Citation Manager Publish History

Introduction
Heavy metals contamination in ground water is a major problem across the world. Heavy metals are naturally present in the ecosystems. However, in recent decades the heavy metal concentration levels are increasing in ground water, river and soil system due to anthropogenic activities such as chemical industries, mining, fertilizers, emission from automobiles, and agriculture runoff.1-4 Heavy metal contaminations in the ground water system are a serious concern in most of the developing countries.1,5,6 Because heavy metals are dangerous for the health of humans and natural systems such as river, soil and ground water. Heavy metals pollute the river as well as the ground water quality and cause many diseases. Globally, several studies have reported the heavy metals cause diseases like cancer, kidney dysfunction, liver failure, neurological disorders, reproductive disorders and gastrointestinal disorder.7-10 Therefore, monitoring the heavy metal ions concentration in water bodies must be a prerequisite to its consumption for drinking purpose.
Increase in the population of National Capital Region (NCR) and rapid urbanization have contributed a serious threat to heavy metal ion pollution in the river as well as in ground water system. In the NCR, especially in Delhi, the river Yamuna serves like domestic water supply, agricultural activities, and various uses for the people. Several studies reported that the river Yamuna contaminated with heavy metals due to the effluent discharges from industries, dumping of garbage and waste water from houses.2,11,12 Monitoring of heavy metal contamination in rivers and ground water is essential because the higher level of heavy metals may have a serious impact on not only in human life but also in natural ecosystem.
Ground water is a very precious natural resource for the human beings. Therefore, the ground water quality is very critical that influence the human health and agricultural activities. The changes in chemical composition or heavy metal ions concentration in ground water may affect grain production and bioaccumulation in vegetable crops.13,14 The present research work was carried out to assess the presence of various heavy metal ions contamination in ground water of NCR, India. This study was further emphasised on some basic hydro-chemical properties and heavy metals of groundwater in the NCR.
Materials and Methods
Study Area
The water samples were collected from different locations viz., Najafargarh (latitude 28°37'44.58"N and longitude 76°59'26.28"E), Bindapur (latitude 28°36'37.48"N and longitude 77° 4'7.02"E), Dwarka (latitude 28°34'56.27"N and longitude 77° 2'59.91"E), Uttam Nagar (latitude 28°37'0.81"N and longitude 77° 3'16.67"E) and Sonipat (latitude 28°59'35.10"N and longitude 77° 0'54.26"E), in the NCR, India (Fig 1). The study area falls under semi-arid condition and it is characterized by three important seasons namely, summer, monsoon, and winter.
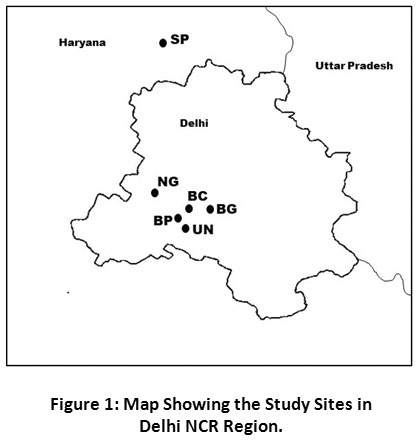 |
Figure 1: Map Showing the Study Sites in Delhi NCR Region. Click here to view Figure |
Sampling and Analysis
The water samples were collected from the selected sites in amber bottles. The samples were brought to laboratory and few drops of HNO₃ added to minimize the microbial activities and avoid precipitation of some heavy metals.15 Before the heavy metal analysis, the water samples were digested with nitric acid.16 After digestion, the Whatman filter paper 41 was used for filtering the samples and the extract volume was raised to 50 ml using doubled distilled water. All samples were preserved in reagent bottles at room temperature for further analysis. All the filtered water samples were determined for selected heavy metal ions, i.e., Arsenic (As), Chromium (Cr), Copper (Cu), Cadmium (Cd), Nickel (Ni), Zinc (Zn), and Lead (Pb), by using Atomic Absorption Spectrophotometer (Sens AAS Dual, GBC, Australia) using Merck standards. The electrical conductivity (EC), total dissolved solid (TDS), and salinity of the water samples were determined using multi parameter device (Hanna instruments).
Pollution Load Index
The Pollution Load Index (PLI) was calculated to determine the ground water quality of the sites.17, 18 The following formula was used to calculate PLI;
PLI = n √ (CF1 X CF2 X CF3 X ......CFn)
Contamination Factor (CF) = C metal / C MAC
Where, C metal is the concentration of metal and C MAC is the maximum allowed concentration of the particular metal. MAC values are taken from the BIS 2012.
Statistical Analysis
The SPSS (SPSS version 16, SPSS Inc., Chicago 1L, USA) and Minitab software for windows were used for all statistical data analysis. In order to find out whether the measured parameters are significantly different or not (p < 0.05) the analysis of variance (ANOVA) was used. The relationship between all the selected variables were estimated using Pearson’s linear correlation with p < 0.05 significant threshold.
Results and Discussion
Table 1 shows the selected basic hydro-chemical properties of ground water samples collected from different sites in the NCR. This study found the significant difference (p < 0.05 level) in the concentration values of the measured parameters and heavy metals among the study sites. The EC, TDS and salinity values range from 0.32 to 11.41 mS/cm, 233 to 8100 ppm and 154 to 6310 ppm respectively (Table 1). The EC was highest in BC (11.41 mS/cm) and lowest in UN (0.32 mS/cm). The EC of water is a measure of the total dissolved chemicals or ions and it would indicate the level of contamination. The excess ions in the water may be an indicator of the contaminated or polluted water.19 In our study, the ions concentrations were highest in BC, followed by NG, BP, BG, SP and UN in the study region. Among the study sites, the highest EC, TDS and salinity was found in BC, followed by NG, BP, BG, SP and UN. The salinity value of BC was not in the permissible limit.20 The TDS values were also not in the permissible limit in NG, BP, BG and SP sites, but they are in the acceptable limit.20 Interestingly, in BC the TDS value (8100 mg/L) was fourfold higher than the acceptable limit, i.e. 2000 mg/L.20
Table 1: Basic Hydro-Chemical Properties of Groundwater Samples.
|
Site |
EC (mS/ cm) |
TDS (mg/L) |
Salinity (mg/L) |
|
NG |
1.73±0.01 |
1270±2.89 |
840±1.45 |
|
BP |
1.65±0.01 |
1170±0.88 |
811±0.88 |
|
BC |
11.41±0.12 |
8100±2.89 |
6310±2.89 |
|
BG |
1.41±0.01 |
1000±0.58 |
686±1.20 |
|
SP |
1.34±0.01 |
945±0.88 |
650±0.58 |
|
UN |
0.32±0.01 |
233±1.15 |
154±1.53 |
±indicates standard error ; NG – Najafargarh , BP- Bidanpur, BC - Dwarka, BG- BCAS-Ground water, SP –Sonipat, UN - Uttam Nagar
Heavy Metals
Figure 2 shows the heavy metals ion concentration in the groundwater samples. Overall, the order of the mean values of heavy metal ion in ground water was Zn > Ni > Cr > Pb > As > Cu > Cd. The zinc (Zn) concentration was found highest (2.69 mg/L) in BC, followed by BG, SP, BP, UN and NG ( 1). The nickel (Ni) concentration was comparatively higher in BC (0.49 mg/L) than that of NG, BP, BG, SP and UN. Similarly, the chromium (Cr) concentration was more in BC (0.45 mg/L) followed by NG, BG, BP, SP and UN. The highest concentration of lead was found in BC (0.070 mg/L) followed by BG, BP, NG, SP and UN. The arsenic (As) concentration was highest in BC (0.026 mg/L) followed by BP, BG, SP, NG and UN. The copper concentration was highest (0.004 mg/L) in NG, followed by BC, UN, BP, BG and SP. The cadmium (Cd) concentration was highest in BC (0.005 mg/L) followed by NG, BP, BG, BP and SP. This study did not detect any cadmium in the water sample collected from the UN site. Although the site wise variations in the heavy metals concentrations in the ground water clearly reflect the various levels of anthropogenic activities and diverse nature of contaminates available in the sites.
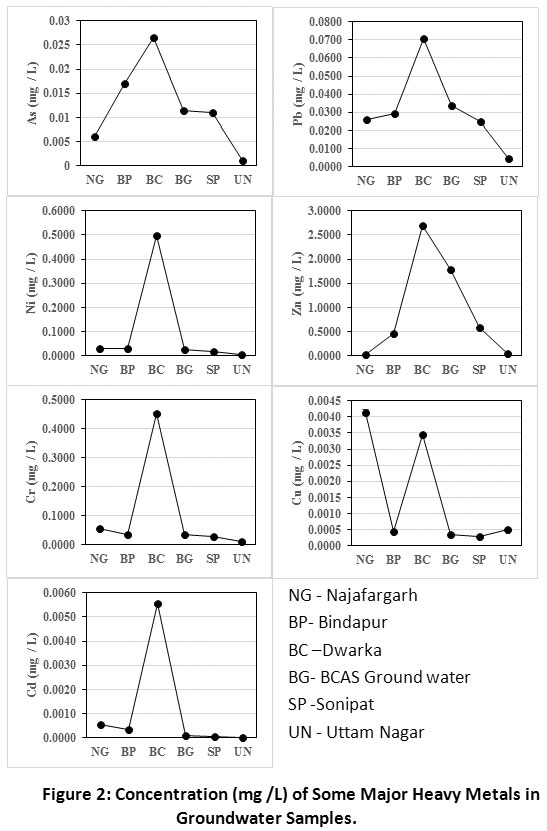 |
Figure 2: Concentration (mg /L) of Some Major Heavy Metals in Groundwater Samples. Click here to view Figure |
Table 2 shows the measured parameters with its BIS permissible limits. The concentration of As was higher than the acceptable limit in BC and it may have a serious impact on human health, if they consume without treatment, especially it can cause cancer, skin cancer, neurological disorders, pulmonary disease, hypertension and cardiovascular disease.21,22 Except UN, the concentration of Pb was not in the acceptable limit.20 If people consume the water with high concentration of Pb (>0.01 mg/L) may have a serious problem of sleeplessness, arthritis, renal dysfunction, vertigo, paralysis and brain damage.21, 23 The concentration of Ni was higher than the acceptable limit at NG, BP, BC and BG. The excess Ni in the human body may cause cancer.21 The excess amount of Zn in water (>1.5 mg/L) is harmful and it may cause cell death in the brain, gastrointestinal tract problems and prostate cancer.21 The concentrations of Zn and Cu were in the acceptable limits (sampling sites). The Cr concentration was more than the acceptable level at BC, BG and NG. However, it has been observed that the Cd concentration was more than the acceptable level only at BC. The excess amount of Cr and Cd in water is harmful and it causes renal dysfunction, lung disease, kidney damage, osteomalacia, glucosuria, emphysema, aminoaciduria respiratory tract problems, stomach and small intestine damages and cancer.21
Table 2: Hydro Chemical Parameters with its BIS Limit.
|
S.No. |
Parameters |
In this study |
BIS limit (2012) |
|
|
Acceptable |
Permissible |
|||
|
1. |
EC (mS/ cm) |
0.32 – 11.41 |
- |
- |
|
2. |
TDS (mg/L ) |
233-8100 |
500 |
2000 |
|
3. |
Salinity (mg/L) |
154-6310 |
- |
- |
|
4. |
As (mg/L) |
0.001-0.027 |
0.01 |
No relaxation |
|
5. |
Pb (mg/L) |
0.005-0.07 |
0.01 |
No relaxation |
|
6. |
Ni (mg/L) |
0.006- 0.49 |
0.02 |
No relaxation |
|
7. |
Zn (mg/L) |
0.03-2.69 |
5 |
15 |
|
8. |
Cu (mg/L) |
0-0.004 |
0.05 |
1.5 |
|
9. |
Cr (mg/L) |
0.001-0.45 |
0.05 |
No relaxation |
|
10. |
Cd (mg/L) |
0-0.006 |
0.003 |
No relaxation |
The concentration of heavy metals is varying from site to site in the study region. For example, at NG, the Pb, Ni, and Cr concentrations were higher than the acceptable limit.20 In BP, the As, Pb, and Ni concentrations were more than the permissible level. In BC, the As, Pb, Ni, Cr and Cd concentrations were more than the acceptable level. In BG, the Pb, Ni, and Cr concentrations were higher than the acceptable limit. In SP, only the Pb concentration was higher than the acceptable limit. The measured heavy metals concentrations were in the acceptable limit only at the UN site. Thus, except UN, the ground water collected from the other sites are contaminated with heavy metals. Therefore, it may have a direct effect on human health if they are not properly treated and consumed directly by the local people around this region.
The present study calculated the CF and PLI of the selected study sites (Table 3). The CF value >6 indicates very high contamination; 3 -6 indicates the considerable high contamination; 1-3 indicates the moderate contamination and <1 indicates low contamination.17,18 Thus the highest CF values of all the sampling sites were observed by metal Ni followed by Pb, Cr, As, Zn and Cu (Table 3). Likewise, if the PLI value >1 indicates polluted and <1 not polluted.17,18 In this study, the PLI values were less than one in all the sampling sites, except in BC (Table 3). In BC site, the PLI value was higher than one which clearly indicates that ground water at this site is contaminated with heavy metals. Several studies have also reported that the Najafgarh drain carries industrial and domestic effluents (from various additional drains passing through the industrial areas of NCR region) contain lots of heavy metals.2, 19 This may be the reason that the ground water of BC site is more polluted with heavy metals than other sites.
Table 3: Contamination Factor (CF) and Pollution Load Index (PLI) of the selected Study Sites.
|
Site |
Contamination factor |
PLI |
||||||
|
As |
Pb |
Ni |
Zn |
Cu |
Cr |
Cd |
||
|
NG |
0.60 |
2.61 |
1.60 |
0.01 |
0.08 |
1.10 |
0.19 |
0.31 |
|
BP |
1.70 |
2.92 |
1.44 |
0.09 |
0.01 |
0.73 |
0.12 |
0.34 |
|
BC |
2.65 |
7.05 |
24.91 |
0.54 |
0.07 |
9.07 |
1.85 |
2.25 |
|
BG |
1.15 |
3.36 |
1.33 |
0.36 |
0.01 |
0.74 |
0.04 |
0.32 |
|
SP |
1.09 |
2.47 |
0.94 |
0.12 |
0.01 |
0.57 |
0.02 |
0.21 |
|
UN |
0.11 |
0.48 |
0.30 |
0.01 |
0.01 |
0.25 |
0.00 |
0.00 |
Table 4 shows the correlation matrix of the measured parameters. This study found the linear relationships between the measured parameters except with Cu (Table 3). The present study found a strong linear relationship (R2 = 1, p < 0.05) between the EC and TDS. Thus, the dissolved matters in water play a significant role in the change in EC of the water.19 The linear relationship between EC, TDS, salinity and other heavy metals clearly reflect the similar level of contaminations or release from the same sources of pollutants in the study sites. Several studies have reported that the entire Yamuna river stretch in the NCR is contaminated with moderate to high levels due to industrial effluent discharge, sewage discharge, and dumping of domestic garbage in the river.2, 12 Thus, frequent monitoring of heavy metal ions concentration in ground water of studied region is prerequisite to make awareness among the people about the quality of water and risk of using this water for domestic purpose.
Table 4: Correlation Co-Efficient of Hydro Chemical Parameters in Ground Water Samples.
|
|
EC |
TDS |
Salinity |
As |
Pb |
Ni |
Zn |
Cu |
Cr |
Cd |
|
EC |
1.00 |
|||||||||
|
TDS |
1.00* |
1.00 |
||||||||
|
Salinity |
1.00* |
1.00* |
1.00 |
|||||||
|
As |
0.84* |
0.84* |
0.84* |
1.00 |
||||||
|
Pb |
0.93* |
0.93* |
0.92* |
0.92* |
1.00 |
|||||
|
Ni |
0.99* |
0.99* |
0.99* |
0.81* |
0.90* |
1.00 |
||||
|
Zn |
0.81* |
0.81* |
0.81* |
0.79 |
0.88* |
0.81* |
1.00 |
|||
|
Cu |
0.58 |
0.58 |
0.57 |
0.27 |
0.51 |
0.56 |
0.21 |
1.00 |
||
|
Cr |
0.99* |
0.99* |
0.99* |
0.81* |
0.91* |
0.99* |
0.80 |
0.59 |
1.00 |
|
|
Cd |
0.99* |
0.99* |
0.99* |
0.80* |
0.90* |
0.99* |
0.78 |
0.60 |
0.99* |
1.00 |
Conclusion
All the ground water samples, except the water collected from Uttam Nagar (UN), are predominantly contaminated with heavy metals viz., Zn, Ni, Cr, Pb and As. The site wise variations with regard to heavy metals concentration, in the ground water could be due to various levels of anthropogenic activities and different types of contaminants. This study highlights the risk of using the ground water from BC site followed by BP, BG, NG, SP and UN for domestic consumption. Besides, the government and pollution control board may impose more rigorous and regular monitoring system of ground water in the NCR, India.
Acknowledgements
The authors would like to thank Prof. K.S. Rao, former head of the Department of Botany, University of Delhi for extending research facilities to analyze the samples in his laboratory. The authors are gratefully acknowledge the Principals of Bhaskaracharya College of Applied Sciences and Zakir Husain Delhi College, University of Delhi for their motivation.
Funding Source
No financial assistance was received for this study.
Conflict of Interest
No conflict of interest among the authors.
References
- APHA, 1998. Standard Methods for the Examination of Water and Wastewater. 20th Edition, American Public Health Association, American Water Works Association and Water Environmental Federation, Washington DC.
- Bhardwaj R, Gupta A, Garg J. Evaluation of heavy metal contamination using environmetrics and indexing approach for River Yamuna, Delhi stretch, India. Water Sci 2017; 31(1) 52-66.
CrossRef - BIS. Indian standard drinking water specification (Second revision). Bureau of Indian Standards (BIS) IS 10500New Delhi; 2012.
- Environmental Protection Agency (EPA) Method 3005A. Acid digestion of waters for total recoverable or dissolved metals for analysis by FLAA or ICP-Spectroscopy; 1998.
- Hamadneh, J, Hamadneh S, Massadeh A, Kassab M, Bayyari N, Khader Y, Sbuihat W. Blood lead level and correlation with pregnancy-associated anaemia. Australas Medical J 2018; 11(4).
CrossRef - Jaishankar M, Tseten T, Anbalagan N, Mathew B, Beeregowda K. Toxicity, mechanism and health effects of some heavy metals. Interdiscip Toxicol 2014; 7(2)60-72.
CrossRef - Madhav S, Ahamad A, Kumar A, Kushawaha J, Singh P, Mishra P. Geochemical assessment of groundwater quality for its suitability for drinking and irrigation purpose in rural areas of Sant Ravidas Nagar (Bhadohi), Uttar Pradesh. Geology, Ecology, and Landscapes 2018; 2(2)127-136.
CrossRef - Martin S, Griswold W. Human health effects of heavy metals. Environmental Science and Technology Briefs for Citizens 2009; (15): 1–6.
- Massadeh A, El-Rjoob A, Gharaibeh S. Analysis of Selected Heavy Metals in Tap Water by Inductively Coupled Plasma-Optical Emission Spectrometry After Pre-Concentration Using Chelex-100 Ion Exchange Resin. Water Air Soil Pollut 2020; 231(5).
CrossRef - Massadeh A, Hayajneh W, Shorman A, Gharaibeh M, Al-Dabet M. Correlation between lead and iron in children's blood in Jordan. Toxicol Environ Chem 2013; 95(7)1244-1255.
CrossRef - Pahlsson A. Toxicity of heavy metals (Zn, Cu, Cd, Pb) to vascular plants. Water Air Soil Pollut 1989; 47(3-4) 287-319.
CrossRef - Raessler M. The Arsenic Contamination of Drinking and Groundwaters in Bangladesh: Featuring Biogeochemical Aspects and Implications on Public Health. Arch Environ Contam 2018; 75(1) 1-7.
CrossRef - Rahman M, Paul M, Bhoumik N, Hassan M, Alam M, Aktar Z. Heavy metal pollution assessment in the groundwater of the Meghna Ghat industrial area, Bangladesh, by using water pollution indices approach. Appl Water Sci 2020;10(8).
CrossRef - Sehgal M, Garg A, Suresh R, Dagar P. Heavy metal contamination in the Delhi segment of Yamuna basin. Environ Monit 2011; 184(2)1181-1196.
CrossRef - Shanbehzadeh S, Vahid Dastjerdi M, Hassanzadeh A, Kiyanizadeh T. Heavy Metals in Water and Sediment: A Case Study of Tembi River. J Environ Public Health 2014;1-5.
CrossRef - Sharma S, Bhattacharya A. Drinking water contamination and treatment techniques. Appl Water Sci 2017;7(3),1043-1067.
CrossRef - Tomlinson DL, Wilson JG, Harris CR, Jeffney CW. Problems in the assessment of heavy metal levels in estuaries and the formation of a pollution index. Helgol. Wiss. Meeresunters 1980; (33) 566-572.
CrossRef - Hossain SS, Haque E, Pramanik AH, Uddin J, Al Harun AY. Assessing the groundwater quality and health risk: A case study on Setabganj sugar mills limited, Dinajpur, Bangladesh. Wat Sci 2020; (34) 110-123.
CrossRef - Sharma R, Singh N, Singh D. Impact of heavy metal contamination and seasonal variations on enzyme’s activity of Yamuna river soil in Delhi and NCR. Appl Water Sci 2020;10(83)1-8.
CrossRef - Sridhar S, Sakthivel A, Sangunathan U, Balasubramanian M, Jenefer S, Mohamed Rafik M, Kanagaraj G. Heavy metal concentration in groundwater from Besant Nagar to Sathankuppam, South Chennai, Tamil Nadu, India. Appl Water Sci 2017; 7(8) 4651-4662.
CrossRef - Stasinos S, Zabetakis I. The uptake of nickel and chromium from irrigation water by potatoes, carrots and onions. Ecotoxicol Environ Saf 2013; (91) 122-128.
CrossRef - Tsuji L, Karagatzides J. Chronic Lead Exposure, Body Condition, and Testis Mass in Wild Mallard Ducks. B Environ Contam Tox 2001; 67(4) 489-495.
CrossRef - Zheng Q, Ma T, Wang Y, Yan Y, Liu L, Liu L. Hydrochemical Characteristics and Quality Assessment of Shallow Groundwater in Xincai River Basin, Northern China. Procedia Earth Planet Sci 2017; (17)368-371.
CrossRef


