Assessment of Water Quality Status of Chandrabhaga River at Rishikesh, Dehradun, Uttarakhand, India
Shail Kulshrestha
*

http://dx.doi.org/10.12944/CWE.16.1.17
Copy the following to cite this article:
Kulshrestha S. Assessment of Water Quality Status of Chandrabhaga River at Rishikesh, Dehradun, Uttarakhand, India. Curr World Environ 2021;16(1). DOI:http://dx.doi.org/10.12944/CWE.16.1.17
Copy the following to cite this URL:
Kulshrestha S. Assessment of Water Quality Status of Chandrabhaga River at Rishikesh, Dehradun, Uttarakhand, India. Curr World Environ 2021;16(1). Available From : https://bit.ly/3v7jnu6
Download article (pdf) Citation Manager Publish History

Introduction
River water is a dynamic system and dissolves varieties of substances from industrial waste and domestic waste water- sewage and the access of so many substances and microorganisms leads to severe contamination of river water1. Since long, rivers are used as valuable freshwater sources for drinking cum domestic purposes, irrigation, construction, hydro power generation, water transport, fishery, water sports and in amusement parks2. Huge quantity of water is required by chemical, pharmaceutical, dyeing- bleaching, textiles, paper-pulp industries, etc. which intern release effluents containing wide varieties of chemicals and toxic metals to nearby land fill that ultimately reaches to water bodies3. Presently, most of the water resources are being polluted mainly by ever increasing population, urbanization, industrialization and other anthropogenic activities4. Anthropogenic activities and inadequate wastewater treatment facilities affect greatly water quality in the downstream sections of the rivers that causes irreversible deterioration of the river water quality5. Huge water flux during heavy rain from country sides carry with it agriculture run-off, debris, mud and humus that ultimately join water bodies. The input of wastewater from mining cum metallurgical operations containing toxic metals on reaching to water bodies and soils may also percolate to ground water sources6.
The quality of river water varies spatially and temporally due to the variation in its composition and concentrations of the components1, and by a wide range of natural and human influences7. Exploitation of water resources to meet the demand with the exponential population growth and supported by industrialization and urbanization put water resources under great threat both in terms of quality as well as quantity8. The surface run-off during the rainy season also affects river water quality as it effects the concentration of river water pollutants8. Presently, rivers have become dumping ground for industrial wastewater, municipal waste, agri-runoff and even for sewage. Municipal and industrial wastewater discharge constitutes a constant polluting source, whereas surface runoff is a seasonal phenomenon9. The composition of surface and underground water depends on topographical, hydrological and biological factors and varies with seasonal differences in runoff volumes, weather conditions and water levels1. As water flows through the various geological environments, the site-wise and seasonal variation in water quality is governed by soil, geology, climate and anthropogenic activities that keep modifying the composition of dissolved materials and other parameters10.
The River Ganga, after originating at Gaumukh (30°362 N, 79°042 E) in the snout of the Gangotri glacier as Bhagirathi river in the Himalayas at an elevation of 4356 m11 and passing nearly 250 Km through narrow Himalayan valley, emerges at Rishikesh and then flows to the flat and fertile Gangetic plain, before merging in the Bay of Bengal at Ganga Sagar, covering the journey over 2500 km12. During the journey, Ganges gets polluted due to atmospheric deposition, erosion, and weathering of crustal materials and anthropogenic activities such as sewage, industrial effluents, and agricultural run-off7. The River Ganga basin is one of the most densely populated river basins in the world10 and religious bathing, tourism, Kanvar and Kumbh mela, crematoria are major activities ar responsible which are causing higher pollution load to River Ganga13.
In view of the commitment of the Indian Government to protect the River Ganga, the objective of this study was to assess the status of the Chandrabhaga river water quality within the Rishikesh municipal area between Dhalwala Bridge and Mayakund area, where it merges with the river Ganga. The Chandrabhaga water quality was evaluated in terms of various physicochemical and biological parameters and SSP, SAR, MAR and Kelly’s Ratio were also evaluated to test the suitability of river water for irrigation purpose. Seasonal and site wise variations in parameters were observed by weekly monitoring five sampling stations (S1 to S5) during July to September in the year 2017. The Pearson Correlation coefficients were evaluated to find the inter-relations among parameters. The obtained data may be used later to find out the influence of Chandrabhaga water on Ganges water quality at the confluence point.
Material and Method
Description of the Study Area
Rishikesh is gateway to pilgrimage to Badrinath, Kedarnath, Hemkund Sahib, Gangotri, and Yamunotri and trekking destinations to Pawali Kantha, Dodital, Harsil, Dayara Bugyal, Goumukh, Auli, Valley of Flowers and many more14. The latitude of Rishikesh is 30.08690 N and the longitude is 78.26760 E and the elevation above sea level is 356 m. The Chandrabhaga River emerges out of Banali- Kashmalidhar, nearly 1800 m from sea level, in district Tehri, Uttarakhand, India. It first flows South West about 15 km then from Gujrada in south, then North East nearly 5 Km and finally South East when it merges with river Ganges at Mayakund, Rishikesh. Once, a perennial stream it gradually faded away due to huge deposition of heavy bolders and deep sand bed brought during high flow months with fast flowing rain water from high hilly area to the plains of Rishikesh, making a deep sand bed throughout. Due to seepage of in the deep sand bed, the river water loses its appearance in the dry season. The study area is consisting of Simla group, Karol Group and Garhwal group of rocks which are delineated by Krol Nappe15. The Blaini formation of Krol group is exposed near Muni Ke Reti, Rishikesh. The rocks are folded and faulted due to which they show overlapping over many formations15,16. Friction clays and carbonaceous matter are observed near Ganges- Chandrabhaga Confluence on the left bank of river Ganges, Rishikesh where southwest- directed thrusting along a shear plane is observed in the river terraces17. The substratum of the river at upstream and somewhat middle segment consists of bedrocks, boulders and gravels while it is composed of sand, silt and clay at downstream.
The mining activities are restricted in Chandrabhaga river bed, yet the river bed from Dhalwala bridge area ( 30.117367N, 78.286590E) to Maya Kund area (30.104462 N, 78.307146E) witnessed immense human activities. The hotels – restaurants, brick depots, dozens of unauthorized automobile vehicle washing Tulu pumps, small diaries and hundreds of unauthorized jhuggi-jhoperies (temporary settlements) made by slum dwellers, migrants and seasonal labours on both the banks of the river that directly discharge their refuse and other domestic waste in open, ultimately reaching to the Ganges. In rainy season, the open areas - street runoffs, vehicle washings, dung water, bricks and construction waste reaches to the river bed that deteriorates the hydro-biological quality of river water. In addition to the several households and commercial openings on the Risikesh city side bank of Chandrabhaga river, fifteen Nalahs and drains in Dhalwala- Muni Ki Reti side river bank carry sewage and storm water that finally reaches into river Ganga18. In Rishikesh town, in addition to existing STP at Swargashram, Lakkarghat10 and IDPL (with total 23 MLD capacity), two STPs of 5MLD at Chorpani, Muni Ki Reti and four-storied 7.5 MLD capacity at Chandrashwar Nagar were inaugurated by the Prime Minister in September, 2020 to treat sewer of respective areas, yet tapping of various Nalahs releasing domestic waste water directly in the river bed, are to be undertaken to avoid their discharge in Chandrabhaga river bed that reaches finally to the River Ganges10. The climate of Rishikesh is humid subtropical with heavy precipitation during July –August. Minimum, maximum and average temperatures during the study period were, 230C, 310C and 280C, in July 2017, 230C, 300C, and 270C, in August and 210C, 290C and 260C in September, 2017. The reported average rain fall during this period was 161.02 in July 2017, 200.8 in August2017 and 72.02 mm in September, 201719.
 |
Figure 1: (a) Map of India, (b) Map of Uttarakhand and (c) Google Map showing locations of Sampling Sites (S1 to S5) in Chandrabhaga River, Rishikesh, Uttarakhand, India. Click here to view Figure |
Collection of Water Samples
In all 60 samples were collected on weekly basis, during July to September, 2017, from five sampling sites (S1 to S5) selected on Chandrabhaga River in Rishikesh municipal area between Dhalwala bridge and Mayakund area, before it merges with the River Ganga, as per standard methods of sampling techniques20, 21. The identified sampling sites (S1 to S5) were among the heavy garbeged and most encroached segments of Chandrabhaga River (Fig. 1): S1 (Dhalwala bridge area), S2 (near Gopal Nagar), S3 (near Roadways bus stand), S4 (Chandrabhaga bridge area) and S5 (Mayakund area). To cover the seasonal variations, three sampling surveys were undertaken, one during July (low flow period), other during August (high flow period) and the third during September (least flow period). The brand new transparent polythene cans were used for collection of water samples. The cans were cleaned using non-ionic detergent, rinsed with tap water and finally with distilled water. Prior to use, cans were thoroughly rinsed with the water sample to be collected. For the estimation of dissolved oxygen and biochemical oxygen demand, dried, cooled, sterilized and labeled BOD bottles were used. All necessary precautions were taken during sampling and transportations of samples to the laboratory.
Analysis of Water Samples
The pH and dissolved oxygen (DO) of collected samples were analyzed on the spot by following standard procedures, using WTW OXI 3205 Portable DO Meter and EUTECH pH Meter. Determination of total dissolved solids (TDS), electric conductivity (EC), biological oxygen demand (BOD5), total hardness (TH), total alkalinity, chloride, nitrate, and phosphate were done in the laboratory as per standard procedures 20-23. The BOD was estimated by the modified Winkler method, using WTW OXI Top IS 16 BOD Meter. Alkalinity was determined by titration method and TH by complex-metric titration method. Conductivity was measured on Cyber Scan CON 700 Conductivity Meter. TDS was determined by the evaporating the sample in a weighed dish to constant weight in an oven at 105°C. Chloride was determined by Argentometric titration method. Phosphate and nitrate were estimated spectrophotometerically using Carry 60 UV-Vis spectrometer (Agilent). Total coliforms were determined following the standard methods21, 24 as MPN per 100 ml. Each analysis was done in triplicate and the mean value was taken. The sodium, potassium, calcium and magnesium were estimated by using PerkinElmer Atomic Absorption Spectrometer, Analyst-200. The standard stock solutions of metal ions used were procured from Sigma-Aldrich. All the reagents, solvents and chemicals used were of analytical grade. Doubly- distilled water was used for all purposes.
Result and Discussion
The results of various water quality parameters of the Chandrabhaga River water, between Dhalwala Bridge and Maya kund area in Rishikesh are presented in Table- 1. The river water quality is affected by a wide range of natural and human influences1. As water flows through the various geological environments, the variation in water quality is governed by soil, geology, climate and anthropogenic activities that modify the composition of dissolved materials10.
Hydrogen Ion Concentration (pH)
As per Table 1, the observed pH values varied from 7.13±0.03 to 8.16±0.03 and all are within the WHO desirable range. The higher values of pH indicate slightly alkaline nature of water samples. The order of seasonal variation in pH was September > July > August. During heavy rain, water dissolves atmospheric carbon dioxide that forms a weak carbonic acid and lowers the pH25, thus during high flow month (August) at all the sampling locations pH were lower than other months.
Total Dissolved Solids (TDS)
The permissible limits of TDS in water for drinking purpose and for irrigation is up to 1,000 mg/L and 2,000 mg/L respectively, while water with TDS above 3,000 mg/L are not suitable even for irrigation26. The observed values of TDS, as shown in the Table 1 and Fig.2 varied from 680 ±5.52 to 1290 ±11.18 mg/L. The recorded TDS values during high flow month (August) were higher than during low flow months at all the locations.
Electrical Conductivity (EC)
All the observed values of conductivity, (Table 1, Fig.2) were above WHO standard that varied from 1214 ±7.81 to 1362 ±11.29 µS/cm, from 1320 ±9.16 to 1380±13.22µS/cm and from 1416 ±8.89 to 1532 ±10.44 µS/cm during July, August and September respectively. Such higher values of EC may be attributed to the high degree of anthropogenic activities as wastewater from domestic sewage often contains high amounts of dissolved salts10, 27.
Total Hardness (TH)
Total hardness of water is due to bicarbonate, sulphate, chloride, and nitrates of Ca and Mg and expressed as mg/L of calcium carbonate 26, 28. Desirable limit for total hardness as per Indian standards is 300 mg/L. As per Table 1 and Fig.2, total hardness observed during July varied from 267 ±8.66 to 312 ±8.72 mg/L and during September varied from 286 ±8.18 to 388 ±11.27 mg/L. While, during high flow month (August) TH varied from 242 ±8.72 to 290 ±6.10 mg/L.
Table 1: Site wise values of various parameters of Chandrabhaga River at Rishikesh (Values are as mean ± standard deviation)
|
Parameters |
S1 |
S2 |
S3 |
S4 |
S5 |
Standards 23,34 |
|
|
pH
|
July |
7.53 ± 0.04 |
7.68 ±0.04 |
7.82 ±0.04 |
7.95 ±0.03 |
7.56 ±0.03 |
7.0-8.5 (WHO) |
|
August |
7.13 ±0.03 |
7.22 ±0.03 |
7.38 ±0.04 |
7.46 ±0.03 |
7.78 ±0.03 |
||
|
Sept. |
7.65 ±0.04 |
7.91 ±0.06 |
7.88 ±0.06 |
7.92 ±0.04 |
8.16 ±0.03 |
||
|
TDS , mg/L |
July |
790 ±4.64 |
814 ±7.24 |
784 ±7.21 |
916±5.52 |
680 ±5.52 |
500 (WHO) |
|
August |
980 ±8.09 |
1186 ±9.08 |
1151±11.72 |
1214±9.30 |
1290 ±11.18 |
||
|
Sept. |
876 ±8.34 |
824 ±7.81 |
736 ±6.44 |
916 ±8.19 |
791 ±8.12 |
||
|
EC, µS/cm
|
July |
1214 ±7.81 |
1278 ±11.27 |
1317 ±13.38 |
1330 ±10.58 |
1362 ±11.29 |
500 (WHO) |
|
August |
1320 ±9.16 |
1360 ±12.48 |
1345 ±9.84 |
1350 ±11.13 |
1380±13.22 |
||
|
Sept. |
1506 ±12.29 |
1492 ±9.64 |
1416 ±8.89 |
1532 ±10.44 |
1488 ±10.58 |
||
|
TH, mg/L |
July |
299 ±10.27 |
306 ±10.02 |
310 ±9.87 |
312 ±8.72 |
267 ±8.66 |
100 (WHO) |
|
August |
242 ±8.72 |
248 ±9.54 |
264 ±10.79 |
276 ±8.89 |
290 ±6.10 |
||
|
Sept. |
381 ±9.54 |
338 ±10.15 |
286 ±8.18 |
388 ±11.27 |
326 ±10.58 |
||
|
Alkal- inity mg/L |
July |
131 ±8.12 |
142 ±8.16 |
155 ±8.76 |
164 ±8.54 |
148 ±7.81 |
100 (WHO) |
|
August |
118 ±7.0 |
136 ±8.18 |
129 ±7.81 |
132 ±8.72 |
128 ±6.24 |
||
|
Sept. |
165 ±9.11 |
158 ±9.15 |
154 ±8.72 |
162 ±9.64 |
157 ±9.34 |
||
|
DO, mg /L |
July |
0.7 ±0.03 |
0.4 ±0.01 |
0.7 ±0.04 |
0.4 ±0.01 |
0.5±0.01 |
5.0 (WHO) |
|
August |
0.7 ±0.02 |
0.7 ±0.01 |
0.9 ±.0.02 |
0.7 ±0.01 |
0.8 ±0.01 |
||
|
Sept. |
1.15 ±0.07 |
1.28±0.072 |
1.22 ±0.061 |
1.26±0.065 |
1.29±0.062 |
||
|
BOD, mg/L |
July |
52 ±5.29 |
49 ±5.19 |
56 ±6.08 |
50 ±5.19 |
46 ±4.36 |
28-30 (WHO) |
|
August |
21 ±2.64 |
26 ± 3.0 |
23 ±2.64 |
21 ±3.0 |
24 ±2.64 |
||
|
Sept. |
25 ±3.60 |
28 ±3.46 |
32 ±2.64 |
29 ±2.64 |
36 ±3.24 |
||
|
Coli forms, MPN |
July |
2870 ±26.46 |
2910 ±22.91 |
2960 ±27.61 |
3070 ±21.79 |
3180 ±27.61 |
Nil/ 100 ml (WHO) |
|
August |
2310 ±17.32 |
2490 ±23.72 |
2465 ±21.79 |
2635 ±24.75 |
2860 ±22.91 |
||
|
Sept. |
1870 ±13.23 |
1760 ±13.23 |
1830 ±14.80 |
1920 ±17.32 |
1800 ±13.23 |
||
|
NO3- mg/L |
July |
39.20 ±4.52 |
37.50 ±4.35 |
42.40 ±5.41 |
52.60 ±6.33 |
49.80 ±5.61 |
45 (BIS) |
|
August |
19.26 ±4.65 |
24.60 ±4.33 |
23.82 ±3.97 |
20.46 ±2.84 |
21.20 ±2.74 |
||
|
Sept. |
34.16 ±4.84 |
39.42 ±5.05 |
36.50 ±4.06 |
38.64 ±4.55 |
40.28 ±4.51 |
||
|
Cl- mg/L |
July |
66.4 ±10.48 |
76.2 ±10.70 |
69.8 ±11.12 |
63.6 ±7.50 |
84.3 ±9.21 |
250 (WHO) |
|
August |
28.1 ±6.24 |
36.7 ±4.96 |
34.5 ±4.56 |
26.8 ±3.57 |
38.4 ±4.70 |
||
|
Sept. |
42.6 ±5.37 |
56.5 ±6.41 |
50.4 ±7.12 |
46.2 ±5.57 |
62.5 ±7.49 |
||
|
PO4-3, mg/L |
July |
0.16 ±0.02 |
0.16 ± 0.01 |
0.18 ±0.02 |
0.17 ±0.01 |
0.21 ±0.02 |
0.10 (WHO) |
|
August |
0.12 ±0.01 |
0.13 ±0.02 |
0.14 ±0.02 |
0.13 ±0.01 |
0.14 ±0.01 |
||
|
Sept. |
0.13 ±0.01 |
0.15 ±0.02 |
0.14 ±0.01 |
0.15 ±0.02 |
0.16 ±0.017 |
||
|
Na+, mg/L
|
July |
46.6 ±5.96 |
50.8 ±6.49 |
54.4.2±4.59 |
60.5±5.54 |
57.4±5.50 |
20 mg/L (WHO) |
|
August |
19.2 ±1.74 |
21.6 ±2.06 |
24.8±2.17 |
28.2±3.20 |
21.8±2.17 |
||
|
Sept. |
24.8 ±2.27 |
29.2 ±2.68 |
31.4 ± 1.50 |
34.6 ± 1.78 |
26.2 ±1.30 |
||
|
K+, mg/L |
July |
21.6 ±2.08 |
14.8 ± 1.47 |
13.9 ±1.47 |
15.7 ±1.55 |
16.2 ±1.30 |
12 mg/L (BIS) |
|
August |
11.3 ±1.31 |
10.6 ±1.21 |
12.8 ±1.30 |
10.4 ±1.21 |
11.5 ±0.95 |
||
|
Sept. |
7.6 ±1.05 |
8.2 ±0.95 |
9.8 ±1.13 |
9.6 ±1.30 |
8.7 ±0.95 |
||
|
Ca+2, mg/L |
July |
156 ±9.53 |
142 ±9.64 |
151 ±9.60 |
162 ±10.44 |
149 ±9.56 |
75 mg/L (BIS) |
|
August |
82.4 ±5.29 |
67.6 ±4.34 |
78.2 ±8.78 |
89.6 ±6.24 |
71.4 ±4.94 |
||
|
Sept. |
59.6 ±3.65 |
46.4 ±3.50 |
42.8 ±4.32 |
51.3 ± 3.72 |
39.8 ±3.36 |
||
|
Mg+2, mg/L |
July |
23.6 ±1.90 |
18.3 ±1.83 |
17.3 ±2.11 |
17.6 ±1.61 |
19.4 ±1.65 |
30 mg/L, (BIS) |
|
August |
8.6 ±1.47 |
7.2 ±1.38 |
6.5 ±0.70 |
8.3 ±1.30 |
7.6 ±1.13 |
||
|
Sept. |
14.7 ±1.47 |
15.2 ±1.38 |
16.8 ±1.47 |
17.2 ±1.38 |
15.9 ±1.38 |
||
Total Alkalinity
Total Alkalinity of water is its capacity to neutralize a strong acid and it is normally due to the presence of bicarbonate, carbonate, phosphate, borate, silicate and hydroxides of Ca, Na and K.
Total alkalinity is due to salts of weak acids and bicarbonates28. The alkalinity is expressed in term of CaCO3 equivalent. Alkalinity of all samples, were much higher than the WHO limit. The values (Table1, Fig.2) during July varied from 131 ±8.12 to 164 ±8.54 mg/L, while during September, varied from 154 ±8.72 to 165 ±9.11 mg/L, and during high flow month the alkalinity values varied from 118 ±7.0 to 136 ±8.18. The high values of alkalinity during September (least flow month) as compared to July may be due to higher input of contaminants.
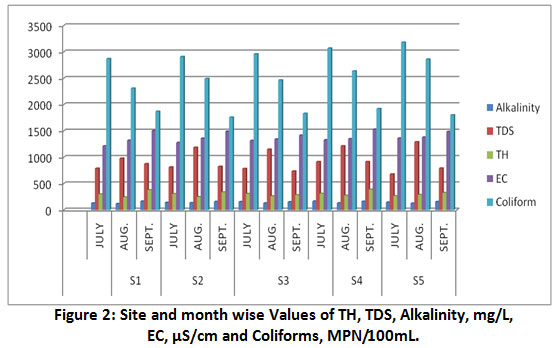 |
Figure 2: Site and month wise Values of TH, TDS, Alkalinity, mg/L, EC, µS/cm and Coliforms, MPN/100mL. Click here to view Figure |
Total Coliforms
The sources of Coliforms are live stocks, septic systems, manure, and household waste water25. Coliforms in a water sample are undesirable and its presence in water is indicator of the contamination of human or animal facial waste that causes water-borne diseases such as diarrhea, typhoid and hepatitis31. As per Table 1 and Fig.2, the observed values of Coliforms are quite high in all the seasons that varied from 1760±13.23 to 3180±27.61 MPN/100 ml. The evidence of such a high value of Total Coliforms is that the river bed is subjected to encroachment by slum dwellers discharging their excreta in open.
Biochemical Oxygen Demand (BOD5)
BOD is the oxygen required by aerobic organisms to decompose organic matter present in water samples. It reflects the contamination in water bodies due to inputs of the nutrients, food, plants and animals. Higher is the BOD, the more rapid is the depletion of the dissolved oxygen in the river water29. The BOD during July varied from 46 ±4.36 to 52 ±5.29 mg/L that falls considerably during high flow month (August) ranging from 21 ±2.64 to 26 ± 3.0 mg/L. This may be due to dilution and decomposition of contaminants by fast flowing huge flux of water that may carry with it garbage. The BOD showed increasing trend during the least flow month of September and varied from 25 ±3.60 to 36 ±3.24 mg/L, which may be due to added organic matters and inorganic nitrogen from domestic waste waters and dairy effluents28.
Dissolved Oxygen (DO)
The DO value of a water body reflects its self-purification capacity and organic matter in it27. The flowing river water have DO approximately 8 mg/L, values lower than this indicate the presence of considerable organic contaminants in water samples28. The recorded values (Table 1, Fig.3) of DO varied from 0.4 ±0.01 to 1.29±0.062 mg/L, such a low DO is attributed to the heavy load of wastewater and sewage in the river-bed. The use of pesticides and chemical fertilizers in agricultural runoff increases the inputs of nitrate and phosphates that increases microbial activities to decompose organic matter30. A water body that is rich in such nutrients flourishes algal growth that consumes much of the DO from river water25.
Chloride (Cl-)
Chloride enters in water due to dissolution of salt deposits, discharges of industrial and domestic effluents, sewage, fertilizers, agricultural and irrigation runoff. High chloride content is harmful to soil bacteria and plants and galvanized iron pipes used in domestic water supply system32. Chloride concentrations in all the samples collected were well below the WHO permissible limit and varied from 26.8±3.57 to 84.3±9.2 mg/L.
Nitrate (NO3-)
The presence of nitrates in the water samples is suggestive of some bacterial action and bacterial growth 33. The WHO guideline value for nitrate in drinking-water is 50 mg/L as nitrate ion34. Algae and bacteria undergo atmospheric nitrogen fixation in nitrates35. The concentration of nitrate in water samples varied from 19.26±4.65 to 52.60±6.33 mg/L. The observed values of nitrate were lowest (19.26 ±4.65 to 24.60 ±4.33 mg/L) 36 in August (high flow month) that varied from 37.50 ±6.15 to 52.60 ±8.95 and 34.16 ±6.84 to 40.28 ±6.38 mg/L, during July and September 2017, respectively.
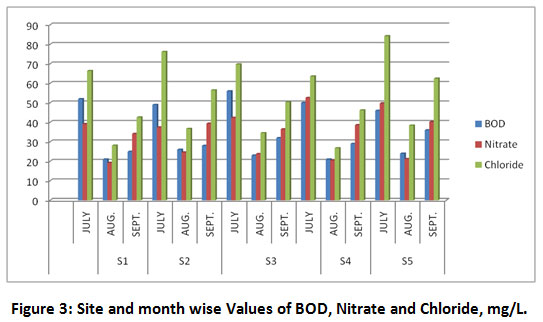 |
Figure 3: Site and Month Wise Values of BOD, Nitrate and Chloride, mg/L. Click here to view Figure |
Phosphate (PO4 3-)
Phosphate occurs in river water mainly due to detergents and fertilizers. Phosphorus in low concentration is essential for the growth of organisms37; however its high concentration favours high algal growth that during decay leads the depletion of dissolved oxygen35. Overall phosphate ranges from 0.12±0.01 to 0.21±0.02 mg/L (Table 1).
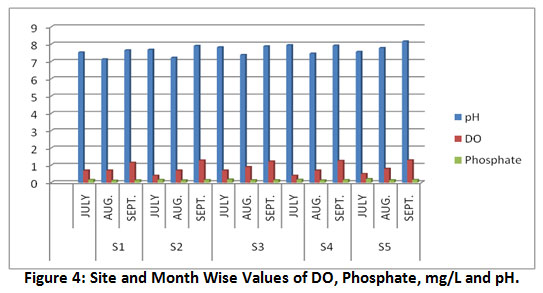 |
Figure 4: Site and Month Wise Values of DO, Phosphate, mg/L and pH. Click here to view Figure |
Metal Ions
The results of metal ion concentrations are presented in Table-1 and Fig. 5. Sodium is used to classify irrigation water, due to its reaction with soil, which reduces its permeability10. The observed values of sodium in water samples vary from 19.2 ±2.43 to 60.5±6.42 mg/L. Important sources of potassium are weathering of rocks, silicate minerals and domestic waste6. The high concentration of potassium in natural water is an indication of pollution by domestic waste10. The observed concentration of potassium varied from 7.6 ±1.15 to 21.6 ±2.36 mg/L. The concentration of calcium varied from 39.8 ±3.39 to 162 ±12.16 mg/L. The high level of calcium indicates the high value of hardness of water. The observed values of magnesium varied from 6.5 ±0.79 to 23.6 ±2.17 mg/L
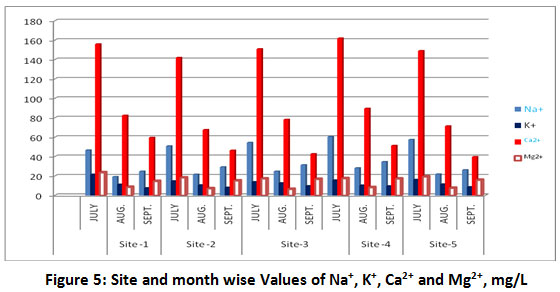 |
Figure 5: Site and month wise Values of Na+, K+, Ca2+ and Mg2+, mg/L. Click here to view Figure |
Pearson Correlation Matrix
Karl Pearson Correlation analysis (r) was computed in order to find out the closeness of relationship between the water quality parameters and the results are presented in Table- 2.
Some of the highly positive correlations observed were between EC and TDS (r = 0.9463, 0.9511 and 0.9356), between TH and TDS (r = 0.9074, 0.8336 and 0.9888) and, between TH and EC (r = 0.7670, 0.7396 and 0.9330) during July, August and September respectively. Alkalinity is positively correlated during August with pH (r = 0.8216), TDS (r = 0. 9514), EC (r = 0.9994) and TH (r = 0.7540) and Coliforms (r = +0.9114) during high flow month, August. DO is positively correlated with pH (r = 0.5999 and 0.8207) during August and September. BOD is positively correlated with DO (r = 0.5512, 0.564 and 0.564) during July, August and September. Coliforms is positively correlated with DO (0.6088 and 0.8025) during July and August. Nitrate is negatively correlated with TDS (r = - 0.7032), EC (-0.5846) and TH (-0.9139) during July. Chloride is positively correlated with TDS (r = 0.5595), EC (r = 0.6433) and Alkalinity (r = 0.6095) during August. The closeness of correlation coefficient value, r to 1 indicates perfect linear relationship between two selected water quality parameters.
Table 2: Correlations Matrix of Chandrabhaga River.
|
Para meters |
pH |
TDS |
EC |
DO |
BOD |
TH |
Coli form |
Alka linity |
NO3- |
Cl- |
PO4-3 |
||
|
|
During July, 2017 |
|
|||||||||||
|
pH |
1.0000 |
|
|
|
|
|
|
|
|
|
|
||
|
TDS |
0.7616 |
1.0000 |
|
|
|
|
|
|
|
|
|
||
|
EC |
-0.1921 |
0.9463 |
1.0000 |
|
|
|
|
|
|
|
|
||
|
DO |
0.4876 |
-0.1381 |
-0.4213 |
1.0000 |
|
|
|
|
|
|
|
||
|
BOD |
0.3688 |
0.1959 |
-0.2225 |
0.5512 |
1.0000 |
|
|
|
|
|
|
||
|
TH |
0.6445 |
0.9074 |
0.7670 |
-0.6869 |
0.8510 |
1.0000 |
|
|
|
|
|
||
|
Coli- form |
0.7705 |
0.0775 |
0.3919 |
0.6088 |
0.3206 |
-0.1939 |
1.0000 |
|
|
|
|
||
|
Alkal- inity |
0.8829 |
0.8934 |
0.9790 |
-0.4126 |
0.3328 |
0.6835 |
0.4490 |
1.0000 |
|
|
|
||
|
NO3- |
0.4439 |
-0.7032 |
-0.5846 |
0.5263 |
-0.7108 |
-0.9139 |
0.1919 |
-0.528 |
1.0000 |
|
|
||
|
Cl- |
-0.4256 |
0.4660 |
0.3802 |
-0.7597 |
0.0403 |
0.2379 |
-0.2398 |
0.4407 |
0.0438 |
1.0000 |
|
||
|
PO4-3 |
-0.1865 |
0.2623 |
0.2192 |
-0.3589 |
0.0727 |
-0.0391 |
-0.0741 |
0.2003 |
0.4321 |
0.7671 |
1.0000 |
||
|
|
During August, 2017 |
|
|||||||||||
|
pH |
1.0000 |
|
|
|
|
|
|
|
|
|
|
||
|
TDS |
0.8366 |
1.0000 |
|
|
|
|
|
|
|
|
|
||
|
EC |
0.8081 |
0.9511 |
1.0000 |
|
|
|
|
|
|
|
|
||
|
DO |
0.5999 |
0.7940 |
0.9368 |
1.000 |
|
|
|
|
|
|
|
||
|
BOD |
0.8089 |
0.8089 |
0.6879 |
0.564 |
1.000 |
|
|
|
|
|
|
||
|
TH |
0.9765 |
0.8336 |
0.7396 |
0.358 |
-0.512 |
1.0000 |
|
|
|
|
|
||
|
Coli- form |
0.8216 |
0.9146 |
0.8981 |
0.8025 |
0.5407 |
0.9346 |
1.0000 |
|
|
|
|
||
|
Alkal- inity |
0.8216 |
0.9514 |
0.9994 |
0.7556 |
0.7284 |
0.7540 |
0.9114 |
1.0000 |
|
|
|
||
|
NO3- |
-0.0723 |
0.3457 |
0.3818 |
0.0437 |
0.7400 |
-0.862 |
0.4461 |
0.3487 |
1.0000 |
|
|
||
|
Cl- |
0.1990 |
0.5595 |
0.6433 |
0.7595 |
0.1675 |
-0.0635 |
0.0093 |
0.6095 |
0.4975 |
1.0000 |
|
||
|
PO4-3 |
0.7549 |
0.7713 |
0.2797 |
0.2489 |
0.7244 |
0.4854 |
-0.2874 |
0.2727 |
-0.0058 |
0.5298 |
1.000 |
||
|
|
During September, 2017 |
|
|||||||||||
|
pH |
1.0000 |
|
|
|
|
|
|
|
|
|
|
||
|
TDS |
-0.3623 |
1.0000 |
|
|
|
|
|
|
|
|
|
||
|
EC |
-0.0677 |
0.9306 |
1.0000 |
|
|
|
|
|
|
|
|
||
|
DO |
0.8207 |
0.2143 |
0.4473 |
1.0000 |
|
|
|
|
|
|
|
||
|
BOD |
0.5980 |
0.1709 |
0.2144 |
0.8981 |
1.0000 |
|
|
|
|
|
|
||
|
TH |
-0.3938 |
0.9888 |
0.9330 |
-0.8132 |
0.0876 |
1.0000 |
|
|
|
|
|
||
|
Coli- form |
-0.3756 |
0.6430 |
0.4151 |
0.0610 |
0.4838 |
-0.8683 |
1.0000 |
|
|
|
|
||
|
Alkal- inity |
-0.5988 |
0.8982 |
0.7998 |
-0.1413 |
-0.1573 |
-0.4521 |
0.4775 |
1.0000 |
|
|
|
||
|
NO3- |
0.9026 |
-0.124 |
0.1676 |
0.5914 |
0.5194 |
-0.2331 |
0.3151 |
-0.6834 |
1.0000 |
|
|
||
|
Cl- |
0.8747 |
-0.548 |
-0.213 |
-0.2679 |
0.1374 |
0.5139 |
-0.5509 |
0.4140 |
0.8215 |
1.0000 |
|
||
|
PO4-3 |
0.9550 |
-0.133 |
0.1707 |
-0.3807 |
0.5968 |
0.5938 |
-0.6463 |
0.3434 |
0.5205 |
0.8297 |
1.0000 |
||
Irrigation Water Quality
The suitability of water for irrigation is determined by the total concentration of salt present and the kind of salts38. By interrelating observed concentrations of some parameters some important irrigation water quality indexes are evaluated.
Soluble Sodium Percentage (SSP)
Soluble sodium percentage (SSP) as meq /L was calculated from the Todd equation39.
SSP = (Na+ + K+) x 100/ (Ca+2 + Mg+2 + Na+ + K+)
On the basis of SSP values are irrigation water categories may be excellent, good, permissible, doubtful, and unsuitable. In the present study the SSP values (Table 3) varied from 20.97 to 25.10 %, indicating the river water samples had good quality (20- 40 % Na) for irrigation purpose.
Sodium Adsorption Ratio (SAR)
Sodium adsorption ratio (SAR) is related to the amount of sodium in relation to the calcium and magnesium concentration in water. The SAR of water mainly depends on soil type, texture, drainage capacity. Mathematically, SAR is the ratio of the sodium concentration and the square root of half of the total concentration of calcium and magnesium in water. It was calculated using the Raghunath equation40, in which the concentration of the ions was expressed in meq /L.
SAR = Na+/ √ (Ca2+ + Mg2+) /2
Higher values of sodium in water sample may alter the permeability of soil and reduce or stop water from moving into soil. Water with SAR < 3 is best for plant growth. SAR values (Table 3) were varied from 1.28 to 1.75.
Magnesium Adsorption Ratio (MAR) or Magnesium Hazard (MH)
Magnesium concentration is important for productivity of soil therefore it determines the suitability of water under study for irrigation. Magnesium adsorption ratio (MAR) was calculated by using following expression39.
MAR = Mg2+ / (Ca2+ + Mg2+) x 100, where cation concentrations are expressed in meq /L.
The observed MAR results (Table 3) were between 19.12 and 21.58. Water with Magnesium hazard less than 50 is considered safe and suitable for irrigation purpose10, higher value than this has an adverse effect on the crop yield as the soil becomes more alkaline38.
Kelley’s Ratio (KR)
The level of Na+ measured against Ca+2 and Mg+2 is known as Kelley’s ratio (KR) that is used for rating irrigation water. KR is calculated using following expression41.
Kelley Ratio = Na+/ (Ca+2 + Mg+2)
All the values of Kelley’s ratio (Table 3) varied from 0.209 to 0.286 suggesting that river water is not unfit for irrigation purpose10.
Table 3: Irrigation Water Quality of Chandrabhaga River water.
|
Collection Sites |
SSP |
SAR |
MAR |
KR |
|
S1 |
20.97 |
1.28 |
20.79 |
0.209 |
|
S2 |
24.52 |
1.55 |
20.94 |
0.273 |
|
S3 |
25.06 |
1.61 |
19.91 |
0.282 |
|
S4 |
25.1 |
1.75 |
19.12 |
0.286 |
|
S5 |
24.99 |
1.59 |
21.58 |
0.276 |
Conclusion
Under National Mission for Clean Ganga Project, the focus is to clean and protect the River Ganga in a comprehensive manner, with the priority to build sewage pumping stations (SPS) and sewage treatment plants (STP) as long term requirement along the Ganga route to block the pollutants going into the river. Yet tapping of various Nalahs releasing domestic waste water directly in the river bed are to be undertaken to avoid their discharge in Chandrabhaga river bed that reaches finally to the River Ganges. The analytical results of water quality parameters studied revealed that in the Chandrabhaga River water, much low DO values that varied from 0.4 to 1.29 mg/Lwith high BOD and much high total Coliforms at all the sampling locations reflects the poor water quality of the River. However, recorded values of TDS, EC, TH, alkalinity and phosphate exceeded the WHO standards. TDS values during high flow month of August at all the sampling sites recorded higher than in low flow months. Highly positive correlations were found all the time between EC and TDS, TH and TDS, TH and EC, while during high flow month good correlations were recorded between alkalinity and pH, TDS, EC, Coliforms and TH. Thus continuous charging of the urban and agricultural runoff and sewage directly in the river bed has lead to the irreversible degradation of the quality of Chandrabhaga water. Further, merging of such highly contaminated river water directly with the Ganges at Mayakund area is deteriorating the River Ganges water quality. To prevent the merging of waste water and domestic effluents in River Ganges, all the nallahs and outlets on both the banks of Chandrabhaga River should be connected with sewage pumping stations (SPS) or STP.
Acknowledgement
The author expresses her sincere thanks to the Principal D. B. S. (P.G.) College, Dehradun, for providing research facilities and Dr. Dayadhar Dikshit, Pt. L. M. S. Govt. Post Graduate. College, Rishikesh, for useful suggestions and help in analysis of metal ions.
Funding
The author received no financial support for this research work and for publication of this article.
Conflict of Interest
There is no conflict of interest.
References
- Kaul S. N, and Gautam A. Water and Waste Water Analysis. Daya Publishers, Delhi 2004.
- Sehgal, M., Garg, A., Suresh, R. and Dagar, P. 2012. Heavy metal contamination in the Delhi segment of Yamuna basin. Environ. Monit Assess. 2012; 184 (2): 1181-96.
CrossRef - Kulshrestha Shail, Awasthi Alok and Dabral S. K. Assessment of Heavy Metals in the Industrial Effluents, Tube Well and Municipal Supplied Water of Dehradun, India J. Environ. Science & Engg. 2013; 55(3): 290-300.
- Kumar Santosh T. M. and Prakash K.L. Surface Water Quality in the forest catchment- A case study of Tunga and Bhadra River stretches, Karnatak, Current World Environ. 2020; Vol. 15(2): 227- 234.
- Chang Heejun Spatial analysis of water quality trends in the Han River basin, South Korea, Water Research 2008; 42 (13): 3285–3304.
CrossRef - Singh V. P. Toxic Metals and Environmental Issues, 2005. Sarup & Sons, New Delhi.
- Pandey, J. and Singh, R. Heavy metals in sediments of Ganga River: up-and downstream urban influences. Appl. Water Sci. 2017; Vol. 7(4): 1669-1678.
CrossRef - Kumar R, Chauhan A, Rawat L (2017) Physico-chemical Analysis of Surface and Ground Water in Selected Sites of Dehradun, Uttarakhand, India. J Environ Anal Toxicol. 2017; Vol. 6: 420. doi: 10.4172/2161-0525.1000420.
CrossRef - Sharma M. K., Jain C.K. and Singh O. Characterization of point sources and water quality assessement of River Hindon using water quality index, J. Indian Water Res. Soc. 2014; Vol. 34 (1): 33-39, 53.
- Haritash A. K., Gaur Shalini, Garg Sakshi. Assessment of water quality and suitability analysis of River Ganga in Rishikesh,India. Applied Water Science. 2016; 6(4): 388- 392.
CrossRef - Vidyarthi, Kumar Ajit , Rana Vivek, Dublish Garima and Biswas Mirnal Kant, Water Quality of the River Ganga during Mass Ritualistic Bathing on Ardh Kumbh in Prayagraj, India, Poll Res. 2020; Vol. 39 (November Suppl. Issue) : S55-S58.
- Singh, M. and Singh, A.K. Bibliography of environmental studies in natural characteristics and anthropogenic influences on the Ganga River. Environ. Monit. Assess. 2007; Vol. 129 (1-3): 421-432.
CrossRef - Matta Gagan, Evaluation and prediction of deviation in physico-chemical characteristics of River Ganga, International Journal of Advancements in Research & Technology. 2015; Vol. 4(6): 14 -30.
- Krishna Murti, C. R., Ganga, a scientific study, Environment Research Committee, Ganga Pariyojana Nideśalaya., India, New Delhi. 1991. Northern Book Centre.
- Saklani, P. S. and Satendra. Strain Estimation of Narendranagar (Krol) syncline, in Saklani, P. S., Himalayan Thrusts and Associated Rocks. 1986. Today and Tomorrow Printers and Publishers, New Delhi.
- Bhatt, S. C. and Satendra. Structural and petro graphic study of Blainy rocks, Narendra Nagar-Rishikesh area. Lesser Garhwal Himalaya, U.P., Bulletin of Indian Geologists Association, Chandigarh. 1990; Vol. 23(1): 1-12.
- Piyoosh Rautela and D. Sati. Recent crustal adjustments in Dehradun valley, Western Uttar Predesh, India, Current Science. 1996; Vol.71 (10):776-780.
- ESAMP Report of Sewerage System: Muni Ki Reti, Dhalwala, Nov. 2014. AECOM India Pvt. Ltd., New Delhi. (Https://nmcg.nic.in/writereaddata/fileupload/4_Final_ESAMP__Muni_Ki__Reti_Dhalwala.pdf).
- https://www.worldweatheronline.com/rishikesh-weather-averages/uttarakhand/in.aspx
- Standard Methods for the Examination of Water and Wastewater, 21st Ed., 2005. AIPHA, Washington D.C.
- Trivedy, R.K. and Goel, P.K. Chemical and Biological Methods for Water Pollution Studies, 1986. Env. Publication, Karad. India. P- 251.
- Maiti S. K. Handbook of Methods in Environmental Studies, Water and Waste Water Analysis, Vol. 1, 2004. ABD Publishers, Jaipur.
- Bureau of Indian Standards (BIS), Indian standard drinking water specification (second revision) BIS 10500:2012, New Delhi 2012.
- Aneja K. R. Experiments in Microbiology: Plant Pathology and Biotechnology. 2007. 4th Ed., New Age International.
- Rao G. Srinivas and Rao G. Srinivas. Study of Groundwater Quality in Greater Visakhapatnam City, Andhra Pradesh (India). J. Environ. Science & Eng. 2010; 52 (2): 137-146.
- Manual of Standards of Quality for Drinking Water Supplies, Indian Council of Medical Research (ICMR). 1975.
- Singh Sachidanand, Srivastava Gaurav and Bhatt Arun. Physicochemical Determination of Pollution in Wastewater in Dehradun. Curr World Environ. 2012; 7(1): 133-138.
CrossRef - Madan Sangeeta, Dutta Shilpika and Chanchal Water quality assessment of river Tons, Dehradun (Uttarakhand), India. J. Appl. & Nat. Sci. 2013; 5 (1): 76-81.
CrossRef - Ram Sobha and Joshi Himanshu Assessment of River Water Quality under Urban Influence: A Case Study. J. Environ. Science & Engg. 2012; 54(1): 78-84.
- Shail Kulshrestha, Assessment of water quality status of tropical fresh water Manu swamp-Rambha River, Rishikesh, Dehradun, India. Eco. Env. & Cons. 2020; 26 (8) Suppl.; S255-S267.
- Seth Richa, Mohan Manindra, Singh Prashant, Singh Rakesh, Dobhal Rajendra, Singh Krishna Pal and Gupta Sanjay. Water Quality Evaluation of Himalayan Rivers of Kumoun Region, Uttarakhand, India. Appl Water Sci. 2016; 6(2): 137-147.
CrossRef - Sharma R. N. and Goel Sudha, Chlorinated drinking water and incidences of cancer and adverse health outcomes in Gangtok, J. Environ Sci. & Engg. 2007; 49(4): 247-254.
- Majumdar S, Gupta S, Saha R. N, Datta J.K and Mondal N. Eutrophication Potential of Municipal Sewage of Burdwan Town, West Bengal, India. Poll. Res. 2006; 25(2), 299-302.
- WHO (2011) Guidelines for drinking-water quality, 4th edn. Geneva, Switzerland.
- Bhutiani R. and Khanna D. R. Ecological Status of river Suswa: Modelling DO and BOD Environ Monit Assess. 2007; 125 (1-3): 183-195.
CrossRef - Akhtar S. and Brraih O. S. Physico-Chemical Analysis of Fresh Water of Ropar Wetland (Ramsar Site), India. Curr World Environ. 2020; 15(1).
CrossRef - Benit N. and Roslin A. Stella. 2015, Physicochemical properties of wastewater collected from different sewage sources. International Journal of Innovative Science, Engineering & Technology. 2015; 2 (11), 691-696.
- Salifu Musah, Aidoo Felix, Hayford Michael Saah, Dickson Adomako, Enoch Asare, Evaluating the suitability of groundwater for irrigational purposes in some selected districts of the Upper West region of Ghana. Applied Water Science. 2017; 7 (2): 653–662.
CrossRef - Todd D. K. Ground Water Hydrology, John Wiley and Sons Publications, Hoboken, NJ, USA, 3rd edition, 1995.
- Raghunath H.M. Groundwater, Wiley Eastern Ltd., New Delhi, 2nd edition, pp 344–369, 1987.
- Kelly W.P. Use of saline irrigation water. Soil Sci 1963; 95: 355–391.
CrossRef


