Elemental Characteristics of Respirable Particulate Matter in the Urban Atmosphere of Dehradun, Uttrakhand, India
Sohni Sinha1
*
, Rajdeo Kumar1
, Amit Ranjan Kumar2
, Vignesh Prabhu3
, Ram Pravesh Kumar4
 and Ashutosh Kumar Tripathi5
1
Department of Ecology, Climate Change And Forest Influence Division,
Forest Research Institute,
Dehradun,
Uttarakhand,
India
2
Department of Environment Forest And Climate Change,
Govt. of Bihar,
Bihar,
Patna,
India
3
Doon University,
Dehradun,
Uttarakhand,
India
4
School of Environmental Sciences Jawaharlal Nehru University,
New Delhi,
India
5
FRI (Deemed) University,
Forest Research Institute,
Dhrradun,
Uttarakhand,
India
http://dx.doi.org/10.12944/CWE.16.1.32
Copy the following to cite this article:
Sinha S, Kumar R, Kumar A. R, Prabhu V, Kumar R. P, Tripathi A. K. Elemental Characteristics of Respirable Particulate Matter in the Urban Atmosphere of Dehradun, Uttrakhand, India. Curr World Environ 2021;16(1). DOI:http://dx.doi.org/10.12944/CWE.16.1.32
Copy the following to cite this URL:
Sinha S, Kumar R, Kumar A. R, Prabhu V, Kumar R. P, Tripathi A. K. Elemental Characteristics of Respirable Particulate Matter in the Urban Atmosphere of Dehradun, Uttrakhand, India. Curr World Environ 2021;16(1). Available From : https://bit.ly/3jwPFde
Download article (pdf) Citation Manager Publish History

Introduction
Particulate matter is complicated mixture of fine particulates and liquid droplets. Its contains acids, organic chemicals, metals and dust particles. Due to rapid urbanisation and industrialisation, the aerosol load in the atmosphere has reached a threshold limit in most of the cities in India1. Uttarakhand state in the northern part of India has high tourist activity due to its diverse landscape, religious places and high biodiversity2. Dehradun city in the state of Uttarakhand is one of the major tourist cities in India; more than one million tourists visit the city every year. Although it has only small-scale industries, it is facing serious air quality problems3. In the recent years, there is a steady rise in the number of vehicles in the city. Particulate matter (PM) can be composed of suspended soil, street dust, pollen, sulfate, nitrate, ammonium, calcium carbonate, sea salt, organic and elemental carbon4. Determining the chemical characteristics of atmospheric particulate matter is important for elucidating the toxicity of the particles. Substantial variation in the concentration of particulate matter with seasons was reported earlier in several cities in India4, 5, 6.
One of the most commonly used indicator for PM monitoring is PM10 (particles that are 10 µm or less in mass median aerodynamic diameter are referred to as the PM10). Heavy metals associated with respirable particles could reach the lungs and may be able to cause severe health problems7. Particularly in males, lung cancer mortality and non-malignant respiratory mortality was significantly associated with ambient PM10 8. Previously, several researchers have used SEM-EDS for determining the morphology and elemental composition of the particulates9,10.
The aims of the present study has been attempted to (a) assess the chemical characteristics of particulate matter, (b) to determine the morphology and elemental composition of the particulates.
Materials and Methods
Study Area
Dehradun (30.00 °N to 30.50 °N and 78.30 °E to 78.60 °E) is a valley situated in the Shiwalik range of the Himalayas with elevation of 600-800 average mean sea level (amsl) (fig.1). The meteorological data of last two years showed that the average annual temperature of Dehradun was 29.2ºC. In addition, Dehradun received an average annual rainfall of 2456.1 mm (average value for the year 2012 and 2013). According to 2011 census, Dehradun district had a population of 1,696,694 and population density of 550. The PM10 concentration and heavy metals associated with the particulate matter were determined in thirteen sites in Dehradun, the sites which have similar surroundings were clubbed accordingly and designated as institutional area (C and S10), commercial area (S1, S2, S4 and S5), industrial area (S11 and S12) and residential area (S3, S6, S7, S8 and S9).
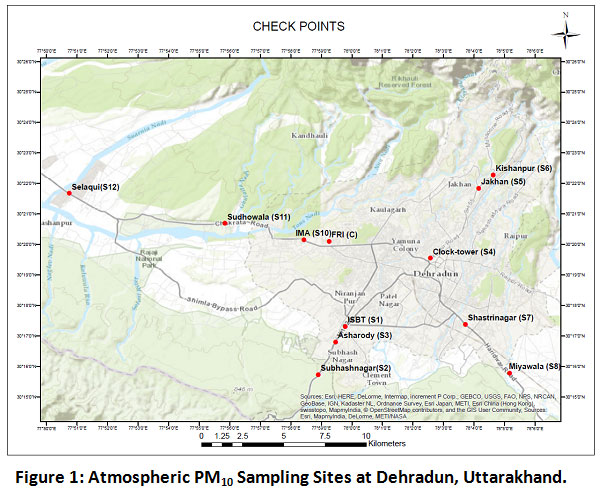 |
Figure 1: Atmospheric PM10 Sampling Sites at Dehradun, Uttarakhand. Click here to view Figure |
Location of Sampling Sites
|
S. No. |
Location |
Altitude |
Descriptions |
|
1. |
Forest Research Institute-Control site-C |
629 amsl |
The site-C is Asia’s largest institute in forest sector. This campus has dense forest all along its boundaries. The trees are mostly tall and dense, which makes the campus less affected by outside pollution. Therefore, it was made as a control site. |
|
2. |
Inter State Bus Terminal-S1 |
597 amsl |
It is the main entry point of all state and private buses connected with Dehradun from surrounding cities. Vehicular traffic density is very high. Due to movement of large vehicles there are frequent traffic jams and road side soil deposition is maximum in this site. |
|
3. |
Subashnagar-S2 |
657 amsl |
It is three km away from S1. It is characterized by offices, schools and institutes. |
|
4. |
Asharody-S3 |
581 amsl |
The site-S3 is mainly characterized by Sal tree dominated forest. It is on the way towards New Delhi city. |
|
5. |
Clock tower-S4 |
679 amsl |
It is situated in the centre of Dehradun city. Thousands of people visit this place every day. This place is surrounded by markets and shopping complex. |
|
6. |
Jakhan-S5 |
787 amsl |
The site-S5 is on the Mussoorie highway. It is 3 km away from S4. It mainly comprises of shops and residential areas |
|
7. |
Kishanpur-S6 |
801amsl |
The site-S6 is three km away from S5. This site consists mostly of residential area and small commercial areas. |
|
8. |
Shastrinagar-S7 |
627amsl |
It is mainly a residential area of Dehradun city. S7 has less vehicular movement in comparison with sites S8 and S9. |
|
9. |
Miyawala-S8 |
605 amsl |
It is along the Haridwar city highway road. It is semi urban area of Dehradun. Harawala railway station is situated near this place. |
|
10. |
Lachhiwala-S9 |
502 amsl |
The site-S9 is famous for picnic spot. It is mostly surrounded by forest in which Sal tree is dominant species. The vehicular density is high in comparison to S6 and S9. |
|
11. |
Indian Military Academy-S10 |
623 amsl |
It is situated along the control site. It is one of the oldest military academy. The surrounding is less polluted and has more trees in and around the academy. |
|
12. |
Sidhuwala-S11 |
574 amsl |
It is mainly a residential area; it is on the way towards Himachal Pradesh state. It is characterized by fragmented agriculture fields and Sal tree dominated forest. |
|
13. |
Selaqui-S12 |
514 amsl |
The site-S12 is an industrial area of Dehradun. This industrial belt consists mainly of packaging and small scale industries. There are not much manufacturing industries. |
Sample Collection
The respirable particulate matter concentration (PM10) was determined using RDS (Envirotech, New Delhi) and EPM2000 grade filter paper (Glass fiber, Whatmann) was used for the study. The duration of sampling was 24 hours, from 6 AM on first day to 6 AM local time (LT) of the next day. The sampling was carried out during post-monsoon (post-m; December, 2012 and January, 2013), monsoon (mon; July and August, 2013) and pre-monsoon (pre-m; May and June, 2013). In each site nine samples were collected, in total 117 were collected (13 sites). The sampler was placed in an open area where there is free flow of wind. The filter papers were desiccated for 48 hours before sampling and weighted with electronic balance11. The filter papers were kept in a polyethylene cover while carrying to the study site.
Chemical Analysis-AAS
The filter papers were desiccated for 48 hours after sampling and weighted in an electronic balance. One third of the glass fiber filter paper was cut and it was put in 100 ml teflon beaker and 5.55% Nitric acid (HNO3) and 16.75% of Hydrochloric acid (HCl) were added5,12. Reagents used were of AR grade. Subsequently, it was placed on a hot plate for two hours and filtered with whatmann-42 filter paper and further analysed with AAS (AAS4141A, ECIL India). For blank filter paper similar procedure was followed.
Morphological and Elemental Analysis-SEM-EDS
For determining the morphology of the particle, a 1cm2 of the filter paper was cut and it was coated with Gold (Au) particles of thickness (15-30nm) for using a vacuum coating unit (Quorum Q150 RES, Germany) for making it electrically conductive and it was analysed with SEM, the positioning of samples and imaging were controlled by computer system10 . A portion of the subjected filter paper is focused and images were taken at three different magnification (fig. 3A, B and C) (2k´ with 10µm, 5k´ with 10µm and 10k´ with 1µm). For determining the elemental composition of the particulates, EDS was used at accelerating voltage of 20kV. A 1cm2 of filter paper was cut and coated with carbon (C) particles of thickness (15-20nm) for 2-3 minutes through a vacuum coating unit. The filter paper was subjected to EDS through computer controlled field emission SEM (Carl zeiss SMT EVO series) equipped with quantax200 esprit 1.8.1 software.
Results and Discussion
Aerosol Mass Concentration
Table.1 shows the variation of PM10 according to different seasons. The average mass concentration of particulate matter during pre-m was 216.5 ± 73.9 µgm-3, post-m 245.4 ± 72.1 µgm-3 and monsoon was 142.0 ± 59.5 µgm-3. During winter season particulate matter concentration was found to be high at S4 (336.0 ± 42.5 µgm-3). S4 showed maximum PM10 concentration during pre-monsoon season (337.3 ± 50.5µgm-3) and monsoon season (235.6 ± 57.2µgm-3). The particulate matter concentration at C (control site) was found to be minimum during all the seasons, the minimum concentration of particulate matter may be due to tall trees and less vehicular movement. Along with C, S10 and S7 showed less concentration of PM10 during all seasons. The average value of PM10 concentration was found to be maximum at S4 followed by S1 and S12. 12have also reported this kind of trend, were the value of particulate matter was found to be maximum during the post-m season in comparison to pre-m season. 14 have mentioned that the high value of particulate matter in post-m season may be due to more energy consumption for industrial purpose or may be due to biomass burning for space heating15. Four times increase in particulate matter concentration during winter season from other seasons was documented by16. The average of concentration in particulate matter in all the sites during pre-m and post-m exceeded 24-hour permissible limit of 100 µg/m3 and during monsoon season 72% of the sampling days had violated the permissible limit17. The correlation coefficient between concentration of PM and vehicular count showed positive correlation with all the four categories of vehicles (r=0.7 with 2-w; r=0.5 with 3-w; r=0.7 with 4-w; r=0.4 with HV).
Table 1: Showing the Variation in Concentration of Particulate Matter and Heavy Metals with Different Sites.
|
PM10 (µg/m3) |
Heavy metals (µg/m3) |
|||||||||||
|
Site |
pre-m |
Mon |
pos-m |
Cu |
Zn |
Fe |
Mn |
Co |
Cr |
Ni |
Pb |
Cd |
|
C |
106.7 |
65.0 |
125.7 |
3.5 |
3.57 |
1.98 |
0.04 |
0.04 |
0.16 |
0.14 |
0.36 |
0.00 |
|
S1 |
320.0 |
214.0 |
324.3 |
10.06 |
9.55 |
16.08 |
0.43 |
0.2 |
0.44 |
0.47 |
1.29 |
0.07 |
|
S2 |
189.3 |
128.3 |
300.0 |
4.95 |
4.85 |
12.42 |
0.11 |
0.08 |
0.23 |
0.21 |
0.39 |
0.03 |
|
S3 |
133.7 |
115.3 |
215.0 |
4.3 |
4.77 |
9.35 |
0.07 |
0.05 |
0.14 |
0.13 |
0.57 |
0.01 |
|
S4 |
337.3 |
235.7 |
336.0 |
8.2 |
8.58 |
13.49 |
0.24 |
0.15 |
0.56 |
0.58 |
1.24 |
0.06 |
|
S5 |
257.7 |
178.7 |
264.3 |
4.72 |
6.13 |
11.47 |
0.12 |
0.08 |
0.27 |
0.21 |
0.7 |
0.03 |
|
S6 |
221.7 |
192.0 |
285.0 |
4.84 |
4.7 |
10.92 |
0.07 |
0.07 |
0.14 |
0.14 |
0.44 |
0.01 |
|
S7 |
119.0 |
82.0 |
183.0 |
3.11 |
4.25 |
8.68 |
0.05 |
0.06 |
0.16 |
0.09 |
0.44 |
0.01 |
|
S8 |
202.7 |
104.0 |
202.0 |
4.61 |
4.72 |
9.92 |
0.07 |
0.07 |
0.12 |
0.1 |
0.49 |
0.01 |
|
S9 |
222.0 |
113.7 |
233.7 |
4.18 |
4.36 |
7.02 |
0.09 |
0.06 |
0.17 |
0.12 |
0.4 |
0.01 |
|
S10 |
218.7 |
95.7 |
207.0 |
4 |
4.53 |
5.65 |
0.09 |
0.06 |
0.2 |
0.07 |
0.49 |
0.01 |
|
S11 |
186.3 |
108.7 |
191.0 |
5.7 |
5.27 |
8.39 |
0.09 |
0.05 |
0.18 |
0.08 |
0.5 |
0.01 |
|
S12 |
299.7 |
212.7 |
323.3 |
8.1 |
9.04 |
13.03 |
0.21 |
0.13 |
0.37 |
0.3 |
0.95 |
0.04 |
|
Average |
216.5 |
142.0 |
245.4 |
5.41 |
5.72 |
9.88 |
0.13 |
0.08 |
0.24 |
0.20 |
0.64 |
0.02 |
|
SD |
73.18 |
56.81 |
62.65 |
2.08 |
2.00 |
3.70 |
0.11 |
0.05 |
0.13 |
0.16 |
0.32 |
0.02 |
Metallic Elements in Particulate Matter
Nine heavy metals viz. Cu, Zn, Fe, Mn, Co, Cr, Ni, Pb and Cd were analysed in PM10 samples. S1 showed maximum concentration in Cu (10.05 µgm-3), Zn (9.55 µgm-3), Fe (16.0 µgm-3), Mn (0.42 µgm-3), Co (0.20 µgm-3), Pb (1.29 µgm-3) and Cd (0.066 µgm-3). Concentration of Cr (0.56 µgm-3) and Ni (0.58 µgm-3) were maximum at S4 site (Table.1). The analysed heavy metals were observed in the order of Fe> Zn> Cu> Pb> Cr> Ni> Mn> Co> Cd. Previously, several researchers have reported maximum concentration of Fe and Zn among the analysed elements in PM1012, 13, 18. In addition, 19 showed that considerable amount of Fe can be released from fly ash from municipal waste. A study by20 found Fe to be maximum in Raipur city. The toxic metals like Pb, Cd, Cu and Zn were observed in the traffic pollutants21. The particles with high concentration of Fe usually composed of Magnetite and Hematite13. On all the days of sampling the 24 hour concentration of Pb was found to be higher than the permissible limit in site S1 and S417.
Enrichment Factor
Enrichment factor (EF) was widely employed to identify whether a metallic element has an anthropogenic source other than its natural source.6
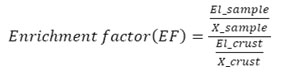
Where El sample is the element in sample, X means the reference element, X sample means the concentration of reference element in sample, El crust means the concentration of the element in the crust, X crust means the concentration of the reference element in the crust.
The earth crust mean abundance of metals given in CRC handbook was used for calculating the enrichment factor22. Fe was chosen as a reference element23. On the basis annual enrichment factor analysis, the chemical species were grouped into five categories.
Not enriched = EFs < 1; meagrely enriched = EFs is 1-10; little enriched = EFs is 10-50; moderately enriched = EFs is 50-500; highly enriched = EFs is 500-1000; very highly enriched = EFs > 1000. The measured enrichment factor varied in the range of 0.39 to 1128.8, which shows substantial contribution of anthropogenic activity on the heavy metal load in the ambient air (fig.2). In the category of non-enriched, only manganese (Mn) was found, as manganese is found in soil largely as MnO224. The elements with moderate EFs were Co, Cr and Ni. The high EFs of Cu, Zn and Cd indicate high anthropogenic contribution.
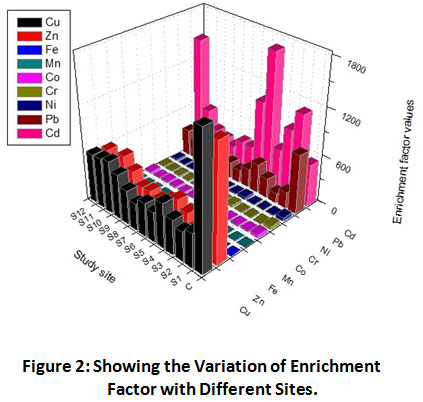 |
Figure 2: Showing the Variation of Enrichment Factor with Different Sites. Click here to view Figure |
To delineate the possible sources that contributed to the PM10 in Dehradun city, principle component analysis with varimax rotation was applied. The components having eigen value greater than 1.0 were chosen for the identification of the possible sources4,25. Table 2 shows the rotated component matrix for the collected PM10 across the city of Dehradun for all the seasons. Three principle components were identified, explaining a cumulative variance of 81.75%. Factor loading greater than 0.5 for the individual metal in a component was considered as the emitted from the same source. First factor explaining the variance of 69.02 % was enriched with Mn, Co, Cr, Ni and Cd, which is possibly released from uncontrolled refuse and waste burning26. Factor two relates the PM10 with vehicular emission. Loading of Pb with Mn and Cd are correlated with the vehicular emission and vehicular induced re-suspension. Wear and abrasion of the vehicular parts enhances the loading of Mn and Cd in the atmosphere. Although unleaded gasoline is in use from long ago but its resistance to the environment after release marks its presence in the environment 27. High enrichment of Fe with other trace elements are form dust re-suspension due to various human and natural activities like wind supported erosion of upper crustal dust, explains the third factor.
Table 2: Factor Loading of the Different Pollutants in Dehradun (Factor Loading >0.5 is Highlight in Bold)
|
Elements |
Rotated Component Matrix |
||
|
Factors |
|||
|
1 |
2 |
3 |
|
|
PM10 |
.737 |
.065 |
.525 |
|
Cu |
.365 |
.626 |
.574 |
|
Zn |
.380 |
.679 |
.505 |
|
Fe |
.295 |
.238 |
.876 |
|
Mn |
.570 |
.550 |
.327 |
|
Co |
.696 |
.304 |
.370 |
|
Cr |
.745 |
.483 |
.185 |
|
Ni |
.739 |
.494 |
.182 |
|
Pb |
.252 |
.881 |
.125 |
|
Cd |
.593 |
.517 |
.391 |
|
Variance |
32.34 |
28.30 |
21.01 |
|
Cumulative variance (%) |
32.34 |
60.70 |
81.71 |
|
Sources |
Uncontrolled refuse and waste burning |
Vehicular emission and vehicular induced re-suspension |
Dust-resuspension |
Scanning Electron Microscope
For high resolution imaging, SEM was used. It employs high resolution electron beam and the images are dependent on the different quality of electrons emitted from the surface topographies. Other parameters are magnification: 7 to 1,00,000 ´; resolution 3.0 nm SE and HV; accelerating voltage of 0.2 to 30 kV; detector available: SE in HV. The morphology of the sampled particles were analysed using scanning electron microscope (fig.3 A, B and C), from the figure, it can be observed that the particles were rough, spherical and agglomeration types. The irregular shaped particles were attributed to natural and crustal source and can also be formed due to the result of reaction between the particles with gaseous or liquid phase.
SEM-EDS
Sampled filter paper during pre-m season from an institutional area (S10 site) was chosen for SEM-EDX analysis. It was observed that most of the particles were of natural origin. It was observed that O dominated over other elements which follows the trend as O>Si>Na>Ca>Mg>Al>S>K>Cl. The morphological studies show that the particles were irregular, spherical and agglomerate types. Among the elements, oxygen was found to have maximum percentage (53.98 % by wt) and chlorine (0.23 % by wt) was found to be minimum. Both qualitative and quantitative analysis was determined.
The elemental composition was determined using SEM-EDS (fig. 3 D). Oxides were present as silicon dioxide (Si02), aluminium oxide (Al203), magnesium oxide (MgO), sodium oxide (Na2O), sulphur trioxide (SO3), calcium oxide (CaO), potassium oxide (K2O) and oxygen (O) and chlorine (Cl) was observed in the spectra (Table 3).
The Al and Si were associated with oxygen and the percentage of Al203 and Si02were 64.70 %. Cong et al. (2010) reported Alumosilicates as dominant in the examined filter paper and mentioned that it can include Montmorillonite, Illinite, Kaolinite and Feldspars. The morphology of Aluminosilicates were reported to be spherical and non-spherical28. Ca and Mg were found in combination with oxygen. The contribution of CaO was 7.02 % and MgO was 3.81 %, these can be attributed to soil origin29.
Table 3: Percentage Contribution of Various Elements Observed through the SEM-EDS System.
|
Element |
Series |
Unn.C |
Norm.C |
C.Atom |
C.oxide |
Oxide.C |
|
|
|
[wt. %] |
[wt.%] |
[at. %] |
|
[wt. %] |
|
Magnesium |
k-series |
1.68 |
1.92 |
1.56 |
MgO |
3.81 |
|
Sodium |
k-series |
10.74 |
12.26 |
10.53 |
Na2O |
19.77 |
|
Aluminium |
k-series |
1.67 |
1.90 |
1.39 |
Al2O3 |
4.31 |
|
Silicon |
k-series |
20.66 |
23.60 |
16.59 |
SiO2 |
60.39 |
|
Sulfur |
k-series |
0.94 |
1.08 |
0.66 |
SO3 |
3.21 |
|
Chlorine |
k-series |
0.20 |
0.23 |
0.13 |
Cl |
0.28
|
|
Potassium |
k-series |
0.74 |
0.84 |
0.43 |
K2O |
1.21 |
|
Calcium |
k-series |
3.67 |
4.19 |
2.07 |
CaO |
7.02 |
|
Oxygen |
k-series |
47.26 |
53.98 |
66.63 |
O |
19.63 |
|
|
Total |
87.55 |
100.0 |
100.0 |
|
|
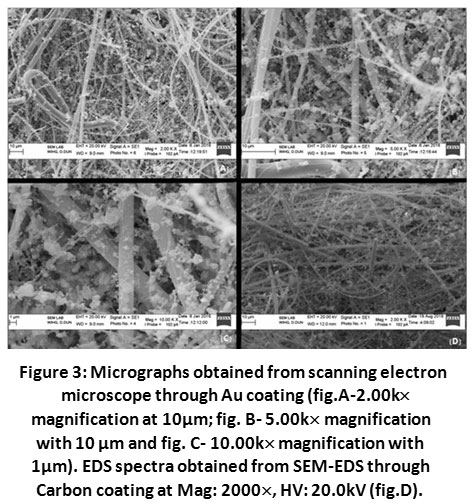 |
Figure 3: Micrographs obtained from scanning electron microscope through Au coating. Click here to view Figure |
Conclusion
This study shows the diversity in the source of particulate matter including both of anthropogenic and natural origin. In most of the days of sampling, the 24-hour average mass concentration of particulate matter was higher than the permissible limit set by central pollution control board, New Delhi. EDS study revealed that the particulate loaded filter paper is composed mostly of oxides. Enrichment factor analysis shows substantial anthropogenic activity in the area. Elemental composition analysed through AAS revealed high concentration of heavy metals, particularly in two sites (viz) S4 and S1 (commercial sites). Source apportionment marked with the identification of the three important sources across the Dehradun city. Enrichment of toxic fraction of trace element form various anthropogenic sources is a matter of concern. So, this study would enhance the information on particular matters of chemical and morphological properties in a data deficit region i.e, India. In a long run such studies would also help in understanding the health effects of chemical components in the ambient air.
Acknowledgement
We are grateful to Dr. A K Tripathi (Scientist-F) for providing necessary support and infrastructure facility for our work. We extend our gratitude to Mr. Vinod Singhal, Director, Uttarakhand SPCB and Mr. N.K Juyal (Technical officer, WADIA) for providing technical support for SEM-EDS. Special thanks to Dr. Vijay Shridhar, Assistant professor, Doon University, Dehradun (Uttarakhand).
References
- Gupta, I., Kumar, R., 2006. Trends of particulate matter in four cities in India. Atmos. Environ. 40, 2552-2566.
CrossRef - Ahmed N, Rajouri G.P.G.C. Sustainable Tourism Development in Uttarakhand Region of India. International Journal of Management and Social Sciences Research (IJMSSR). 2013; 2:106-111.
- Rana S, Kant Y, Dadhwal V.K. Diurnal and Seasonal Variation of Spectral Properties of Aerosols over Dehradun, India. Aerosol and Air Quality Research. 2009; 9: 32-49.
CrossRef - Basha S, Jhala J, Thorat R, Goel S, Trivedi R, Shah K, Menon G, Gaur P, Mody K.H, Jha B. Assessment of heavy metal content in suspended particulate matter of coastal industrial town, Mithapur, Gujarat, India. Atmosheric Research. 2010; 97, 257-265.
- Ambade B. Seasonal variation and sources of heavy metals in hilltop of Dongargarh, Central India. Urban Climate. 2014; 9: 155-165.
CrossRef - Shridhar V, Khillare P.S, Agarwal T, Ray S. Metallic species in ambient particulate matter at rural and urban location of Delhi. Journal of Hazardous Materials. 2010; 175: 600-607.
CrossRef - Espinosa J.F, Ternero Rodríguez M, Barragán De La Rosa F.J, Jiménez Sánchez J.C. Size distribution of metals in urban aerosols in Seville (Spain). Atmosheric Environment. 2001; 35: 2595-2601.
CrossRef - Pope C.A, Dockery D.W. Health Effects of Fine Particulate Air Pollution: Lines that Connect. Journal of the Air & Waste Management Association. 2006; 56: 709–742.
CrossRef - Agrawal A, Upadhyay V.K, Sachdeva K. Study of aerosol behavior on the basis of morphological characteristics during festival events in India. Atmosperic Environment. 2011; 45: 3640–3644.
CrossRef - Murari V, Kumar M, Singh N, Singh R.S. Particulate morphology and elemental characteristics : variability at middle Indo-Gangetic Plain. Journal of Atmosheric Chemistry. 2015; 73: 165-179.
CrossRef - Pipalatkar P, Khaparde V V, Gajghate D.G, Bawase M.A. Source apportionment of PM2.5 using a CMB model for a centrally located indian city. Aerosol and Air Quality Research. 2014; 14:1089–1099.
CrossRef - Shukla S.P, Sharma M. Source Apportionment of Atmospheric PM10 in Kanpur, India. Environental Engineering Science. 2008; 25: 849–862.
CrossRef - Chaudhari P.R, Gupta R, Gajghate D.G, Wate S.R. Heavy metal pollution of ambient air in Nagpur City. Journal Environmental Monitoring and Assessment. 2012; 184: 2487–2496.
CrossRef - Lee B.K, Hieu N.T. Seasonal Variation and Sources of Heavy Metals in Atmospheric Aerosols in a Residential Area of Ulsan, Korea. Aerosol and Air Quality Research. 2011; 11: 679–688.
CrossRef - Raheed A, Aneja V.P, Aiyyer A, Rafique U. Measurement and Analysis of Fine Particulate Matter (PM 2.5) in Urban Areas of Pakistan. Aerosol Air Qual. Res. 2014; 1–14.
CrossRef - Lodhi A, Ghauri B, Khan M.R, Rahman S, Shafique S. Particulate Matter (PM2.5) Concentration and Source Apportionment in Lahore. Journal of the Brazilian Chemical Socity. 2009; 20: 1811–1820.
CrossRef - NAAQS. National Ambient Air Quality Standards,CPCB. 2009.
- Vijayanand C, Rajaguru P, Kalaiselvi K, Selvam K.P, Palanivel M. Assessment of heavy metal contents in the ambient air of the Coimbatore city, Tamilnadu, India. Journal of Hazardous Materials. 2008; 160: 548–553.
CrossRef - Friberg L, Gumar, Berg, Lord B, Vouk V. Handbook on the toxicology of Metals. Elsevier Publications. 1986.
- Thakur M, Kanti Deb M, Imai S, Suzuki Y, Ueki K, Hasegawa A. Load of heavy metals in the airborne dust particulates of an urban city of Central India. Environmental Monitoring and Assessment. 2004; 95: 257–268.
CrossRef - Kramer U, Herder C, Sugiri D, Strassburger K, Schikowski T, Ranft U, Rathmann, W. Traffic-Related Air Pollution and Incident Type 2 Diabetes: Results from the SALIA Cohort Study. Environ Health Perspect. 2010;118: 1273–1279.
CrossRef - Weast R.C, Astle M.J. CRC Handbook of Chemistry and Physics, Internet version 2005. 2005.
- Khillare P.S, Sarkar S. Airborne inhalable metals in residential areas of Delhi , India : distribution, source apportionment and health risks. Atmosheric Pollution and Research. 2012; 3:46–54.
CrossRef - Von Schneidemesser E, Stone E. A, Quraishi T. A, Shafer M.M, Schauer J.J. Toxic metals in the atmosphere in Lahore, Pakistan. The Science of the Total Environment. 2010; 408: 1640–1648.
CrossRef - Kumar R. P, Pandey A. K, Kumar R, Kashyap P, Kumar K. Assessment of Source Profile of Nonmethane Hydrocarbon in the Ambient Air of Metro City Delhi, India. Current World Environ. 2017 12(2). DOI:http://dx.doi.org/10.12944/CWE.12.2.16.
CrossRef - Sharma S.K, Sharma A, Saxena M, Choudhary N, Masiwal R, Mandal T.K, Sharma C. Chemical characterization and source apportionment of aerosol at an urban area of Central Delhi, India. Atmospheric Pollution and Research. 2016; 7: 110-121.
CrossRef - Banerjee T, Murari V, Kumar M, Raju M.P. Source Apportionment of Airborne Particulates through Receptor Modelling: Indian Scenario. Atmosheric Research. 2015;164–165, 167-187.
CrossRef - Sharma S.G, Srinivas M.S.N. Study of chemical composition and morphology of airborne particles in Chandigarh, India using EDXRF and SEM technique. Environmental Monitoring and Assessment. 2009; 417-425.
- Cong Z, Kang S, Dong S, Liu X, Qin D. Elemental and individual particle analysis of atmospheric aerosols from high Himalayas. Journal Environmental Monitoring and Assessment. 2010; 323-335.
CrossRef


