Evaluation of Radon (222Rn) Distribution and its Implications vis-a-vis Water Quality of Killiyar River, Kerala, India
Anurani G R
, Lakshmi R
, Joseph Sabu
*
 and Sukanya S
http://dx.doi.org/10.12944/CWE.16.1.10
Copy the following to cite this article:
Anurani G. R, Lakshmi R, Joseph S, Sukanya S. Evaluation of Radon (222Rn) Distribution and its Implications vis-a-vis Water Quality of Killiyar River, Kerala, India. Curr World Environ 2021;16(1). DOI:http://dx.doi.org/10.12944/CWE.16.1.10
Copy the following to cite this URL:
Anurani G. R, Lakshmi R, Joseph S, Sukanya S. Evaluation of Radon (222Rn) Distribution and its Implications vis-a-vis Water Quality of Killiyar River, Kerala, India. Curr World Environ 2021;16(1). Available From : https://bit.ly/2YZKXeN
Download article (pdf) Citation Manager Publish History

Introduction
Rivers are the principle source of water supply for larger population in urban and rural parts of Kerala, southwestern State of India. But, many of the small rivers in Kerala get dried during summer and flooded during monsoon seasons. Since water is one of the most vital commodities, the over-exploitation of water resource and water pollution is a problematic condition which ultimately leads to water scarcity problems. Apart from the dissolved or suspended chemical pollutants, the physical factors such as heat and radiations also play considerable impact on aquatic life. River water quality depends on so many factors like catchment area, topography, weather and seasonal variations, degree and nature of developments in the river basin by humans etc.
Exploitation of rivers intended for agricultural, domestic and industrial purposes cause severe adverse effect on rivers of Kerala by means of propagating the organic and inorganic salt content. Groundwater discharge is believed to be dominating for dry season flows in perennial river systems and to sustain aquatic biodiversity1. This groundwater seepage is vitally important to the hydrologic settings of the world for eternal flow of water in rivers during the times of no rainfall. The interaction between groundwater and surface water is quite complex process2. It depends on many parameters like geology, geomorphology and climate of the particular area. Nevertheless, it is important to measure the groundwater discharge into rivers for getting better knowledge about groundwater balances and for determining sustainable limits of groundwater extraction thereby protecting the environmental flows of river.
Radon (222Rn), a natural tracer that has been used in many hydrological studies3,4,5 is produced by the alpha decay of 226Ra in the decay series of 238U.222Rn (Z=86) is a radioactive element under noble gas family and chemically inactive3,4,5. 222Rn is the most suitable water tracer among the 37 radioactive isotopes of radon (193Rn to 229Rn) due to its relatively longer half- life (3.8 days). It is well known that radon activity concentration in groundwater is 2-4 times higher in magnitude compared to that in surface waters 6,7,8. This is due to the fact that groundwater is in contact with mineral grains with 226Ra and 238U 9,10. Most of the radon produced within a mineral grain remains embedded in the grain, and 10–50 % escapes to enter the pore space 11,12. This is called the emanation coefficient, another important factor contributing to higher activity of radon in groundwater13,14,15. The emanation coefficient depends on the type of rock and its structure and porosity13,14,16. Because of the presence of water in the pore space, the radon atoms can dissolve in groundwater. But in case of surface water, turbulence facilitates rapid gas exchange of radon with atmosphere17. These properties enable the use of 222Rn for studies regarding interaction between groundwater and surface water3-5,18-21. Kies et al.22 suggests that radon migrates through the pores in soils, cracks and fractures in rocks such as faults and thrust along with the groundwater which consequently flows into surface water bodies.
Thus, groundwater discharge points can be explored in locations in a river where there is significant increase of radon activity. Therefore, 222Rn can be used for groundwater prospecting in a river course and such studies are sparse in Kerala. Hence, from a hydrological perspective, a holistic approach to understand the environmental flow in Killiyar river (KR), Kerala has been attempted in this study using radon as a groundwater tracer.
Materials and Methods Study Area
Killi river (KR), also known as Killiyar (n=6th, L=24 km, A=102 km2), the major tributary of Karamana River, is located between latitudes 8°40’30” N, 8°27’0” N and longitudes 76°57’0” E, 76°2’0” E in Thiruvananthapuram district of Kerala State, India (Fig. 1). It has its origin near Panavur (8°38’30.7” N and 76°59’19.4” E) physiographically in the midland (7.5-75m elevation amsl) and the river confluences with Karamana river at Kalladimukham (08â°27’23.4” N and 76â°57’32” E) in downstream region and about 2.0 km inland from the sea coast. The river flows through an undulating terrain in dendritic to sub-dendriticpattern.
Geologically, 90% of river basin is composed of garnetiferous-biotite-sillimanite gneiss with or without graphite (i.e., khondalite), migmatites and some patches of charnockites, sand and clay deposits.
Methodology
Ten sampling locations (Table 1) were selected (interval=~3 km) from upstream to downstream and the sampling was done on a single day during pre- and post-monsoon seasons (January 2017 and December 2017). The sampling sites were selected based on accessibility, land use pattern, topography, degree of anthropogenic interventions at these locations etc.Water temperature, electrical conductivity (EC), pH, total dissolved solids (TDS), salinity and resistivity were measured onsite using Horiba LAqua U-50 multi-parameter water quality portable kit23. Other parameters viz., alkalinity, chloride, total hardness, nitrate, phosphate, sulphate, sodium and potassium were analysed through laboratory experiments using standard procedures of APHA24.
The surface water samples for radon (222Rn) measurement were collected carefully in 250 mL glass bottles without atmospheric air contact. In laboratory, 222Rn dissolved in water is stripped by bubbling air and circulated through a closed air-loop via a desiccant tube into the 222Rn counting system (RAD7, Durridge make). The air continuously recirculates through the water and extracts more than 95% of the dissolved radon until a state of equilibrium develops i.e., within 5 minutes. The radon monitor consists of setup with a high electric field above a silicon semiconductor detector at ground potential to attract the positively charged polonium daughters, 218Po+ and 214Po+, which are counted as a measure of 222Rn activity expressed in Bq/m3(disintegration per second per m3). The measured radon activities were corrected for radioactive decay since water sampling. The correlation of 222Rn with physico-chemical characteristics of water and correlation among different parameters were analysed using SPSS 17.
Table 1: Portrait of Sampling Stations, Killiyar
|
Station ID |
Sampling Station |
Latitude |
Longitude |
|
S1 |
Puthenpalam |
08â°37’39.6’’ N |
77â°00’02.3’’ E |
|
S2 |
Pazhakutty |
08â°36’46.4’’ N |
76â°59’48.1’’ E |
|
S3 |
10thstone Bridge |
08â°35’18.4’’ N |
76â°59’43.0’’ E |
|
S4 |
Karakulam |
08â°34’13.9’’ N |
76â°59’16.2’’ E |
|
S5 |
Vazhayila |
08â°32’50.3’’ N |
76â°58’29.1’’ E |
|
S6 |
Mannamoola |
08â°31’59.4’’ N |
76â°58’52.5’’ E |
|
S7 |
Maruthankuzhi |
08â°30’46.3’’ N |
76â°58’39.2’’ E |
|
S8 |
Jagathy |
08â°29’29.1’’ N |
76â°57’54.4’’ E |
|
S9 |
Attukal |
08â°28’25.0’’ N |
76â°57’27.5’’ E |
|
S10 |
Kalladimugham |
08â°27’23.4’’ N |
76â°57’32.0’’ E |
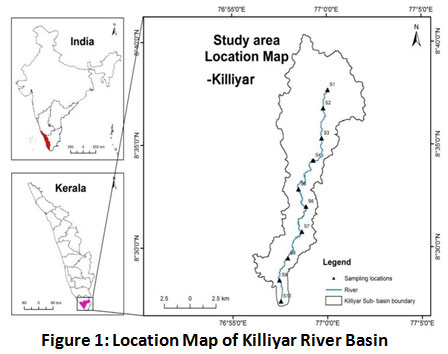 |
Figure 1: Location Map of Killiyar River Basin. Click here to view Figure |
Results and Discussion
Radon Activity Distribution
The spatial variation of radon (222Rn) activity from upstream (S1; 0 km) to downstream (S10; 24 km) along the course of Killiyar river (KR) during pre-monsoon (PRM) and post-monsoon (POM) is given in Table 2 and Figure 3. The spatial distribution of radon followed almost similar pattern during both seasons. During PRM, 222Rn activity varied from 157 to 4588 Bq/m3 and during POM, it ranged from 147 to 1740 Bq/m3. The results demonstrated spatial variation of radon in which the upstream reaches of KR (S1-S2; 0-3 km stretch) exhibited reasonable higher radon activity (>1000 Bq/m3) in contrast to the remaining downstream reaches of river (except S5) with lower radon activity (<500 Bq/m3) in both seasons (Fig. 3). However, the location S5 in the mid course of KR (~10 km downstream of S1) also exhibited higher 222Rn activity (>1000 Bq/m3) for both seasons (Fig.3).
Generally, increased 222Rn activities in surface water are indicative of radon-rich groundwater influx into the river25. Hence, the upstream (S1-S2; 0-3 km stretch) and midstream (S5; 10 km downstream of S1) stretch in the river, where anomalous high radon activities (>1000 Bq/m3) noticed, are likely zones of prospective groundwater discharge into the river. The 222Rn activity shows a decreasing trend from upstream to downstream (except at S5), suggesting the escape of radon from surface water to atmosphere across the boundary layer through molecular diffusion. i.e., gas exchange26. Another possible reason for this decline towards downstream is radioactive decay of 222Rn due to short half-life (t1/2= 3.8 days)27.
Further, temporal variation of radon activities do exist in the study area. i.e., the activity of radon found to be lower during POM (mean=745 Bq/m3) when compared to PRM (mean=1150 Bq/m3). The dilution effect of monsoon is likely to have influenced in the decrease in activity of radon in river during POM. Additionally, the turbulent condition of water after monsoon favours fast atmospheric escape of radon.
Factors Influencing Radon Activity in Water
Major factors governing the spatial variation of surface water radon along the river were scrutinized.
A) Geological Control on Radon Variability
The source of radon is geogenic28-30 and its content is primarily controlled by uranium and radium present in the host rock. 222Rn activities vary spatially based on geology of the region (i.e., bed rock types), degree of weathering, radon releasing potential (i.e., emanation coefficient), structural features in rocks (i.e., presence of fractures), lineaments in the study area etc15, 28,29. Moreover, near surface weathering and bedrock fracturing are implicated with increased radon activities30.
Interestingly, locations with higher 222Rn activities in the river course (i.e., S1-S2, 0-3 km stretch and S5- 10 km from S1) are underlained by fractured compact khondalitic rocks susceptible to weathering. These rock formations do not possess primary porosity, and tend to bear groundwater in repositories with the development of secondary porosity due to weathering and fracturing and by other tectonic processes31.The distinctiveness of these rocks is that, the quantity of groundwater available is primarily dependent on the storage and rate of infiltration through the fractures and further relies on the nature of fractures. The foliations of these metamorphic rocks serve as planes of weakness and facilitate flow and storage of groundwater32.
However, migmatitic rocks were also noticed in few river reaches (e.g., S4 - 8 km downward of S1; S6- 14 km downward of S1) with relatively lower 222Rn activities. i.e., 265-943 Bq/m3 during PRM and 204 -736 Bq/m3 during POM.
Further, river course underlained by sand and silt in downstream (S9 & S10; 22-24 km stretch) was found to have the lowest 222Rn activities with 157 to 312 Bq/m3 during PRM and 147-294 Bq/m3 during POM. This may be attributed to low content of radon parent minerals (uranium bearing minerals) in sandy silt alluvium. Further, the river bed is silty clay underlained by thick sandy silt layers. This silty clay unit is having low hydraulic conductivity compared to the underlying sand and silt layer33. A similar condition was reported in Murray-Darling river basin, Australia by Lamontagne et al.34.This distinction of fluvial geology and associated 222Rn activities indisputably explains the role of geology in subsurface input of groundwater.
B) Structural Influence on Radon Activity
Apart from geology, gradient of the region and lineaments associated with tectonic disturbances also show variable role in contributing the inflow of radon to surface water35. Lineaments are regions where potential groundwater development possible and it provides secondary porosity to the rocks and serve as conduits for rapid movement of radon from aquifer to the river. Regions where lineaments intersect each other are expected to be more favourable for groundwater development36,37 .
Lineament map (Fig. 4) of KR river basin shows two major sets of lineaments dominating the region. One set is NW-SE trending and the other is NE-SW trending. Interestingly, the NW- SE trending lineament transect the river near two sampling sites in the upstream (S1 and S2; 0-3 km stretch), where 222Rn activities are high and hence, this active lineament present here could be one of the reasons for lineament-controlled radon and groundwater discharge in those regions (0-3 km stretch).
The river stretch at 10th km from upstream (S5) is devoid of lineaments, but show high radon activity and indicates factor/s other than lineament take a role. However, previous studies by Sreeja et al33 developed a groundwater potential zone map of KR basin based on geospatial data integration of lineament layer, geology, geomorphology, drainage and slope of the terrain, and indicated that the S5 location is a potential groundwater development zone. Thus, a combination of factors contributes to high radon at S5.
Activity of radon tends to be low in the downstream part of KR, even though some locations (e.g., S3 and S8) are underlained by khondalite group of rocks. The associated lineaments (NE-SW) in this area might be passive lineaments, and further the less weathered and fractured rocks might also be the reason for low radon.
Groundwater Potential Zones Based on Radon Activity
Based on the radon activity, the groundwater potential zones of KR are classified into three categories - high, moderate and low or negligible groundwater potential zones (Fig. 2). This is based on the interpretive guide put forth by Harrington et al. 2012 38. The high radon activity (>1000 Bq/m3) zones are at stretches 0-3 km upstream (S1 and S2) and 10th km from upstream (S5) and implies high groundwater prospects. The medium radon activities (500- 1000 Bq/m3) recorded at 6th km from upstream (S3) and between 14th and 16th km from upstream (S6 & S7), implies moderate groundwater potential zone. The low radon activities (100-500 Bq/m3) implying poor groundwater potential zone is spread in the upper reach 8th km from upstream (S4) and in the lower segment of river from 20-24 km (S8-S10).
Geophysical (Resistivity) field surveys can be applied in this zone of KR river course for groundwater prospecting and confining the groundwater potential in these zones. Once it is confined, then further management options can be charted out to preserve the groundwater potential in these zones for the sustainable environmental flow of the river during dry season.
Table 2: Radon Activity in Killiyar During Pre-Monsoon and Post-Monsoon.
|
Sampling Stations |
Radon Activity in Bq/m3 |
|
|
Pre-monsoon |
Post-monsoon |
|
|
S1 |
1788 |
1470 |
|
S2 |
4588 |
1740 |
|
S3 |
684 |
633 |
|
S4 |
265 |
204 |
|
S5 |
1373 |
1180 |
|
S6 |
943 |
736 |
|
S7 |
938 |
599 |
|
S8 |
468 |
442 |
|
S9 |
157 |
294 |
|
S10 |
312 |
147 |
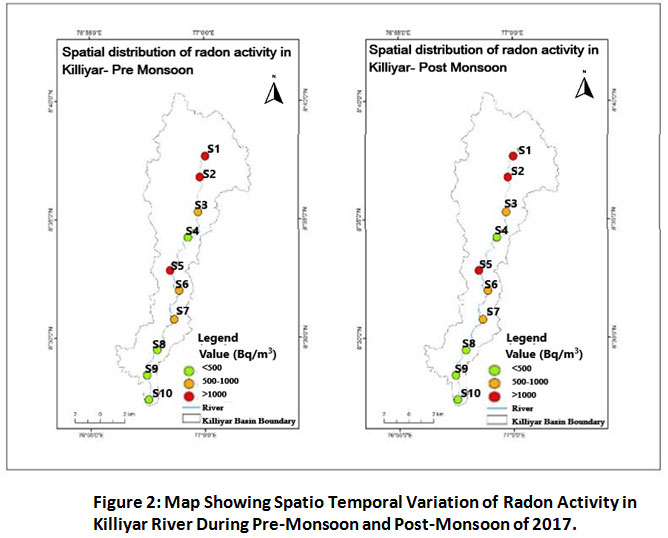 |
Figure 2: Map Showing Spatio Temporal Variation of Radon Activity in Killiyar River During Pre-Monsoon and Post-Monsoon of 2017. Click here to view Figure |
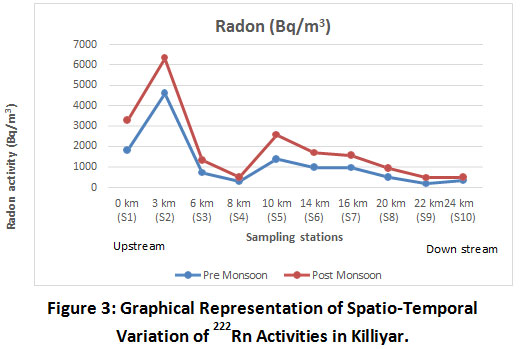 |
Figure 3: Graphical Representation of Spatio-Temporal Variation of 222Rn Activities in Killiyar. Click here to view Figure |
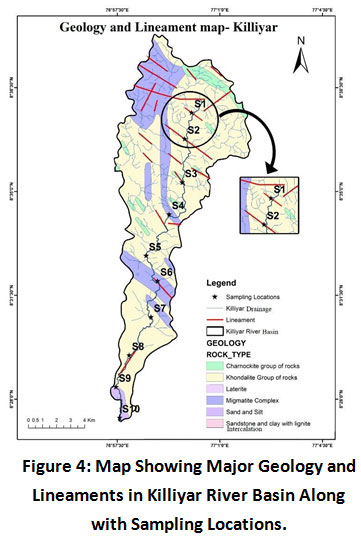 |
Figure 4: Map Showing Major Geology and Lineaments in Killiyar River Basin Along with Sampling Locations. Click here to view Figure |
Surface Water Quality
The measured values of environmental variables of surface water samples are presented in Table S1.
Most of the parameters varied spatio-temporally. All water quality parameters analyzed at locations upstream to downstream were within BIS permissible limits39.
The pH ranged from 6.1 to 7.4 during PRM (mean =6.87 ± 0.41) and 5.1 to 6.8 during POM (mean= 6.06 ± 0.42).The surface water samples were acidic in nature during POMsuggesting increased free CO2 from acidic rainwater contribution to the river during monsoon.
Highest EC values were observed at S10 (24th km location in downstream) consistently during both seasons (PRM=3550 & POM=1229 µS/cm) indicating anthropogenic pollution as well as salt water intrusion to lower reaches through the estuary.
Total alkalinity in the river water ranged between 60 and 180 mg/L during PRM (mean = 90± 34.3) and from 88 to 226 mg/L during POM (mean =157 ± 43.6). Elevated levels of total hardness were witnessed in the lower most reaches during both seasons (PRM =344; POM =165 mg/L) contributed by saline water encroachment and active washing ghats.
The concentrations of chloride increased remarkably above BIS acceptable limit 250 mg/L (BIS, 2012)26 35 at S10 during both seasons (Table.3) implying the anthropogenic inputs and estuarine influence viz., seawater intrusion, sea sprays, tidal effects.
Nitrate levels ranged from 1.94 to 15.68 mg/L (mean= 7.3± 4.5) in PRM and 2.83 to 19.40 mg/L (mean=7.7 ± 6.4) in POM. Nitrate concentration showed an analogous trend during both seasons with relatively increased levels at three locations i.e., S2, S7 and S10. It is attributed to the discharge of domestic wastes which acts as a favorable substrate for biological oxidation of nitrogenous organic matter thus by releasing nitrate. Also, nutrient loaded in Karamana river joins with Killiyar river at S10 location in the downstream40.Dilution due to heavy rains during monsoon and related runoff account for the declined concentration of PO4 during POM (mean=0.47±0.13) in all stations compared to PRM (mean= 4.02±2.6).
Sulphate concentrations ranged from 3.49 to 6.32 mg/L in PRM and 2.58 to 8.8 mg/L in POM. The S10 location showed comparatively high content of EC, TDS, salinity, alkalinity, chloride, hardness, NO3, PO4 and Na mainly due to anthropogenic pollution and salt water intrusion.
Correlation of Radon with Physico-Chemical Parameters
In general, the correlation analysis of various water quality parameters with radon showed no significant correlation for both seasons (Table S1, S2). Similar observation was noted by Idriss et al.41. It endorses the fact that radon in water is attributed to physical processes and geological conditions of a region rather than chemical interactions15, 42, 43.
Effect of Temperature
Temperature is one of the critical factors governing 222Rn dissolution in water44 and its solubility increases with decreasing temperature45. However, this dissolution rate is detectable only when there is considerable temperature differences i.e., 30-50°C between the samples 15, 46. Radon showed no correlation with water temperature in KR. This could be explained by the insignificant temperature difference within the river water samples (26-29°C).
Effect of pH
The results of the correlation analysis suggested that there is no relationship between pH and radon. Becker47 observed a positive correlation between 222Rn and pH in samples with pH>8, which is higher than the pH obtained in Killiyar surface water samples (range= 5.3-7.4). Further, Ye et al.48 stated that under experimental conditions, the mean water radon solubility (Kw/air) is as low as 0.24 when pH increases from 3 to 13 thus by confirming that there is no significant effect of pH on radon dissolution.
Effect of Electrical Conductivity
In Killiyar river, Electrical Conductivity (EC) showed no correlation with radon. Similar results were observed in previous studies15, 49. However, few other studies50,51 observed a weak positive correlation of radon with EC and moderate negative correlation with temperature. Conversely, Akawwi52 observed a negative correlation of radon with EC.
Correlation Among Water Quality Parameters
The correlation matrix (Table S1 and Table S2) shows relationship between different parameters in both seasons. EC is highly negatively correlated with resistivity in both seasons (r=-0.95 in PRM and -0.92 in POM). TDS showed high positive correlation with Na in both season (r=0.96, p <0.01) and with K (r=0.98 in PRM and 0.90 in POM). Salinity is positively correlated with Na (r= 0.97 in PRM and 0.93 in POM) and K (r=0.97 in PRM and 0.90 in POM, p <0.01). Cl also showed very high positive correlation with Na in both season (r=0.97, p <0.01) and with K (r=0.96 in PRM and 0.90 in POM, p <0.01). Na showed high positive correlation K (r=0.97 in PRM and 0.91 in POM, p <0.01). The correlation among the foresaid parameters (EC, Na, Cl, K) reflect a combined influence of marine inputs (seawater intrusion, marine sprays, tidal effects), anthropogenic inputs and agricultural runoff into the hydrochemistry of KR.
The discharge of tropical rivers is mainly contributed by the baseflow from groundwater during summer. The minimum flow that a river should have in order to preserve its ecosystems and environmental quality is known as ‘environmental flow (e-flow)’53. In Killiyar, one major challenge is the difficulty to sustain this e-flow during summer, and hence e-flow should be rejuvenated through an integrated holistic river management approach with community participation. The conservation of groundwater discharge sites on the river banks is one viable option. Further, communities on the river bank should be encouraged for aquifer recharging through various rainwater harvesting techniques. Another challenge is quality of riverine water towards downstream due to rapid urbanization. Unscientific waste dumping from human settlements and indiscriminate discharge of sewages directly into the river, reflects the local community’s inadequate exposure to proper waste management practices. Proper waste management–cum-awareness programme is a viable option for this.
Conclusion
This study characterizes 222Rn activity and different water quality parameters inKilliyar river (KR), Kerala (India) from upstream to downstream during two seasons, viz., pre- monsoon (PRM) and post-monsoon (POM). The radon activity showed spatial variations from upstream to downstream with anomalous higher values in upstream locations (S1, S2) and midstream (S5), and are likely zones of potential groundwater discharge into the river. Seasonal variation showed high radon activity during pre-monsoon (mean= 1150 Bq/m3) compared to post-monsoon (745 Bq/m3) and is due to dilution from monsoon. Based on the study, three groundwater potential zones were identified in the river, viz., high (222Rn >1000 Bq/m3), medium (500-1000) and low (100-500 Bq/m3) potential zones.
From the water quality analysis, it is found that, most of the parameters in most locations (except S9 and S10) were within permissible limits of BIS. In S10 most of parameters are relatively high due to anthropogenic contribution and also marine influence through estuary. Further, radon activity is not correlated with any of water quality parameters in the study area.
From the study, it is concluded that 222Rn isotopic application was used as a case study in Killiyar river and groundwater potential zones in Killiyar river course were identified. Methods like geophysical (resistivity) field surveys can be applied in this zone of river course for further groundwater prospecting and confining the groundwater potential. Further, stable isotopes (18O, 2H) and supplementary data viz., resistivity, piezometric levels, river discharge etc. could be applied to quantify groundwater discharge into river using mass balance approach.This baseline information would benefit local authorities and planners for implementing integrated holistic river management programmes for the sustainable environment flow of river especially during pre-monsoon season with community participation.
Acknowledgment
The author(s) thankfully acknowledge University of Kerala for providing laboratory facilities to carry out this work.
Funding Source
Author(s) thank Department of Atomic Energy- Bhabha Atomic Research Centre, Trombay, Mumbai for funding RAD7 instrument purchase and their encouragement to finish the work.
References
- Le Maitre D, Colvin C. Assessment of the contribution of groundwater discharges to rivers using monthly flow statistics and flow seasonality. Water SA. 2008; 34(5):594- 564.
CrossRef - Sophocleous M. Interactions between groundwater and surface water: the state of the science. Hydrogeology Journal. 2002; 10(1):52-67.
CrossRef - Brooklin D. G. Correlation of soil radon and uranium with indoor radon in Albuquerque, New Mexico area. Environ. Geol. 1991; 17(3):209-217.
CrossRef - Cecil L, Green J. Radon-222. In: Cook P, Herczeg L. Environmental Tracers in Subsurface Hydrology. USA: Springer, Boston, MA; 2000:175-194.
CrossRef - Szabo Z, Zapecza O. S. Geologic and geochemical factors controlling uranium, radium-226, and radon-222 in groundwater, Newark Basin, New Jersey. In: L. C. S. Gundersen, R. B. Wanty, C. K. Smoley. Field Studies of Radon in Rocks, Soils, and Water. USA: US Geological Survey; 1991:243-265.
- Cable JE, Burnett WC, Chanton JP, Weatherly GL. Estimating groundwater discharge into the northeastern Gulf of Mexico using radon-222. Earth Planet. Sci. Lett. 1996;144(3-4):591-604.
CrossRef - Dulaiova H, Gonneea ME, Henderson PB, Charette MA. Geochemical and physical sources of radon variation in a subterranean estuary—Implications for groundwater radon activities in submarine groundwater discharge studies. Mar. Chem. 2008;110(1-2):120-7.
CrossRef - Burnett WC, Peterson RN, Santos IR, Hicks RW. Use of automated radon measurements for rapid assessment of groundwater flow into Florida streams.J.Hydrol. 2010;380(3-4):298-304.
CrossRef - Tricca A, Porcelli D, Wasserburg GJ. Factors controlling the groundwater transport of U, Th, Ra, and Rn. J. Earth Syst. Sci. 2000;109(1):95-108.
CrossRef - Baskaran M. Radon: A tracer for geological, geophysical and geochemical studies. Basel: Springer; 2016.
CrossRef - Otton JK. The geology of radon. Washington: Government Printing Office; 1992.
CrossRef - Krupp K, Baskaran M, Brownlee SJ. Radon emanation coefficients of several minerals: How they vary with physical and mineralogical properties. Am. Min. 2017;102(7):1375-83.
CrossRef - Przylibski T. A. Estimating coefficient of radon emanation from crystallinerocks into groundwater. Appl. Radiat. Isot. 2000; 53 (3): 473–479.
CrossRef - Voronov A. N. Radon-rich waters in Russia. Environ. Geol. 2004; 46 (5): 630–634.
CrossRef - Sukanya S, Noble J, Joseph S. Factors controlling the distribution of radon (222Rn) in groundwater of a tropical mountainous river basin in southwest India. Chemosphere. 2021; 263: 128096https://doi.org/10.1016/j.chemosphere.2020.128096.
CrossRef - Morawska L, Phillips CR. Dependence of the radon emanation coefficient on radium distribution and internal structure of the material. Geochim. Cosmochim. Acta. 1993;57(8):1783-97.
CrossRef - Burnett W. C, Peterson R, Moore W. S, Oliveira J. D. Radon and radium isotopes as tracers of submarine groundwater discharge. Results from the Ubatuba, Brazil SGD assessment intercomparison. Estuar.Coast. Shelf Sci. 2008; 76(3):501-511.
CrossRef - Partington D, Knowling MJ, Simmons CT, Cook PG, Xie Y, Iwanaga T, Bouchez C. Worth of hydraulic and water chemistry observation data in terms of the reliability of surface water-groundwater exchange flux predictions under varied flow conditions. J.Hydrol. 2020;590:125441.
CrossRef - Shuler CK, Dulai H, Leta OT, Fackrell J, Welch E, El-Kadi AI. Understanding surface water–groundwater interaction, submarine groundwater discharge, and associated nutrient loading in a small tropical island watershed. J. Hydrol. 2020;585:124342.
CrossRef - Schubert M, Schmidt A, Paschke A, Lopez A, Balcazar M. In situ determination of radon in surface water bodies by means of a hydrophobic membrane tubing. Radiat. Meas. 2008;43(1):111-20.
CrossRef - Yang J, Yu Z, Yi P, Frape SK, Gong M, Zhang Y. Evaluation of surface water and groundwater interactions in the upstream of Kui river and Yunlong lake, Xuzhou, China. J. Hydrol. 2020;583:124549.
CrossRef - Kies A, Hofmann H, Tosheva Z, Hoffmann L, Pfister L. Using 222Rn for hydrograph separation a micro basin (Luxembourg). Annals of Geophysics. 2005;48(1):101-107.
- Horiba LAqua U-50 instruction manual. Horiba Ltd. Kyoto, Japan. 2016.
- APHA, Standard methods for the examination of water and waste water analysis, 22ndedition, American Public Health Association, Washington DC, USA(2012).
- Cook P, Favreau G, Dighton J, Tickell S. Determining natural groundwater influx to a tropical river using radon, chlorofluorocarbons and ionic environmental tracers. J Hydrology. 2003; 277(12): 74-88.
CrossRef - Wu Y, Wen X, Zhang Y. Analysis of the exchange of groundwater and river water by using Radon-222 in the middle Heihe Basin of northwestern China. Environ. Geol. 2004; 45(5):647-653.
CrossRef - Appleton J. D, Miles J.C.H. Radon in wales. In: Basset M.G, Deisler V. K, Nichol D. Urban Geology of Wales. Cardiff: National Museum of Wales Geological; 2005:117-1302.
- Przylibski T. A, Domin E, Gorecka J, Kowalska A. 222Rn Concentrationin Groundwaters Circulating in Granitoid Massifs of Poland. Water. 2020; 12(3): 748- 764.
CrossRef - Przylibski T. A, Gorecka J, Kula A, Fijalkowska-Lichwa K, Zagozdzon K, Zagozdzon P, Mista W, Nowakowski R. 222Rn and 226Ra activity concentration in groundwaters of southern Poland: new data and selected genetic relations. J Radioanal. Nucl. Chem. 2014; 301(3): 757-764.
CrossRef - Przylibski T. A. Shallow circulation groundwater-the main type of water containing hazardous radon concentration. Nat. Hazards Earth Syst. Sci. 2011; 11(6): 1695- 1703.
CrossRef - Singha S. P, Singh B. Water resource management in a hard rock terrain—A case study of Jharkhand State, India. APCBEE Procedia. 2012; 1:245–251.
CrossRef - Preeja K. R, Joseph S, Thomas J, Vijith H. Identification of groundwater potential zones of a tropical river basin (Kerala, India) using remote sensing and GIS techniques. J. Indian Soc. Remote. 2011; 39(1):83-94.
CrossRef - Sreeja R, Arun P. R, Mohan M, Pradeepkumar A. P. Groundwater Potential of a Fastly Urbanizing Watershed in Kerala, India: A Geospatial Approach. Int.J. Eng. 2015; 4(10):578-581.
CrossRef - Lamontagne S, Taylor A. R, Cook P. G, Crosbie R. S, Brownbill R, Williams R. M, Brunner P. Field assessment of surface water–groundwater connectivity in a semi- arid river basin (Murray–Darling, Australia). Hydrol Process. 2014; 28(4): 1561– 1572.
CrossRef - Kazemi R, Porhemmat J, Kheirkhah M. Investigation of Lineaments Related to Ground Water Occurrence in a Karstic Area: A Case Study in Lar Catchment, Iran.Res J Environ Sci. 2009; 3(3):367-375.
CrossRef - Miles J. C. H, Appleton J. D. Mapping variation in radon potential both between and within geological units. J Radiat Prot. 2005; 25(3):257-276.
CrossRef - Appleton J. D, Miles J. C. H. A statistical evaluation of the geogenic controls on indoor radon concentrations and radon risk. J EnvironRadioact. 2010; 101(10):799-803.
CrossRef - Harrington N, Noordijn S, Cook P. Evaluation of approaches to modelling surface water-groundwater interactions around drains in the South East of South Australia. Phase 1. Adelaide, South Australia: Goyder Institute for Water Research; 2012.12/1.
- BIS, 2012. Bureau of Indian Standard Specification for Drinking Water. IS: 10500: 2012. (Second Revision). BIS, New Delhi.
- Sukanya S, Joseph S. Water Quality Assessment using Environmetrics and Pollution Indices in a Tropical River Kerala, SW coast of India. Curr World Environ. 2020; 15(1):11-23.
CrossRef - Idriss H, Salih I, Sam A. K. Study of radon in groundwater andphysicochemical parameters in Khartoum state. J RadioanalNucl Chem. 2011; 290(2):333-338.
CrossRef - Sukanya S, Joseph S, Noble J. Evaluation of radiation dose from radon ingestion and inhalation in groundwater of a small tropical river basin, Kerala, India.Isotopes Environ Health Stud. 2020;4:1-12.
CrossRef - Roba C. A, Codrea V, Moldovan M, Baciu C, Cosma C. Radon and radium content of some cold and thermal aquifers from Bihor County (northwestern Romania). Geofluids. 2010; 10(4):571–585.
CrossRef - Cothern CR, Smith Jr JE, (editors). Environmental radon. Springer Science & Business Media; 2013; 35.
- Wilhelm E, Battino R, Wilcock RJ. Low-pressure solubility of gases in liquid water.Chem. Rev. 1977;77(2):219-62.
CrossRef - Tabar E, Yakut H. Radon measurements in water samples from the thermal springs of Yalova basin, Turkey. J Radioanal Nucl Chem. 2014;299(1):311-9.
CrossRef - Becker CJ. Groundwater Quality and the Relation Between pH Values and Occurrence of Trace Elements and Radionuclides in Water Samples Collected from Private Wells in Part of the Kickapoo Tribe of Oklahoma Jurisdictional Area, Central Oklahoma, 2011. US Department of the Interior, US Geological Survey; 2013.
CrossRef - Ye YJ, Xia XQ, Dai XT, Huang CH, Guo Q. Effects of temperature, salinity, and pH on 222Rn solubility in water. J RadioanalNucl Chem. 2019;320(2):369-75.
CrossRef - Rangaswamy DR, Srinivasa E, Srilatha MC, Sannappa J. Measurement of radon concentration in drinking water of Shimoga district, Karnataka, India. J Radio anal. Nucl. Chem. 2016;307(2):907-16.
CrossRef - Garg P, Krishan G. Radon Concentration Measurement in Groundwater of Roorkee, Uttarakhand, India. Curr World Enviorn. 2017; 12(2):396-400.
CrossRef - Singaraja C, Chidambaram S, Jacob N, Selvam S, Johnsonbabu G Anandhan P. Radon levels in groundwater in the Tuticorin district of Tamil Nadu, South India. J RadioanalNucl Chem. 2016; 307(2):1165-1173.
CrossRef - Akawwi E. Radon-222 concentrations in the groundwater along eastern Jordan Rift. J App Sci. 2014;14(4):309-16.
CrossRef - Arthington AH, Bunn SE, Poff NL, Naiman RJ. The challenge of providing environmental flow rules to sustain river ecosystems. Ecol Appl. 2006;16(4):1311-8.
CrossRef
Supplementary Materials
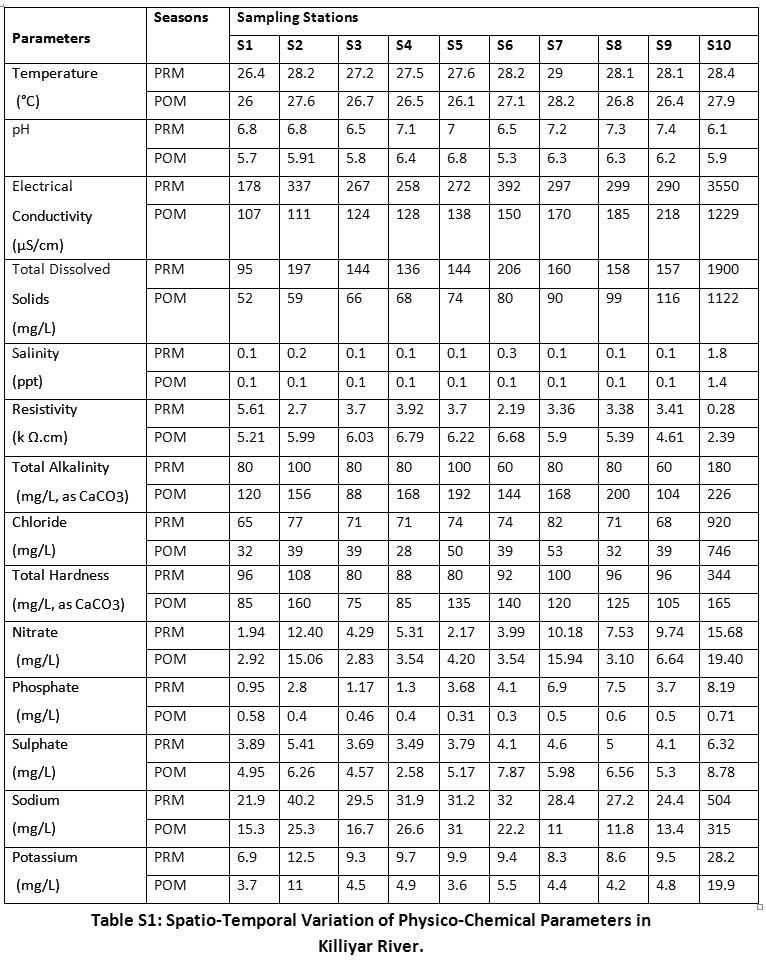 |
Table S1: Spatio-Temporal Variation of Physico-Chemical Parameters in Killiyar River. Click here to view Table |
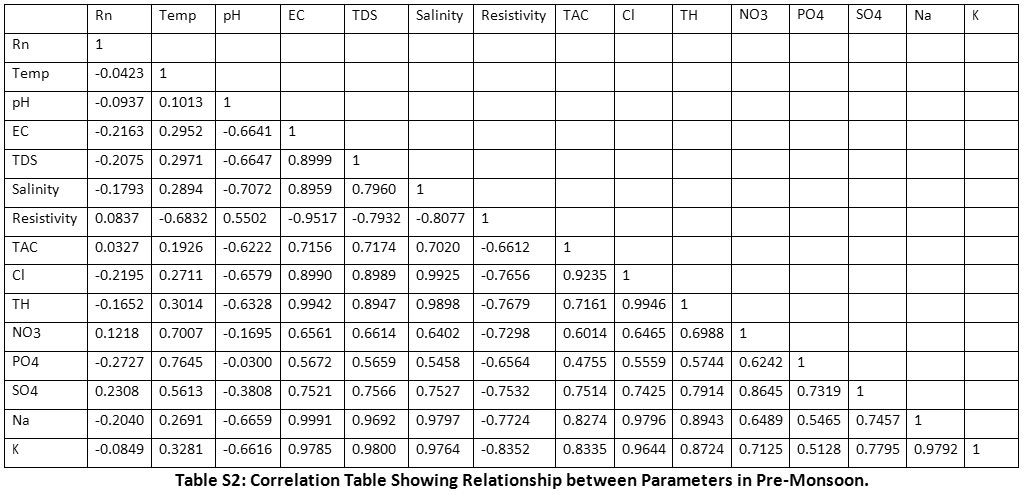 |
Table S2: Correlation Table Showing Relationship between Parameters in Pre-Monsoon. Click here to view Table |
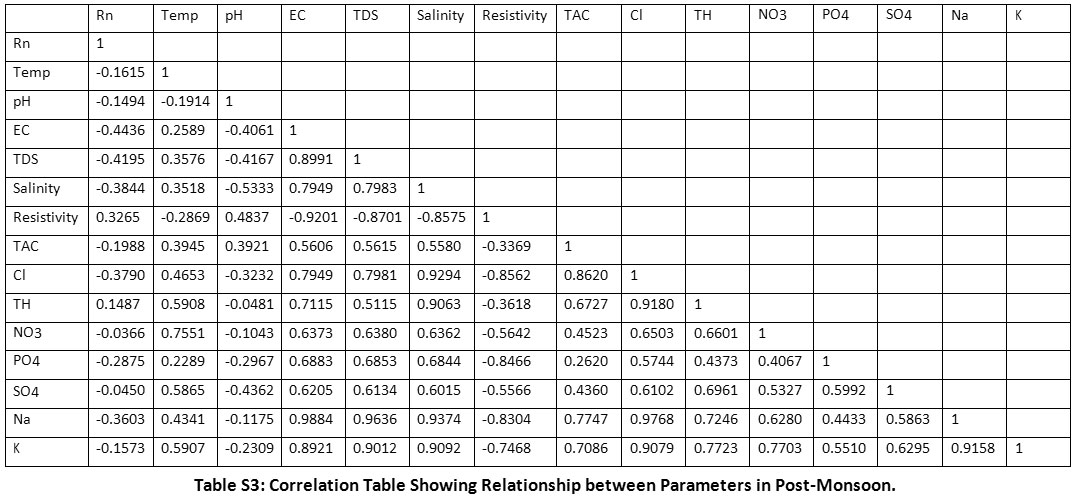 |
Table S3: Correlation Table Showing Relationship between Parameters in Post-Monsoon. Click here to view Table |


