Land Use Changes in Turkish Territories: Patterns, Directions and Socio-Economic Impacts on Territorial Management
Sema Yılmaz Genç1
 , Arian Behradfar2
, Rui Alexandre Castanho3,4,5,6
*
, Derviş Kırıkkaleli7
, José Manuel Naranjo Gómez3,4,8
and LuÃs Loures3,9
, Arian Behradfar2
, Rui Alexandre Castanho3,4,5,6
*
, Derviş Kırıkkaleli7
, José Manuel Naranjo Gómez3,4,8
and LuÃs Loures3,9
1
Department of Marketing and Advertising,
Ali Rıza Veziroglu Vocational School, Kocaeli University,
Kocaeli,
Turkey
2
Department of Geomatics and Spatial Information Engineering,
College of Engineering, University of Tehran,
Tehran,
Iran
3
VALORIZA - Research Centre for Endogenous Resource Valorization,
Portalegre,
Portugal
4
CITUR - Madeira - Centre for Tourism Research, Development and Innovation,
Funchal-Madeira,
Portugal
5
Faculty of Applied Sciences,
WSB University in Dąbrowa Górnicza,
Poland
6
School of Business and Economics and CEEAplA,
University of Azores,
Ponta Delgada,
Portugal
7
Department of Banking and Finance, Faculty of Economic and Administrative Sciences,
European University of Lefke,
Lefke,
Northern Cyprus,
Turkey
8
Agricultural School,
University of Extremadura,
Badajoz,
Spain
9
CinTurs-Centre for Spatial and Organizational Dynamics,
University of Algarve,
Faro,
Portugal
http://dx.doi.org/10.12944/CWE.16.1.11
Copy the following to cite this article:
Genc S. Y, Behradfar A, Castanho A. R, Kırıkkaleli D, Gómez J. M. N, Loures L. Land Use Changes in Turkish Territories: Patterns, Directions and Socio-Economic Impacts on Territorial Management. Curr World Environ 2021;16(1). DOI:http://dx.doi.org/10.12944/CWE.16.1.11
Copy the following to cite this URL:
Genc S. Y, Behradfar A, Castanho A. R, Kırıkkaleli D, Gómez J. M. N, Loures L. Land Use Changes in Turkish Territories: Patterns, Directions and Socio-Economic Impacts on Territorial Management. Curr World Environ 2021;16(1). Available From : https://bit.ly/3rF8C0n
Download article (pdf) Citation Manager Publish History

Introduction
Land systems comprise all methods and actions linked to the human use of land, including technological and organizational advances and orderings and the advantages obtained from land, and the unintended social and environmental consequences of societal actions. These systems have significant implications that lead to change in the land cover 1. Land use and land cover change are the main catalyst forces of global environmental change and are of significant concern because of their impact on various socio-economic sectors. These changes occur temporarily at different times and spatially, such as the extent of area and land-use intensity 2.
Human activities have been perceived as changing the Earth’s surface at an unprecedented rate and on broad scales. Such transformations are related to providing essential resources and materials 3.
Furthermore, the natural and anthropogenic circumstances are recognized as drivers of land use and land cover change. These changes are correlated with alteration in the biophysical environment, whereas modern changes are intimately connected to anthropogenic factors. The dynamics of land use resulting from urban expansion indicate variable trends over time and across space through Spatio-temporal dependencies. Various regions with different socio-economic characteristics and surrounding conditions and different hierarchical levels experience growing and declining paradigm shifts in population and urbanization 4-8.
It is a fact that land-use change studies provide endless new opportunities for land use planning considered to be a considerable resource for achieving sustainable development, contributing as well to improve life’s quality. Land use must be considered in sustainable development, once since their introduction has been faced as new development models included in land use affairs, mixing social and economic spheres. In this regard, the concept of sustainable development in land use planning suggests that development must occur, but that it must be quality growth 9.
During the past decade, Turkey has faced significant population growth resulting in unexpected socio-economic impacts and continuous urbanization and industrialization increase. While the considerable sustainability impacts of rapid development upon the environment and society, it is essential to evaluate Turkey's land-use change dynamics. These changes are linked to achieving sustainable territorial governance and management, environmental policies, and socio-economic planning. Furthermore, Turkey's territory is subjected to a high degree of soil erosion due to specific topographical structure and climate 10.
The literature regarding land-use and territorial planning mainly focuses on urban expansion dynamics at the local level from socio-economic developments. More specifically, most literature has been dedicated to the studies of land-use change in agricultural land 11, artificial land and urbanization 12, semi-natural areas 13, and wetlands and water bodies 14 at the local scales, including major cities. However, establishing settlement areas replacing productive land in particular regions of Turkey demands balanced strategic management at regional scales through land-use change studies. At the same time, Turkey is considered one of the most rapidly growing economies in Europe.
In studies conducted in distinct regions of Turkey territory regarding the land-use change, the typical finding is that residential areas' expansion has negatively affected the agricultural and pasture areas. Exceptionally, while the agricultural areas narrowed in western areas, forest areas expanded. After that, pasture areas decreased in this region while it expanded in northern areas. While the water surfaces decreased in southern areas, the agricultural areas expanded, and the agricultural and forest areas decreased in northern parts as the water surfaces expanded. In addition to residential areas in the north-eastern lands, while industrial areas expanded, agricultural areas decreased. At the time, agricultural, forest, and pasture areas decreased while other areas expanded in southern lands 15.
To obtain the synoptic overview and repeated monitoring of the Earth’s surface, satellite measurements add substantially to our contemporary perception of the global extent and land-change dynamics at many scales 16. Land-use and land cover characterization, mapping, and monitoring are essential and typical remotely sensed data applications. The availability and openness of reliable and suitable datasets perform an essential role in several global change studies. The land-use classification system has interoperability to assess, evaluate, compare, perform land use analysis, and investigate their changes over time. This system is currently the most comprehensive, internationally applied, and flexible framework for land use characterization 17.
The land cover represents spatial information about Earth’s surface on arrangements, activities, and inputs in a particular land cover type 14. However, the differences in needs, priorities, technical understanding and lack of accuracy assessment pose various challenges, ineffectiveness, and appropriate use of land cover mapping. As a result, global land cover products are frequently used as the best available alternative of maps at any scale 19.
European Union launched the Global Land Cover 2000 project (GLC2000) to recognize emerging opportunities for producing land cover mapping products. The GLC2000 has been chosen as a global core dataset for the millennium ecosystems assessment. Similarly, the Pan-European Land Cover Monitoring (PELCOM) project has been formulated to provide a land cover dataset covering the entire European-continent and having a high spatial accuracy, which can be periodically updated from 1996 14,16.
In that regard, the Pan-European CORINE Land Cover datasets also provide options for observing and studying the European landscape via land cover and its changes. The datasets mentioned above contain information for the last 30 years, a sufficient interval for the analysis and assessment of changes for each year, and the estimates of long-term trends in landscape dynamics 17, 18.
As a result, the CORINE project was intended to coordinate and ensure the consistency of existing knowledge on an up-to-date overview of the unique environment and possible changes in particular features of the European Union's biosphere (EU) 12.
CORINE Land Cover (CLC) maps are available as digital cartographic products. They have been generated mainly from the satellite imagery interpretation plus several ancillary datasets (geographical and statistical), depending on the country's availability. However, there are other ways to obtain it. Most countries of Europe have obtained the CLC from generalization methods of national maps with greater detail assembled into a seamless European map 19.
Exceeding some official guidelines established by the European Environmental Agency (EAA), each nation fulfills the methodology for assembling the CLC maps that adequately fit its precise circumstances based on data availability and processing sources. Variations in mapping methods may end in Spatio-temporal differences and disparities. Consequently, technical studies report deficiencies, and the results for analysis and interpretation of outcomes become crucial, mainly when there are variations in mapping arrangements over time 20.
CLC has been produced for reference years of 1990, 2000, 2006, 2012, and 2018, forming this study's period. The CLC specification aims to provide consistent localized geographical information on land use and land cover changes using 44 classes at 3-level in a standardized nomenclature. The vector map has a minimum mapping unit (MMU) of 25 ha and minimum feature width (MFW) of 100 m with a single thematic class attribute per land parcel. At the European level, the database is made available on a 100 x 100 m and 250 x 250 m raster, aggregated from the original vector data at a 1:100 000 scale. CLC also includes a change layer, which records changes between two of the 44 thematic classes with an MMU of 5 ha 21.
Generally, the uniformity in land cover maps results from different fundamental methods and patterns - several layouts, syntactic issues, classification scheme, spectral and schematic heterogeneity, and semantic aspects 22-23. Each of these methods and patterns is part of different approaches individually adapted to achieve particular needs. As a result, it is challenging to separate land-use changes for different methodologies to obtain cartographic CLC maps. Nevertheless, land use datasets are crucial to explore and investigate the socio-economic, environmental, political, and cultural factors and indicators related to land use impacts and trends 24.
Here should be highlighted other techniques and methodologies that are starting to be used, as is the example of the combined use of LiDAR, and remote sensing is also used. In this regard, some studies of particular interest are focused on Land-use mapping from aerial images and LiDAR data, as is the example of the research conducted by Jia et al.25, Rapinel, Hubert-Moy, & Clement26, or Yan, Shaker, & El-Ashmawy27, are just a few examples.
Understanding these impacts and trends associated with land-use change models provide a way forward to better link the territory planning and design and land-use change domain due to the territorial extent of most strategic planning and policies. The future of land-use change knowledge represents opportunities for efficient resource allocation, natural resource management, land use planning, and spatial distribution, and regional development analysis 28.
Land classification studies using CORINE methodology are very restricted due to specific geographical location and landscape values. As a result, providing land use maps initiates and strengthens Turkey's collaboration and the EU as long as the CORINE land cover data are available for nineteen adjacent countries. Contextually, it is possible to compare land-use change dynamics and associated socio-economic impacts in Turkey's territory with other territories in the EU. This comparison framework provides a significant opportunity for urban and rural communities to evaluate land-use conversion's potential impacts. Furthermore, as land, labor, and capita are essential inputs for economic and social benefits and developments, land-use change trends affect individuals' lives and how society is organized 29.
The main aim addressed in this article is to analyze and evaluate the land-use changes and their distribution in Turkey's territory. Unlike previous studies conducted on sub-regions, land-use has been evaluated on a country basis in this study. This analysis and evaluation will be carried out by quantifying and comparing the land-use change over time and across space from 1990 to 2018 to make suggestions to the decision-makers about the potential consequences of these trends on socio-economic impacts and territorial management. Furthermore, we will explore regional dynamics and trends by disaggregating them into a variety of specific regions based on socio-economic variables used in this study. In this way, the leading causes of land degradation can be preciously identified and discussed. The main ideas of choosing the proposed variable are that they have been repeatedly used in the socio-economic studies, particularly those following the land-use change impacts on territorial developments.
Recently, land-use changes have happened very rapidly due to the implementation of various social and economic planning and Turkey policies. The land-use change study's key objective is to identify the socio-economic changes accompanying each type of land-use change. It is challenging to recognize whether socio-economic changes have been caused or influenced by a particular land-use change or have resulted from a different influence. This process can be very complicated. Analyzing statistical data at the statistical local area scale and extending socio-economic changes observed at this scale provide an opening to identify whether these trends are likely to be related to the specific land-use change or similar to changes occurring in other regions experiencing different mixes of land use and land-use changes 30.
This process enables us to understand the changes happening at a regional scale in Turkey, and identification of these dynamics led to community-wide changes in social and economic characteristics. In this way, the strongest association between land-use change and socio-economic variables regarding land, labor, and capital for Turkey's territory can be found. As a result, all barriers and opportunities for sustainable growth based on land-use change analysis will be discussed.
Material and Methods
The Study Area
The area of Turkey is 783,356 square kilometers (302,455 sq. mi.). Agricultural areas cover 44% of the territory whereas forests, mostly covering the coastal and mountain areas, dominate 15% of the total land area. Developed lands totally account for 1.8% of the total land area in Turkey 31. Around two-thirds of the total population is centralized in the twelve largest cities, a significant phenomenon in terms of economy, services, infrastructure provision, and social welfare. Furthermore, over 80% of economic output is produced in these cities, mostly are located in the north-western region of the territory. Lower costs and connections to external economy contributed to the development of secondary cities, the so-called ‘Anatolian Tigers’ in Turkey. During the last decade, these cities have become industrial agglomerations and recorded high rates of unplanned growth in economic impacts and urban development 32.
During the proposed period in this study (1990-2018), the population of Turkey increased from 56.4 to 80.81 million, indicating 43% increase, along with a rising trend in urban land cover indicating almost 37% increase. In addition to these growth rates, increasing levels of income, growing financial opportunities, and accessibility and community structure dynamics have resulted in high demand for housing, infrastructure and social capita along with transformative mobility, land use and urban functions. Furthermore, active intervention and mediated institutional factors in agricultural lands, forests and semi-natural areas have resulted in changes to development patterns and directions 33.
The 2000s and 2010s are the critical period of transmutation in land use management and planning in the territory of Turkey, mostly influenced by the adaption process of the EU’s regional policies based on new legislative and institutional arrangements. Within the land use planning framework introduced and adopted to comply with EU regional policy in 2002, the classification of territory in Turkey consists of 26 regions, based on spatial planning system, major infrastructure and investments. This process is followed by the establishment of development agencies aiming at promoting regional developments, ensuring sustainability 10.
Data and Methodology
The data acquisition process is a fundamental step in spatial analysis of land use change. In this regard, using spatially statistical data is advantageous, reflecting the time continuity during the study period and representing the spatial information for different land use planning. To achieve the purposed objective, this study primarily relies on CLC. As we discussed, the CLC is a vector map that can represent similar landscape patterns and trends. More than 75% of these patterns and trends have the characteristics of a given class from nomenclature. This nomenclature is a three-level hierarchical classification system with forty-four classes at the third and the most detailed level (see CLC nomenclature32,33). Furthermore, a set of generalization rules are defined to deal with areas that are smaller than the minimum cartographic unit (MCU) of 25 ha at a scale of 1: 100,000.
The CLC data has been preferred for this study due to the fact that the CORINE project provides the latest data sources for territorial studies, especially in dynamics of land use as widely used in the literature in analysing land use changes for different purposes 34. furthermore, earlier studies showed that the inconsistency between two consecutive CLC change layers was modest, covering less than 1% of all changes 31,32.
As the first step in monitoring land-use change trends, it is essential to attain the administrative divisions of the Nomenclature of Territorial Units for Statistics (NUTS 2) of Turkey (Figure 1), as mentioned including 26 subregions. In addition to CLC data, socio-economic indicators for all of the subregions are required. This information supplied by the European Environment Agency (EEA) and Turkish Statistical Institute (TurkStat) provides basic socio-economic statistics for the application of regional policies 11. In this way, we can obtain the spatial distribution of socio-economic characteristics regarding the delimitation of Turkey. Table 2 illustrates the 19 distinct variables that we consider in this article.
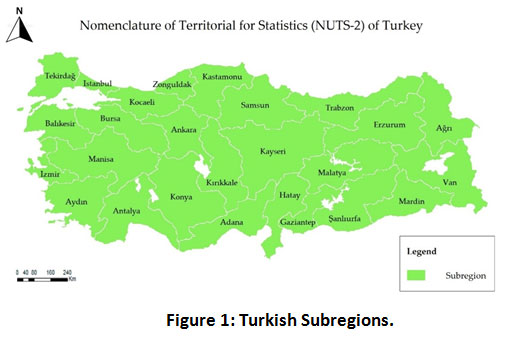 |
Figure 1: Turkish Subregions. Click here to view Figure |
Table 1: Variables Used.
|
Variable |
Identifier |
Source |
|
Population |
V1 |
Turkey in Statistics |
|
Age dependency ratio percentage (of working-age population) |
V2 |
Turkey in Statistics |
|
Average number of people in a household receiving social benefits in relation to the average number of persons per household |
V3 |
Turkey in Statistics |
|
Average monthly income per capita of private households |
V4 |
Turkey in Statistics |
|
Educational access and output percentage in early childhood at the age of 3-6 |
V5 |
Turkey in Statistics |
|
Adult participation in lifelong learning |
V6 |
Turkey in Statistics |
|
Prime-age adults (18-59) in jobless households |
V7 |
Turkey in Statistics |
|
Long-term unemployed persons in registered unemployed persons in total |
V8 |
Turkey in Statistics |
|
Unemployment rate |
V9 |
Turkey in Statistics |
|
Consumption of water in households during the year per capita |
V10 |
Turkey in Statistics |
|
Consumption of electricity in households during the year per capita |
V11 |
Turkey in Statistics |
|
Consumption of gas in households during the year per capita |
V12 |
Turkey in Statistics |
|
Average monthly consumption of meat per capita |
V13 |
Turkey in Statistics |
|
Average monthly consumption of vegetables per capita |
V14 |
Turkey in Statistics |
|
Natural persons conducting economic activity per 100 persons of working age |
V15 |
Turkey in Statistics |
|
Gross domestic product (GDP) at current market prices by NUTS 2 |
V16 |
Eurostat |
|
Share in national GDP |
V17 |
Eurostat |
|
Euro per inhabitant |
V18 |
Eurostat |
|
Purchasing power standard (PPS) per inhabitant |
V19 |
Eurostat |
The mentioned variables have to follow a normal distribution accompanied by the use of the Shapiro-Wilk test as the number of subregions in the NUTS2 about Turkey is 26. However, some of these variables would not follow a standard distribution. In this study, the results showed that the significance level is less than 0.05. consequently, we conduct a normalization for every variable so that they all could have equal weight in the socio-economic classification of the 26 subregions. After that, it is necessary to evaluate all considered variables to make sure they are normalized. Therefore, we repeated the Shapiro-Wilk test, which verified that all variables had been successfully normalized as long as the significance reached p>0.05. The Shapiro Wilk system employs a data base that has not been treated in the frequency distribution table. After that, data can be distributed and divided into advanced clusters 39.
As the next step, it is necessary to cluster the 26 subregions of Turkey into groups based on the socio-economic impacts. Therefore, we used cluster analysis as a multivariate method that aims to classify items representing clusters of matters with an extreme level of internal homogeneity and external heterogeneity. Furthermore, the priority of clusters would not be considered in this method. As long as the cluster analysis is so sensitive to the existence of atypical components, we select the variables directly related to the classification procedure and conduct a PCA (Principal Component Analysis). The PCA method captures maximum variances in a finite number of orthogonal components based on an eigenvector analysis of the data correlation matrix, or proximity matrix 17.
Whenever the atypical components were observed in the classification procedure, the similarity between atypical components could be easily measured by mean of the proximity matrix and the mean squared Euclidean distances. As a result, it is possible to determine the similarity or resemblance between every two distinct components that we intend to group (Table 2 and 3).
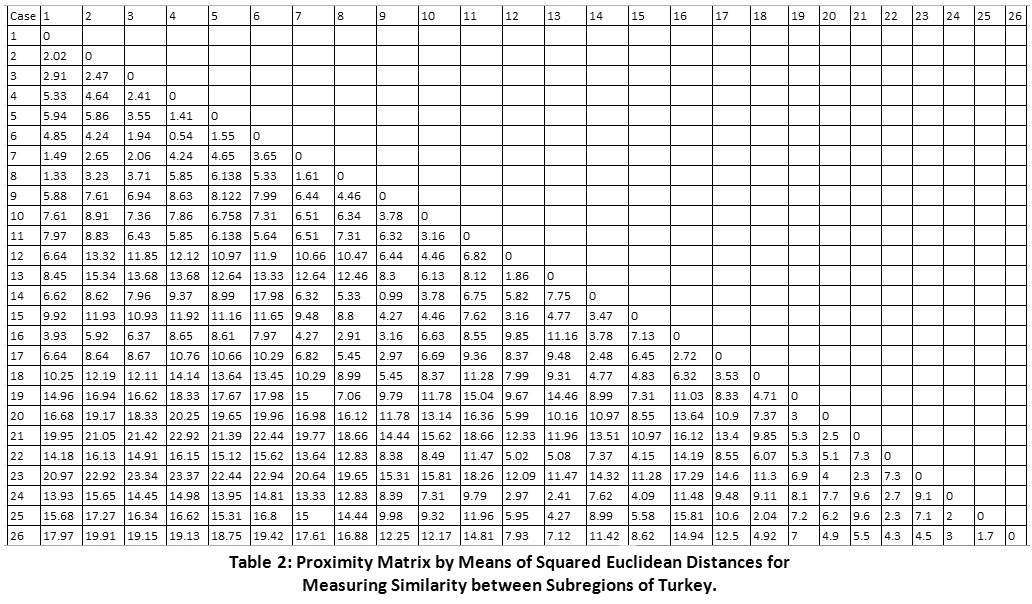 |
Table 2: Proximity Matrix by Means of Squared Euclidean Distances for Measuring Similarity between Subregions of Turkey. Click here to view Table |
Table 3: Related Cases Corresponding to 26 Subregions in Turkey and their Abbreviations in the NUTS2.
|
Case |
|||
|
1: Istanbul Subregion (TR10) |
2: tekirdaÄŸ Subregion (TR21) |
3: Balıkesir Subregion (TR22) |
4: Izmir Subregion (TR31) |
|
5: Aydın Subregion (TR32) |
6: Manisa Subregion (TR33) |
7: Bursa Subregion (TR41) |
8: Kocaeli Subregion (TR42) |
|
9: Ankara Subregion (TR51) |
10: Konya Subregion (TR52) |
11: Antalya Subregion (TR61) |
12: Adana Subregion (TR62) |
|
13: Hatay Subregion (TR63) |
14: Kırıkkale Subregion (TR71) |
15: Kayseri Subregion (TR72) |
16: Zonguldak Subregion (TR81) |
|
17: Kastamonu Subregion (TR82) |
18: Samsun Subregion (TR83) |
19: Trabzon Subregion (TR90) |
20: Erzurum Subregion (TRA1) |
|
21: Ağrı Subregion (TRA2) |
22: Malatya Subregion (TRB1) |
23: Van Subregion (TRB2) |
24: Gaziantep Subregion (TRC1) |
|
25: Şanlıurfa Subregion (TRC2) |
26: Mardin Subregion (TRC3) |
|
|
As we obtain the clusters, the analytic hierarchy process and the farthest neighbor method can be used. By doing so, the combined variables result in 3 clusters of subregions of Turkey based on the socio-economic development impacts. According to the descriptive information of each obtained cluster, as the average of the analyzed essential variables, for instance, it is possible to separate land-use patterns and socio-economic characteristics from each other by lowest, typical, and highest development impact.
As we specify the characteristic of three obtained clusters that we consider in land use studies of Turkey based on CLC, the total land surface area related to different land use in socio-economic development classification can be precisely determined. For this purpose, we used ArcGIS 10.7.1 to analyze spatial data layers delineate Turkish subregions and land use for the years 1990, 2000, 2006, 2012, and 2018. As a result, land-use variations of the studied area have been determined during these years. Furthermore, information regarding these changes can contribute to a better understanding of spatiotemporal influences of the socio-temporal developments on land allocation to a particular user based on different subregions.
Results and Discussion
In this section, we will represent the results for land use change analysis of Turkey in the years of 1990, 2000, 2006, 2012, and 2018 with the help of different plots and tables obtained from GIS tools and CLC. In this way, the most critical information regarding specification and progression of land-use changes can be precisely comprehended. The following figures (figures 2, 3, 4, 5, and 6 regarding the subsequent years respectively) and tables show the trends and associated information of land-use changes in Turkey separated for the years.
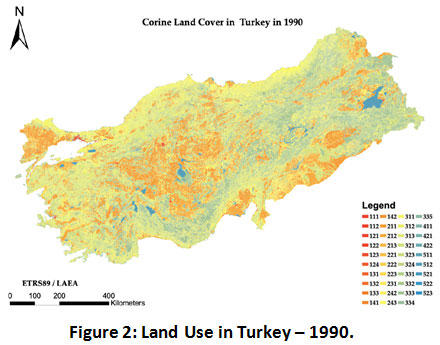 |
Figure 2: Land Use in Turkey – 1990. Click here to view Figure |
Considering Figure 2, it is clear that the agricultural areas and forest and semi-natural areas formed most Turkish territories by a homogeneous distribution. Artificial surfaces are located mainly in central and partly in peripheral areas due to territorial basis. Most of the wetlands and water bodies can be found in the eastern and central parts of the country, which is explained by the distribution of the ecosystem variety and the mountains.
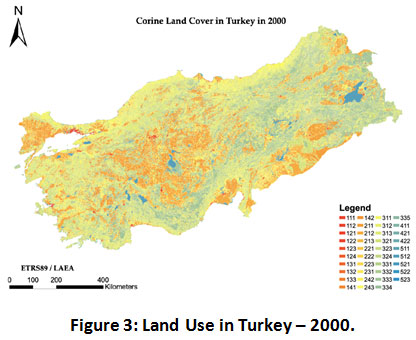 |
Figure 3: Land Use in Turkey – 2000. Click here to view Figure |
Once we compare the CLC of Turkey in 1990 with the updated version back in 2000 (Figure 3), we find out that there is not much change at first sight. However, the gradual increase in artificial surfaces, especially in urban areas, is entirely sensible. Consequently, a declining trend in the agriculture areas is observable, although they were still the most predominant all over the territory. Other areas were almost steady as compared with 1990.
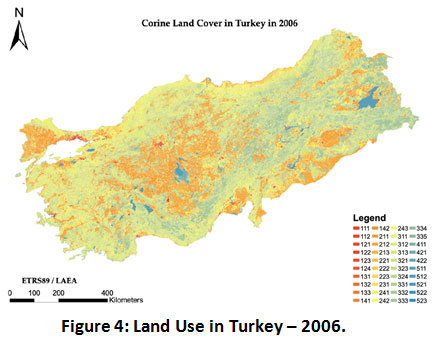 |
Figure 4: Land Use in Turkey – 2006. Click here to view Figure |
The change in land use between 2000 and 2006 shows a considerable growth in urban areas and artificial surfaces, and water bodies. Agricultural and semi-natural areas both experienced decreasing trends in this period due to human activities' impact. A downward trend in wetlands was also verified.
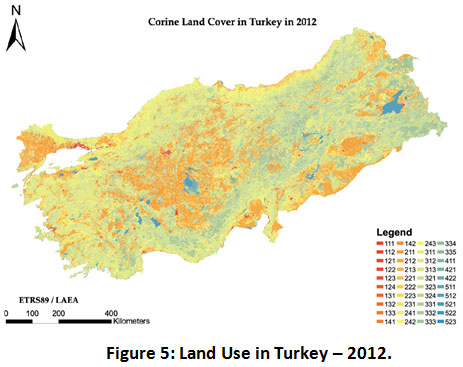 |
Figure 5: Land Use in Turkey – 2012. Click here to view Figure |
By analyzing Figure 5, it is possible to observe the continuous increasing trend in the urban settlements and, thereby, their related artificial surfaces. This increase is the result of occupying some agricultural areas that caused a reduction in the mentioned areas. Compared with 2006 CLC, the area of wetlands was maintained to the previous value, but water bodies area has increased significantly.
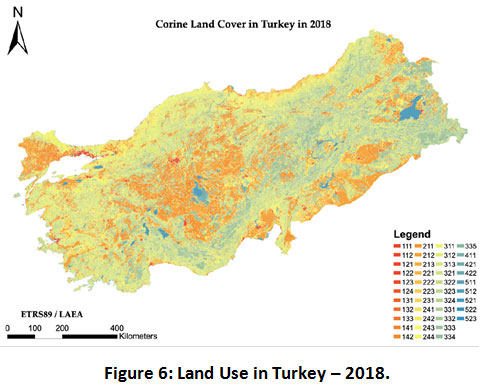 |
Figure 6: Land Use in Turkey – 2018. Click here to view Figure |
The results of land use in 2018 indicated that the previous paradigm shifts of land-use change in Turkey continued at a more sustainable pace, due to recent studies in land use planning and consequential policy making in Turkey regarding land use. Furthermore, there was a significant land-use change in semi-natural areas typically devoted to agricultural purposes. The percentages of each classified land use based on CLC Nomenclature for considered years are represented in the following tables (4 to 8):
Table 4: Percentage of Artificial Surfaces based on CLC for Level 3 in Turkey.
|
Code |
111 |
112 |
121 |
122 |
123 |
124 |
131 |
132 |
133 |
141 |
142 |
|
|
Year |
1990 |
0.04 |
0.94 |
0.12 |
0.03 |
0.005 |
0.007 |
0.09 |
0.008 |
0.02 |
0.25 |
0.09 |
|
2000 |
0.04 |
1.16 |
0.14 |
0.04 |
0.005 |
0.007 |
0.15 |
0.008 |
0.03 |
0.22 |
0.12 |
|
|
2006 |
0.045 |
1.36 |
0.17 |
0.055 |
0.005 |
0.007 |
0.22 |
0.008 |
0.05 |
0.21 |
0.16 |
|
|
|
2012 |
0.045 |
1.48 |
0.19 |
0.055 |
0.005 |
0.007 |
0.28 |
0.008 |
0.07 |
0.20 |
0.20 |
|
|
2018 |
0.05 |
1.58 |
0.21 |
0.06 |
0.005 |
0.007 |
0.32 |
0.008 |
0.08 |
0.20 |
0.22. |
The highest value is represented in bold.
The trends in artificial surfaces for target years and detailed data are shown in Table 4. The most frequent of these land-use change types are emphasized here: the highest land use values could be found on Urban fabric 11 (level 2) and discontinuous urban fabric 112 (level 3), which has been increasing over the years. The results also show little variation in industrial, commercial, and transport units (12), while mineral sites (131) and facilities (142) were the most affected land use by increasing shifts. There has been a noteworthy declining shift in green urban areas (141) as well.
Table 5: Agricultural Areas Percentage based on CLC for Level 3 in Turkey.
|
Code |
211 |
212 |
222 |
231 |
|
|
Year |
1990 |
29.2 |
1.3 |
3.3 |
14.9 |
|
2000 |
28.6 |
1.5 |
3.5 |
14.1 |
|
|
2006 |
27.8 |
2.1 |
3.8 |
13.5 |
|
|
2012 |
26.7 |
2.5 |
4.2 |
13.2 |
|
|
|
2018 |
26.2 |
3.2 |
4.4 |
12.4 |
The highest land use in agricultural areas has always been allocated to arable land (21), especially the non-irrigated one (211). However, there has been a decreasing trend over the years due to the factors affecting agricultural productivity, mechanization, and other socioeconomic issues. Unlike irrigated land use (212) faced a growing shift these years, explained by intensive farming, industrial agriculture, and sustainable methods. The next most representative land use of agricultural areas of Turkey is pasture (231), which declined over the years. Plantation (222) areas also experienced a raise at a slower pace regarding other land uses in the cluster.
Table 6: Semi-Natural Areas Percentage based on CLC for Level 3 in Turkey.
|
Code |
311 |
312 |
313 |
321 |
324 |
331 |
332 |
333 |
334 |
|
|
Year |
1990 |
15.4 |
12.6 |
8.1 |
6.1 |
3.5 |
0.9 |
0.1 |
0.14 |
0.05 |
|
2000 |
15.7 |
13.2 |
8.3 |
6.1 |
3.6 |
0.9 |
0.1 |
0.13 |
0.05 |
|
|
2006 |
15.9 |
14 |
8.4 |
6.2 |
3.6 |
1.1 |
0.1 |
0.13 |
0.06 |
|
|
2012 |
16.2 |
14.95 |
8.6 |
6.3 |
3.7 |
1.1 |
0.1 |
0.12 |
0.07 |
|
|
|
2018 |
16.4 |
15.4 |
8.8 |
6.3 |
3.8 |
1.2 |
0.1 |
0.10 |
0.07 |
The highest value found is in bold.
Table 6 represents the percentage distribution of forest and semi-natural areas by different typical forests (31), vegetation associations (32), and open spaces with little vegetation (33). An increasing overall shift could be observed over the years, mostly in forests. Furthermore, broad-leaved (311) and coniferous forest (312) respectively cover the most common land use in the semi-natural area's cluster and have had the most growing devoted trends.
Table 7: Wetlands Percentage Based on CLC for Level 3 in Turkey.
|
Code |
411 |
412 |
421 |
423 |
|
|
Year |
1990 |
0.41 |
0.02 |
0.33 |
0.1 |
|
2000 |
0.41 |
0.02 |
0.34 |
0.1 |
|
|
2006 |
0.43 |
0.02 |
0.34 |
0.1 |
|
|
2012 |
0.44 |
0.02 |
0.36 |
0.1 |
|
|
|
2018 |
0.45 |
0.02 |
0.37 |
0.1 |
The highest value found is in bold.
Analyzed results of land-use changes in Turkey demonstrate that wetlands percentage is relatively stable over the years. However, there has been a low increase in inland marshes (411) and salt marshes (421). The highest value of the wetlands group belongs to inland marshes as well.
Table 8: Water Bodies Areas Percentage based on CLC for Level 3 in Turkey.
|
Code |
511 |
512 |
521 |
523 |
|
|
Year |
1990 |
0.37 |
1.32 |
0.02 |
0.27 |
|
2000 |
0.39 |
1.35 |
0.02 |
0.27 |
|
|
2006 |
0.40 |
1.36 |
0.02 |
0.27 |
|
|
2012 |
0.41 |
1.38 |
0.02 |
0.27 |
|
|
|
2018 |
0.43 |
1.41 |
0.02 |
0.27 |
The highest value found is in bold.
The three clusters obtained allow grouping of the subregions into three classes, as shown in Figure 7. As the subregions have been classified based on proposed socio-economic variables, they can be characterized based on descriptive statistics and proposed variables. The most developed class from the socio-economic perspective is highlighted in developed highly, while the medium development class is shown as developed moderately, and finally, the notation of the less developed class is developed little.
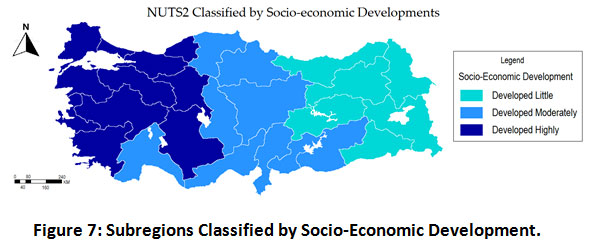 |
Figure 7: Subregions Classified by Socio-Economic Development. Click here to view Figure |
Conclusions
This article dealt with Turkey's land-use changes in the years 1990, 2000, 2006, 2012, and 2018. The comprehensive understanding of land-use change patterns comes from paradigm shift analysis accompanying substantial evidence of Turkey territory, and the region necessitated by sustainable development has been achieved. The results showed a tremendous and gradual land-use change from agricultural to mostly artificial surfaces. The majority of land-use changes are related to industrial and commercial units and construction sites. The most degraded agricultural land uses are non-irrigated arable land and pastures, while there is an increasing trend in permanently irrigated land. Various agricultural land use practices and impact analyses explain this issue. Furthermore, a minor increase in forests and semi-natural areas indicates remarkable attention and tendency toward management and conservation strategies in the territory.
The separation of urban and non-urban land uses in the region, and various levels of CLC source indicate that population and both urban and non-urban land-use change rates are unlike and unequal. Regional diversity in residential development and Spatio-temporal patterns of urban development and spatial inequality regarding socio-economic impacts are crucial in the country's economy 38-45. As the results show, the spatial developments of the Turkey territory are hugely affected by the regional economic level10. The comparative analysis on land-use change in Turkey territory indicates that as the western and north-western subregions faced a rapid increase in urban areas and industrial units, the less-developed regions, especially the east and north subregions, experienced similar trends in land use at a languid pace. These patterns in land-use change can be explained by the distribution and concentration of industrial and commercial units.
Due to proposed patterns, regional development conflicts can also describe the considerable differences in the composition of industries and income levels of subregions, regional conflicts in economic output, population density, and industrial employment. The direction of these changes can be a reliable basis for spatial planning and government schemes to promote balanced regional developments. In this regard, the "Priority Development Areas" and related policy-making framework, East and South-East Development Projects, Regional Development Plan for the Eastern Black Sea Region, and other projects are some of the significant evidence.
Different land use and land cover change trends indicate a highly diverse dynamic, depends on various factors comprising differences in urbanization procedure, socio-economic impacts, distinct locational characteristics, and regional development disparities. The persisting pressure of urban growth and proposed rapid urban development trends will continue in the territory. Similarly, the increasing demand for industrial and commercial units in Turkey needs the exact allocation process. Therefore, the land use planning and policy-making authorities should point to new development areas at both the national and regional levels.
The present research in land-use changes in Turkey provides practical evidence for the recognition and evaluation paradigm shifts in land use and identification of significant drivers of land development at the regional level. Our contribution, combined with the provision of national statistics, socio-economic characteristics, and critical measurements in land-use changes in the proposed period (1990-2018). This study's outcome can be considered a surveying baseline for the comparative analysis of similar works for different land-use change trends in Europe or worldwide. Land-use change studies are reliable tools to evaluate the human activities and footprint of proposed strategies and policies in a territory. Land use studies provide an analysis of the future urban land estimations. It is necessary for formulating well-planned and forward-looking strategies to distribute and allocate scarce land-use efficiency. The finding of this study, along with the availability of other data sources at the regional level and a wide range of impacts such as geological studies, demographic issues, soil, climatic features, and social capital, can be considered for prospective research land-use change in Turkey.
Contextually, Governors in Turkey should design development policies to encourage industrial investments and agricultural investments in Turkey and adjust the relevant land use/land cover policies to mitigate agricultural land fragmentation. However, likely, rising socioeconomic activities, urban expansion, and road construction linked with population and economic development will affect the agricultural sector and land usage negatively in the near future.
Nevertheless, it should be considered the relevance of similar research carried out worldwide and, more specifically, in another European territory. For example, there is the research conducted by Castanho, Naranjo Gómez and Kurowska-Pysz 18in the Polish territories, or the studies conducted by Naranjo Gómez et al. for the insular territory of Canary Islands 3, are just a few examples of this typology of research line. If we focus on related studies, it is possible to confirm that the changes over land use in territories as Poland in the last twenty years did not continues the trend of the bordering nations as Germany, Slovakia, and the Czech Republic, where the land-use changes were not so stable but much more progressive 45,46. A similar situation occurs in the present study with the Turkish territory. Suppose we consider a previous study regarding land-use changes in all European territories 45, where it is possible to verify that the tendency of the neighbor territories of Turkey as Greece or Cyprus is not the same as in the analyzed territory. Accordingly, it reveals all the importance of carrying out this typology of studies to understand the territorial tendencies and adequately plan the territorial and consequent management and governance.
Study Limitations and Prospective Research Lines
Yet this research increases our knowledge of the patterns, dynamics, and particularities that the land-use changes present in the Turkish territories, fundamental aspects for future research continue.
It is a fact that territorial policies and societies behaviors are often varying in these regions, leading to the requirement of a carefully monitoring process and the development of new analysis over the trends and dynamics of the land-use changes and the management of sustainable growth approaches.
Besides, even if the presented investigation has produced some critical outlooks on the land-use changes in the Turkish territories, if extra indicators and variables were picked and blended with the land-use changes, it would confer us more extended conclusions.
Furthermore, the study focuses on general and empirical analysis to identify barriers and territorial sustainable development possibilities. Nevertheless, for more specific limitations and opportunities description and to design the logical guidelines, other topics, methods, and prospects should be considered.
Acknowledgments
The authors would like to acknowledge the financial support of the National Funds provided by FCT—Foundation for Science and Technology to VALORIZA—Research Center for Endogenous Resource Valorization.
References
- Bartholome & Belward, 2005; Bishr, 1998; Büttner, 2014; de Campos Macedo et al., 2018; Feranec, Jaffrain, Soukup, & Hazeu, 2010; García-Álvarez & Camacho Olmedo, 2017; Hazeu et al., 2016; Hennig et al., 2015; Marchant & Lane, 2014; Meyer, Meyer, & BL Turner, 1994; Modugno, Balzter, Cole, & Borrelli, 2016; Neumann, Herold, Hartley, & Schmullius, 2007; Pereira, Aranha, & Amraoui, 2014; Pinto-Correia & Kristensen, 2013; Sahle & Yeshitela, 2018; Salvati, Zambon, Chelli, & Serra, 2018; Union, 2007; Weber, 2007; Wright, 1982.
- P.H. Verburg, N. Crossman, E.C. Ellis, A. Heinimann, P. Hostert, O. Mertz, H. Nagendra, T. Sikor, K.-H. Erb, N. Golubiewski, R. Grau, M. Grove, S. Konaté, P. Meyfroidt, D.C. Parker, R.R. Chowdhury, H. Shibata, A. Thomson, L. Zhen. Land system science and sustainable development of the earth system: a global land project perspective. Anthropocene, 12 (2015), pp. 29-41.
CrossRef - Surya, B.; Ahmad, D.N.A.; Sakti, H.H.; Sahban, H. Land Use Change, Spatial Interaction, and Sustainable Development in the Metropolitan Urban Areas, South Sulawesi Province, Indonesia. Land 2020, 9, 95.
CrossRef - Naranjo Gómez, J.M.; Lousada, S.; Velarde, J.G.; Castanho, R.A.; Loures, L. Land-use changes in the canary archipelago using the CORINE data: A retrospective analysis. Land 2020, 9, 232.
CrossRef - Dibaba, W.T.; Demissie, T.A.; Miegel, K. Drivers and Implications of Land Use/Land Cover Dynamics in Finchaa Catchment, Northwestern Ethiopia. Land 2020, 9, 113.
CrossRef - Castanho R.A., Naranjo Gómez, J.M., Vulevic, A., Behradfar, A., and Couto, G. Assessing Transportation Patterns in the Azores Archipelago. Infrastructures 2021, 6, 10. https://doi.org/10.3390/ infrastructures6010010.
CrossRef - Castanho, R.A., Naranjo Gómez, J.M., Cabezas, J. Loures, L., Martín Gallardo, J., and Garrido Velarde, J. Green Peri-Urban Surfaces in Iberian Euro-ci4es: Ecosystem Services as a Tool to Provide an Environmental Answer to Border Populations Needs. A Preliminary Approach. Chapter 2 in the Book: New Metropolitan Perspectives: Knowledge Dynamics and Innovation-driven Policies Towards Urban and Regional Transition Volume 2. Ed. Springer. ISBN: 978-3-030-48278-7. pp. 11-20. https://doi.org/10.1007/978-3-030-48279-4_2.
CrossRef - Van Ittersum, M.K., Rabbinge, R. Van Latesteijn, H.C. Exploratory land use studies and their role in strategic policy making, Agricultural Systems, Volume 58, Issue 3, 1998, Pages 309-330, ISSN 0308-521X,https://doi.org/10.1016/S0308-521X(98)00033-X.
CrossRef - Bielecka, E. GIS Spatial Analysis Modeling for Land Use Change. A Bibliometric Analysis of the Intellectual Base and Trends. Geosciences 2020, 10, 421. https://doi.org/10.3390/geosciences10110421.
CrossRef - Carlos Loures L. Introductory Chapter: Land-Use Planning and Land-Use Changes as Catalysts of Sustainable Development Open access peer-reviewed chapter; 2019.
CrossRef - Ustaoglu, E.; Aydınoglu, A.C. Regional Variations of Land-Use Development and Land-Use/Cover Change Dynamics: A Case Study of Turkey. Remote Sens. 2019, 11, 885.
CrossRef - Tanrivermis H., Agricultural land use change and sustainable use of land resources in the Mediterranean region of Turkey. Journal of Arid Environments. 54 (3). 2003. 553-564.
CrossRef - Çakir, Günay & Ün, C. & BaÅŸkent, Emin & Köse, S. & Sivrikaya, Fatih & KeleÅŸ, Sedat. (2008). Evaluating urbanization, fragmentation and land use/land cover change pattern in Istanbul city, Turkey from 1971 TO 2002. Land Degradation & Development. 19. 663-675.
CrossRef - Alphan H., Landâ€use change and urbanization of Adana, Turkey. Land Degradation & Development. (2003) 14(6).
CrossRef - Ataol M., Murat Kale m., The Balance of Irrigated Land and Wetland in Turkey. Public Finance, Public Administration & Environmental Studies. 2018.
- Yücer, A. (2020) The Land Use in Turkey: A General Assessment and Affecting Factors. Journal of Geoscience and Environment Protection, 8, 102-116.
CrossRef - García-Álvarez, D.; Camacho Olmedo, M.T. Changes in the methodology used in the production of the Spanish CORINE: Uncertainty analysis of the new maps. Int. J. Appl. Earth Observ. Geoinf. 2017, 63, 55–67.
CrossRef - Feranec, J.; Jaffrain, G.; Soukup, T.; Hazeu, G. Determining changes and flows in European landscapes 1990–2000 using CORINE land cover data. Applied geography 2010 30(1), 19-35.
CrossRef - Castanho, R.A.; Naranjo Gómez, J.M.; Kurowska-Pysz, J. Assessing Land Use Changes in Polish Territories: Patterns, Directions and Socioeconomic Impacts on Territorial Management. Sustainability 2019, 11, 1354.
CrossRef - Suau-Sanchez P, Burghouwt G, Pallares-Barbera M. An appraisal of the CORINE land cover database in airport catchment area analysis using a GIS approach. Journal of Air Transport Management. 2013; 34: 12-16.
CrossRef - Jesús Martínez-Fernández, Paloma Ruiz-Benito, Andreu Bonet & Cristina Gómez. Methodological variations in the production of CORINE land cover and consequences for long-term land cover change studies. The case of Spain., International Journal of Remote Sensing, 40:23, 8914-8932. 2019.
CrossRef - S. Kleeschulte, G. Banko, G. Smith, S. Arnold, J. Scholz, B. Kosztra, G. Maucha. Technical specifications for implementation of a new land-monitoring concept based on EAGLE, D3: Draft design concept and CLC-Backbone, CLC-Core technical specifications, including requirements review. EEA/IDM/R0/17/003. Version 3.0. 2017
- Pinto-Correia, T.; Kristensen, L. Linking research to practice: The landscape as the basis for integrating social and ecological perspectives of the rural. Landsc. Urban Plan. 120, 248–256. 2013.
CrossRef - Xiaoping Liu, Jialv He, Yao Yao, Jinbao Zhang, Haolin Liang, Huan Wang & Ye Hong. Classifying urban land use by integrating remote sensing and social media data, International Journal of Geographical Information Science, 31:8, 1675-1696. 2017.
CrossRef - Konštantín Rosina, Filipe Batista e Silva, Pilar Vizcaino, Mario Marín Herrera, Sérgio Freire & Marcello Schiavina. Increasing the detail of European land use/cover data by combining heterogeneous data sets, International Journal of Digital Earth, 13:5, 602-626, 2018.
CrossRef - Jia, Y.; Ge, Y.; Ling, F.; Guo, X.; Wang, J.; Wang, L.; Chen, Y.; Li, X. Urban Land Use Mapping by Combining Remote Sensing Imagery and Mobile Phone Positioning Data. Remote Sens. 2018, 10, 446. https://doi.org/10.3390/rs10030446.
CrossRef - Rapinel, S. & Hubert-Moy, L. & Clement, B. (2015). Combined use of LiDAR data and multispectral earth observation imagery for wetland habitat mapping. International Journal of Applied Earth Observation and Geoinformation. 37. 56-64. 10.1016/j.jag.2014.09.002.
CrossRef - Yan, W. Y., Shaker, A. & El-Ashmawy, N. (2015). Urban land cover classification using airborne LiDAR data: A review. Remote Sensing of Environment. 158. 295-310. 10.1016/j.rse.2014.11.001.
CrossRef - A.M. Hersperger , E. Oliveira, S. Pagliarin , G. Palka, P.Verburg , J. Bolliger, S.Grădinaru 2018.Urban land-use change: The role of strategic spatial planning. Global Environmental Change. 51. 32–42. 2018.
CrossRef - Yimaz R., Monitoring land use/land cover changes using CORINE land cover data: A case study of Silivri coastal zone in Metropolitan Istanbul. Environmental Monitoring and Assessment 165(1-4):603-15 2009.
CrossRef - Schirmer J., Williams K., Dunn C., Socio-economic impacts of land use change in the Green Triangle and Central Victoria: Final summary of findings of the Land Use Change project. Sustainability and Resources. PNC067-0708 2009.
- OECD. The Governance of Land Use: Country Fact Sheet Turkey; OECD: Paris, France, 2017.
- Turkstat (Turkish Institute of Statistics). Turkish Official Statistics Report; TUIK: Ankara, Turkey
- Beatrice Ambo Fonge, Pascal Tabi Tabot, Mor-Achankap Bakia & Che Clovis Awah (2019) Patterns of land-use change and current vegetation status in peri-urban forest reserves: the case of the Barombi Mbo Forest Reserve, Cameroon, Geology, Ecology, and Landscapes, 3:2.
CrossRef - Fuchs, R.; Herold, M.; Verburg, P.H.; Clevers, J.G.; Eberle, J. Gross changes in reconstructions of historic land cover/use for Europe between 1990 and 2010. Glob. Chang. Biol. 2015, 21, 299–313.
CrossRef - Maucha G., Buttner Gy., Pataki R, Development of methodology to eliminate contradictions between CLC-Change 1990-2000 and CLC-Change 2000-2006. European Environment Agency. 2011
- European Environment Agency. Administrative Land Accounting Units. Available online: https://www.eea.europa.eu/data-and-maps/data/administrative-land-accounting-units (accessed on 4 November 2018).
- Rahman, D. Cahya, dkk. Uji Normalitas dengan Shapiro Wilk. Jakarta: Sekolah Tinggi Ilmu Statistik. 2014.
- Castanho, R.A., Behradfar, A., Vulevic, A., and Naranjo Gómez, J. (2020). Analyzing Transportation Sustainability in the Canary Islands Archipelago.Infrastructures 2020, 5, 58; doi:10.3390/infrastructures5070058.
CrossRef - Codosero Rodas, J., Castanho, R.A., Cabezas, J., and Naranjo Gómez, J. (2020). Sustainable valuation of land for development. Adding value with urban planning progress. A Spanish case study. Land Use Policy 92 (2020) 104456 https://doi.org/10.1016/j.landusepol.2019.104456.
CrossRef - Codosero Rodas, J., Cabezas, J., Naranjo Gómez, J., and Castanho, R.A., (2019). Risk Premium Assessment for the Sustainable Valuation of Urban Development Land: Evidence from Spain. Sustainability 2019, 11, 4191; pp-1-20 doi:10.3390/su11154191.
CrossRef - Loures, L. and Burley, J., (2012). Post-industrial land transformation – An approach to sociocultural aspects as catalysts for urban redevelopment. In: Burian, J. (Ed.) Advances in Spatial Planning, IntechOpen, pp. 223-246. (DOI: 10.5772/2123) (ISBN: 978-953-51-0377-6).
- Loures, L., (2011). Planning and Design in Post-industrial Land Transformation: East bank Arade river, Lagoa †case study, Faculdade de Ciências e Tecnologia, Universidade do Algarve, Faro, Portugal – Ph.D. Thesis.
- Loures L., Santos, R.and Panagopoulos T., (2007). Urban Parks and Sustainable Development – The Case Study of Portimão City, Portugal. In: Stamou, A., Panagopoulos, T., Stamatiou, E., Hatzopoulou, A. e Antunes, D. (Eds.) Energy, Environment, Ecosystems & Sustainable Development, Athens: WSEAS Press, pp.127-131. (ISBN: 978-960-8457-88-1).
- Naranjo Gómez, J., Castanho, R.A., Cabezas-Fernandez, J. and Loures, L. (2019). EvaluacioÌn de las AÌreas de Servicio de la Alta Velocidad Ferroviaria en la España Peninsular desde un Enfoque SIG Multi-meÌtodo. Assessing High Speed Railway Service Areas in Spain Mainland from a Multi-method GIS Approach. Revista de Estudios Andaluces (REA) ISSN: 2340-2776. REA NuÌm. 37 (2019). pp.1-19 184-208. http://dx.doi.org/10.12795/rea.2019.i37.
CrossRef - Naranjo Gómez, J.M., Loures, L., Castanho, R.A., Cabezas, J., Fernández-Pozo, L., Lousada, S., Escórcio, P. (2018). Assessing Land Use Changes in European Territories: A Retrospective Study from 1990 to 2012 [Working Title], IntechOpen, DOI: 10.5772/intechopen.80827.
CrossRef - Weber, J.-L. Implementation of land and ecosystem accounts at the European Environment Agency. Ecol. Econ. 2007, 61, 695-707.
CrossRef


