Monitoring and Assessing the Environmental Noise along a Busy Traffic Corridor of Ahmedabad City, India
Ketan Lakhtaria1,2
*
 , Sandip Trivedi3
and Anurag Kandya4
, Sandip Trivedi3
and Anurag Kandya4
http://dx.doi.org/10.12944/CWE.16.1.20
Copy the following to cite this article:
Lakhtaria K, Trivedi S, Kandya A. Monitoring and Assessing the Environmental Noise along a Busy Traffic Corridor of Ahmedabad City, India. Curr World Environ 2021;16(1). DOI:http://dx.doi.org/10.12944/CWE.16.1.20
Copy the following to cite this URL:
Lakhtaria K, Trivedi S, Kandya A. Monitoring and Assessing the Environmental Noise along a Busy Traffic Corridor of Ahmedabad City, India. Curr World Environ 2021;16(1). Available From : https://bit.ly/30PKc8M
Download article (pdf) Citation Manager Publish History

Introduction
Noise is one of the major urban pollutants affecting the majority of streets of modern cities1,2 and environmental noise pollution has been a growing worldwide problem over the past few years.3 Numerous studies have reported that the increase in the noise pollution is primarily because of the increase in the usage of the vehicles.4,5,6,7,8,9 Many studies have reported that there is evidence that exposure to traffic noise may be associated with wide range of psychological and physiological effects including annoyance, sleep disturbance, stress reaction, hypertension, cardiovascular event and diabetes.10,11,12,13,14,15 Accordingly to a published report by the World Health Organization (WHO), ‘Noise Pollution is the second largest environmental threat to health after air pollution’.16 Looking to the impact of noise pollution on the human health and the increasing trend of the noise pollution, numerous studies have been planned around the world which focuses on various aspects of noise such as noise characteristics: sampling strategy,17,18 sources,19,20 etc. As it is important to estimate the population exposed to the varying noise levels, many studies have been attempted using models like SoundPLAN.21,22,23 CadnaA,24,25 LimA,26 TRANEX,27 MITHRA-SIG,28 EMPARA.29 Many researchers undertook field studies across the world like Tonkin, France,30 Tehran city,31 Gwalior, India,32 Ahmedabad, India,33 Visakhapatnam, India,34 Rangareddy , India,35 Hyderabad, India,36 Kota, India,37 China38 for assessing the noise pollution and reported their findings using noise indicators like LAeq, Lmin, Lmax, L90, L50, L10, Traffic Noise Index (TNI), NC (Noise Climate) and many others.
With the background the traffic noise problem is significantly increasing especially in rapidly urbanizing and industrializing cities and it largely overlooked by the environmental authorities, the present study is planned for Ahmedabad city of India which is one of the fastest urbanizing cities of the country and has witnessed an exponential rise in both the human population and number of vehicles. The main goal of the study is to bring forth the spatial and quantitative aspects of noise pollution across the busy corridor of the city. The findings of the present study would of great value to the city’s civic authorities to understand the magnitude and dynamics of the problem and initiate suitable measures which would reduce the health risk of the people.
Study Area
The present study is done over a busy traffic corridor of Ahmedabad city of India. Ahmedabad city is the 7th largest metropolis of India covering a geographical area of approx 464 km2 having a road network of around 2600 km. The population which was around 5.58 million in the year 2011 has risen to around 8 million in the year 2020.39 The growth of the number of vehicles was phenomenal in the last 2 decades and the city has around 49 lakh registered vehicles as on 31st March, 202040 and more than 70% are two-wheelers (Motor cycles).
The traffic corridor under investigation contains two routes which are (i) Route A – Ashram Road and (ii) Route R – 132 Ft Ring Road. It spans over 22.25 km and passes through different areas like educational, residential and commercial of the city. 24 sampling locations were identified over this corridor where the noise measurements were done. Fig 1 displays the respective traffic corridor along with the sampling locations while Table 1 contains the details of the sampling location.
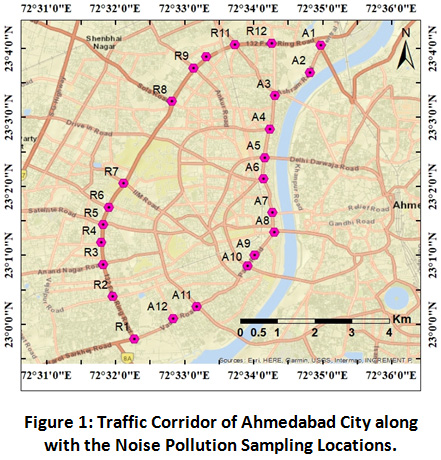 |
Figure 1: Traffic Corridor of Ahmedabad City along with the Noise Pollution Sampling Locations. Click here to view Figure |
Table 1: Details of the Noise Pollution Sampling Locations on the Traffic Corridor.
|
Route A - Ashram Road |
Route R - 132 feet Ring Road |
||
|
No. |
Name of Station |
No. |
Name of Station |
|
A1 |
RTO |
R1 |
Vejalpur |
|
A2 |
Sabaramati Ashram |
R2 |
Jivraj Bridge |
|
A3 |
Vadaj |
R3 |
Parekh Hospital |
|
A4 |
Usmanpura |
R4 |
Punitnagar Rd |
|
A5 |
Income-Tax |
R5 |
Shivranjani |
|
A6 |
Someshwar Temple |
R6 |
Keshavbaug |
|
A7 |
Nehru Bridge |
R7 |
IIM |
|
A8 |
Elliz Bridge |
R8 |
Naranpura |
|
A9 |
Bhikhu Chamber |
R9 |
Ankur |
|
A10 |
Paldi |
R10 |
Pragatinagar |
|
A11 |
120 Ft Ring Rd |
R11 |
Akhabarnagar |
|
A12 |
Vasna |
R12 |
National Handloom |
Methodology
For the present study a comprehensive two weeks field survey was conducted during 10 - 23 May, 2018. The noise sampling was carried out on the 24 locations (as shown in Fig 1) during 0900 – 1300 hrs. Digital sound level meter (Instrument make: METRAVI, Model No: SL – 4015 having frequency range of 31.5 HZ to 8KHZ and IEC 61672- Class 2 standards) was used on slow mode. The device was mounted on a stand with a height of 1.5 m above the ground at a distance of 3.0 meter from the edge of the road and perpendicular to the road centreline. The sound pressure levels (SPL) were recorded in dB (A) at every second at each station. A database of the observed SPL was made subsequently noise indicators like mean A- weighted sound pressure level (LAeq), minimum noise level (Lmin), maximum noise level (Lmax), sound level exceeding for 90% of the sampling time (L90) often related to the background noise level, sound level exceeding for 50% of the sampling time (L50) which is statistically the mid-point of the noise readings, sound level exceeding for 10% of the sampling time (L10) which is probably due to intermittent events, Noise Pollution Level (LNP) calculated as LNP = LAeq + (L10 - L90 ), Traffic Noise Index (TNI) computed as TNI = 4 × (L10 – L90) + (L90 – 30), Noise Climate (NC) computed as NC = L10 – L90 and Level roughness (σδL) computed as δL(t) = LAeq1s (t + 1) - LAeq1s(t) for each location.
As there were 24 sampling locations, the entire traffic corridor was divided into 24 segments such that each sampling location is at the centre of the respective segment and subsequently it was assumed that the sampling location would represent the corresponding traffic corridor segment.
Results and Discussions
Fig 2, 3 and 4 show the variation of the various noise indicators (parameters and indices) along the traffic corridor under study. Fig 2(a-c) shows the variation of LAeq, Lmin and Lmax; Fig 3(a-c) shows the variation of L90, L50 and L10 while Fig 4(a-d) displays the variation of various noise indices like LNP, TNI, NC, σδL along the respective traffic corridor. Table 2 contains the range (min-max) of the various noise pollution parameters observed along the traffic corridor and Table 3 contains the details of the spatial extent (%) of the traffic corridor for the different ranges of the various noise pollution parameters.
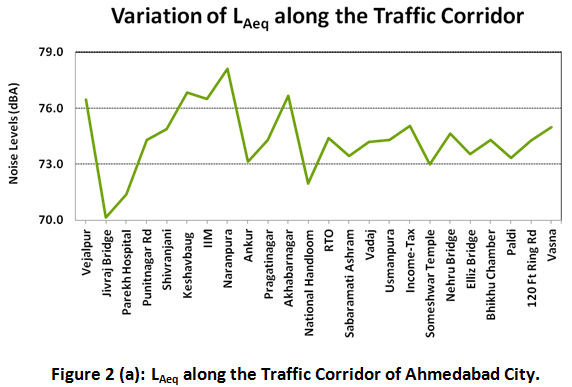 |
Figure 2 (a): LAeq along the Traffic Corridor of Ahmedabad City. Click here to view Figure |
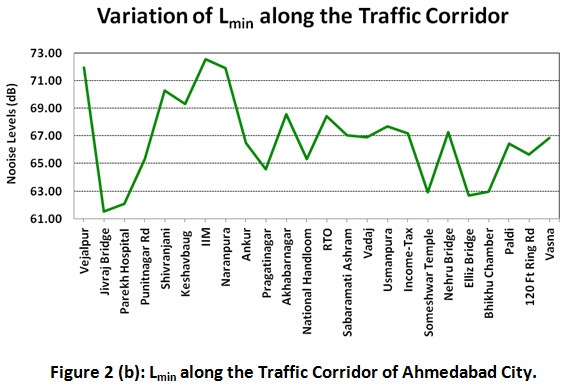 |
Figure 2 (b): Lmin along the Traffic Corridor of Ahmedabad City. Click here to view Figure |
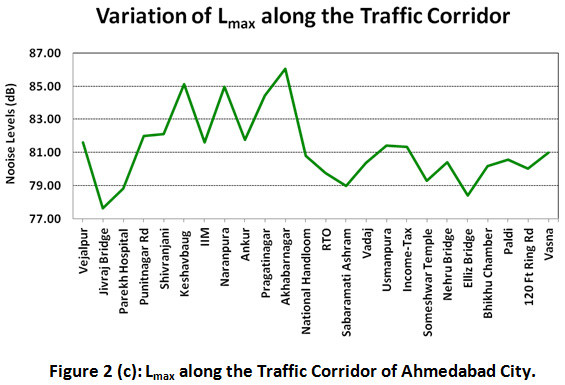 |
Figure 2 (c): Lmax along the Traffic Corridor of Ahmedabad City. Click here to view Figure |
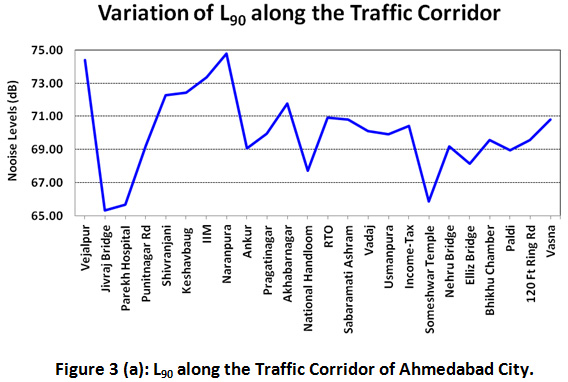 |
Figure 3 (a): L90 along the Traffic Corridor of Ahmedabad City. Click here to view Figure |
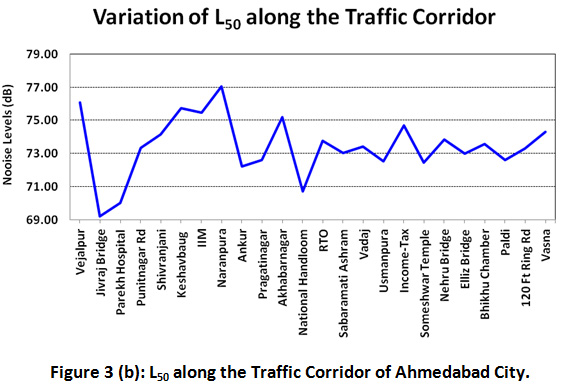 |
Figure 3 (b): L50 along the Traffic Corridor of Ahmedabad City. Click here to view Figure |
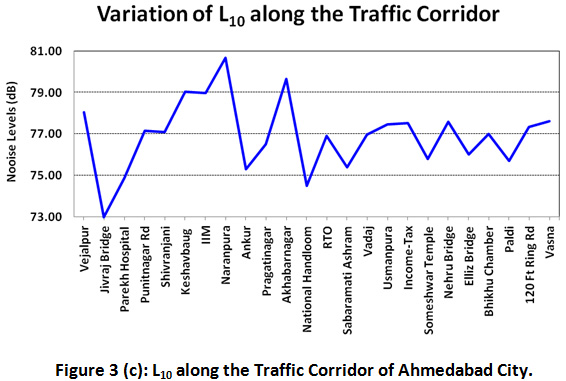 |
Figure 3 (c): L10 along the Traffic Corridor of Ahmedabad City. Click here to view Figure |
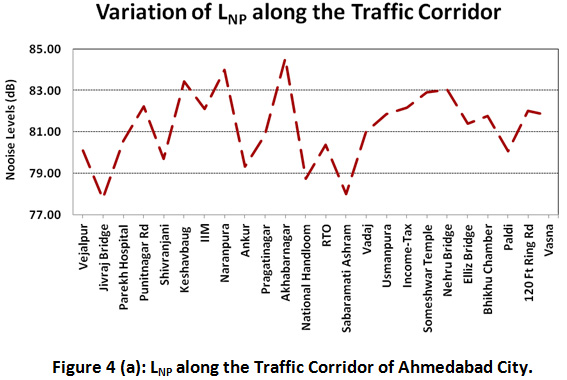 |
Figure 4 (a): LNP along the Traffic Corridor of Ahmedabad City. Click here to view Figure |
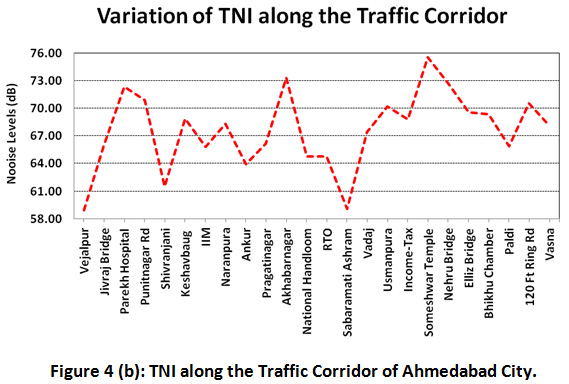 |
Figure 4 (b): TNI along the Traffic Corridor of Ahmedabad City. Click here to view Figure |
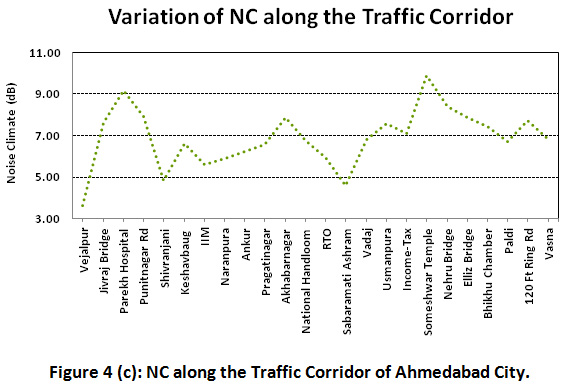 |
Figure 4 (c): NC along the Traffic Corridor of Ahmedabad City. Click here to view Figure |
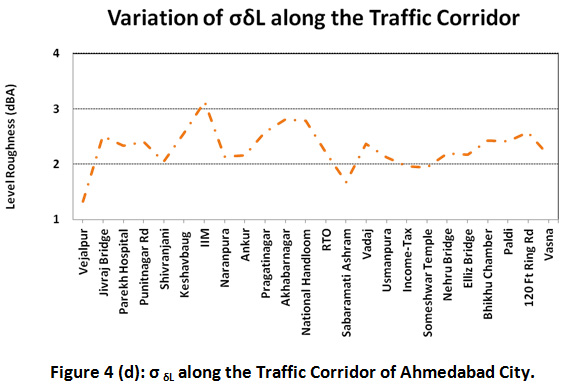 |
Figure 4 (d): σ δL along the Traffic Corridor of Ahmedabad City. Click here to view Figure |
Table 2: Range of the Various Noise Pollution Parameters Across the Traffic Corridor.
|
No. |
Noise Pollution Parameter |
Range of the Noise Pollution Parameter |
|||
|
Minimum |
Maximum |
||||
|
dB(A) |
Observed at Sampling Location |
dB(A) |
Observed at Sampling Location |
||
|
|
LAeq |
70.2 |
Jivraj Bridge |
78.1 |
Naranpura |
|
|
Lmin |
61.5 |
Jivraj Bridge |
72.6 |
IIM |
|
|
Lmax |
77.6 |
Jivraj Bridge |
86.0 |
Akhabarnagar |
|
|
L90 |
65.3 |
Jivraj Bridge |
74.8 |
Naranpura |
|
|
L50 |
69.2 |
Jivraj Bridge |
77.1 |
Naranpura |
|
|
L10 |
73.0 |
Jivraj Bridge |
80.7 |
Naranpura |
|
|
LNP |
77.8 |
Jivraj Bridge |
84.6 |
Akhabarnagar |
|
|
TNI |
59.0 |
Vejalpur |
75.6 |
Someshwar Temple |
|
|
NC |
3.6 |
Vejalpur |
9.9 |
Someshwar Temple |
|
|
σδL |
1.3 |
Vejalpur |
3.1 |
IIM |
Table 3: Spatial Extent (%) of Various Noise Pollution Parameters Across the Traffic Corridor.
|
No. |
Noise Pollution Parameter (dB) |
Range of the Noise Pollution Parameter (db) |
Spatial Extent (%) of the traffic corridor |
|
|
LAeq |
70 – 73 |
13.6 |
|
73 – 76 |
58.9 |
||
|
76 – 78 |
27.5 |
||
|
|
Lmin |
61 – 65 |
20.4 |
|
65 – 69 |
53.6 |
||
|
69 – 73 |
26.0 |
||
|
|
Lmax |
77 – 80 |
24.3 |
|
80 – 83 |
58.1 |
||
|
83 – 86 |
17.6 |
||
|
|
L90 |
65 – 68 |
17.1 |
|
68 – 71 |
53.0 |
||
|
71 – 75 |
29.9 |
||
|
|
L50 |
69 – 72 |
13.6 |
|
72 – 75 |
58.9 |
||
|
75 – 77 |
27.5 |
||
|
|
L10 |
73 – 76 |
29.8 |
|
76 – 79 |
48.1 |
||
|
79 – 81 |
22.1 |
||
|
|
LNP |
77 – 80 |
20.3 |
|
80 – 83 |
61.5 |
||
|
83 – 85 |
18.2 |
||
|
|
TNI |
59 – 63 |
12.1 |
|
63 – 67 |
33.4 |
||
|
67 – 71 |
40.2 |
||
|
71 – 76 |
14.3 |
||
|
|
NC |
3 – 5 |
12.1 |
|
5 – 7 |
47.8 |
||
|
7 – 10 |
40.1 |
||
|
|
σδL |
1 – 2 |
13.3 |
|
2 – 3 |
86.7 |
- LAeq : From the Fig 3(a) and Table 2 & 3, it can be seen that the average noise pollution level (LAeq) of the entire corridor exceeds the prescribed guidelines (The Noise Pollution (Regulation and Control) Rules, 2000) which limits the daytime noise pollution level at 55 dB(A) for the residential areas and 65 dB(A) for the commercial areas. The LAeq ranges between 70.2 – 78.1 dB(A) and 58.9% of the corridor has the sound levels between 73 – 76 dB(A).
- Lmin : From the Fig 3(b) and Table 2 & 3, it can be seen that the minimum noise level (Lmin) of the entire corridor ranged between 61.5 – 72.6 dB(A) and 53.6% of the corridor had the Lmin between 65 - 69 dB(A).
- Lmax : From the Fig 3(c) and Table 2 & 3, it can be seen that the maximum noise level (Lmax) of the entire corridor ranged between 77.6 - 86.0 dB(A) and 58.1% of the corridor had the Lmax between 80-83 dB(A).
- L90 : From the Fig 4(a) and Table 2 & 3, it can be seen that the background noise (L90) of the entire corridor ranged between ranged between 65 – 75 dB(A) and 53.0% of the corridor had the L90 between 68 - 71 dB(A).
- L50: From the Fig 4(b) and Table 2 & 3, it can be seen that the average noise level (L50) of the entire corridor ranged between ranged between 69.2 – 77.1 dB(A) and 58.9% of the corridor had the L50 between 72 - 75 dB(A).
- L10: From the Fig 4(c) and Table 2 & 3, it can be seen that the extreme noise (L10) of the entire corridor ranged between ranged between 73.0 – 80.7 dB(A) and 48.1% of the corridor had the L10 between 76 - 79 dB(A).
- LNP: From the Fig 5(a) and Table 2 & 3, it can be seen that the Noise Pollution Level (LNP) of the entire corridor ranged between 77.8 – 84.6 dB(A) and 61.5% of the corridor had the LNP ranged between 80 – 83 dB(A).
- TNI: From the Fig 5(b) and Table 2 & 3, it can be seen that the Traffic Noise Index (TNI) of the entire corridor ranged between 59.0 – 75.6 dB(A) and 40.2% of the corridor had the TNI ranged between 67 - 71 dB(A).
- NC: From the Fig 5(c) and Table 2 & 3, it can be seen that the Noise Climate (NC) of the entire corridor ranged between 3.6 – 9.9 dB(A) and 47.8% of the corridor had the NC ranged between 5 - 7 dB(A).
- σδL: From the Fig 5(d) and Table 2 & 3, it can be seen that Level Roughness (σδL) of the entire corridor ranged between 1.3 – 3.1 and 86.7% of the corridor had the σδL ranged between 2 – 3 dB(A).
- Ranking the various segments of the traffic corridor on the noise indicators like LAeq, Lmin, Lmax, L90, L50 and L10 and further clubbing the performance reveals that segment represented by station R2 (Jivraj Bridge) had the relative lowest noise pollution while the segment represented by station R8 (Naranpura) had the relative highest noise pollution. The corridor segment represented by stations R5-R6-R7-R8 (Shivranjani - Keshavbaug - IIM - Naranpura) are in the bottom 6 stations of the corridor having relatively high noise pollution while stations R11 (Akhbarnagar) and R1 (Vejalpur) are the other 2 stations.
- Segment of the traffic corridor represented by stations A6 (Someshwar temple) and had the relatively highest Noise Climate value of 9.92 dB(A) while that represented by R1 (Vejalpur) had the relatively lowest value 3.64 dB(A).
- Segments of the traffic corridors represented by station R11 (Akhbarnagar) had the relatively highest Noise Pollution Level (LNP) of 85.59 dB(A) followed by R8 (Naranpura) having 84.58 db(A) while that represented by station A2 (Sabarmati Ashram) had the relatively lowest LNP of 78.37 dB(A) followed by R2 (Jivraj Bridge) having it as 78.78 dB(A).
- From the present study, a brief idea can be drawn regarding the magnitude of the vehicular traffic led noise pollution problem in Ahmedabad city. Noting the fact that Ahmedabad city has 49 lakhs vehicles registered as on 31st March, 2020 (and is growing at the rate of 5-6% per annum), the per vehicle road length availability, which should have been ideally 2 m, is currently 0.54 m and is continuously dwindling due to stagnancy in the road network to 2600 km in the year 2017,41 there is an urgent need for undertaking the task of city level Noise Pollution Mapping and subsequently initiating site specific noise pollution mitigation measures. The success of the mitigation measures would not only help to improve the health and productivity of the residents but would help the other urbanizing town and cities to take early preventive measures.
Conclusion
The salient conclusions of the ‘noise pollution assessment’ study performed over a busy traffic corridor of Ahmedabad city, one of the fastest developing cities of India, are as follows:
- The average noise level (LAeq) of the entire corridor always exceeded the prescribed guidelines (The Noise Pollution (Regulation and Control) Rules, 2000) which is indeed an alarming situation. The Noise Pollution (Regulation and Control) Rules, 2000) limits the daytime noise pollution level at 55 dB(A) for the residential areas and 65 dB(A) for the commercial areas.
- For the major portion of the traffic corridor (79.6%) , even the minimum noise level (Lmin) was above the permissible average noise level which increases the level of concern.
- The highest Lmax observed was 86.0 dB(A).
- Segments of the traffic corridors represented by stations R11 (Akhbarnagar) and R8 (Naranpura) represent the noisiest locations.
- The traffic corridor segment represented by stations R5-R6-R7-R8 (Shivranjani - Keshavbaug - IIM - Naranpura) had the relatively high values for noise indicators like LAeq, Lmin, Lmax, L90, L50 and L10
- Looking to the implications the high noise levels have on the human health and in the background that the urban population would be increasing significantly, it is very important to focus on (i) improving the road infrastructure in terms of quality of roads and parking places (ii) regulating the traffic movement by synchronizing the traffic signals (iii) implementing the various aspects of Intelligent Transportation System (iv) popularizing the usage of public transportation vehicles (v) planning simple noise sinks like trees and plants (vi) strict implementation of rules pertaining to ‘no parking’ and ‘no honking’.
- The findings of the present study would be of great help to civic administration of Ahmedabad city to understand the magnitude of the noise pollution problem which would help them to initiate mitigative strategies to abate the noise pollution problem of this busy traffic corridor of the city.
Future Scope of the Study
For the understanding the scenario of noise, efforts should be put for preparing a Noise Pollution Map of the city through field survey and through modelling. And later the effectiveness of the various mitigating strategies should be evaluated through the modelling approach. An interface of the noise pollution map with the population density map should also be attempted which would give a concrete idea regarding the number of people at different level of noise pollution led health risks. The synthesis of the above approaches would help to effectively plan the Noise Pollution Mitigative framework and the execution of that would improve the quality of life of a common man.
Acknowledgements
The authors duly acknowledge the support extended by Indus University, Ahmedabad, Gujarat Power and Engineering Research Institute (GPERI), Mehsana and Pandit Deendayal Petroleum University, Gandhinagar for extending support for carrying out this study. They also acknowledge the anonymous reviewers whose inputs greatly improved the quality of the manuscript.
Conflicts of Interest
On behalf of all authors, the corresponding author states that there is no conflict of interest.
References
- Gozalo, G. R., Morillas, J. M. B., Escobar, V. G., 2014. Analyzing nocturnal noise stratification. Science of the Total Environment, 479–480, pp. 39–47.
CrossRef - WHO (World Health Organization), 1999. Guidelines for community noise, Geneva
- Bastián-Monarca, N. A., Suárez, E., Arenas, J. P., 2016. Assessment of methods for simplified traffic noise mapping of small cities: Casework of the city of Valdivia, Chile. Science of the Total Environment, 550, pp. 439–448.
CrossRef - Su, J. G., Brauer, M., Buzzelli, M. 2008. Estimating urban morphometry at the neighbourhood scale for improvement in modelling long-term average air pollution concentrations. Atmospheric Environment, 42, 7884–93.
CrossRef - Chen, H., Namdeo, A., Bell, M. C., 2008. Classification of road traffic and roadside pollution concentrations for assessment of personal exposure. Environmental Modelling and Software 23, pp. 282–7.
CrossRef - Can, A., Rademaker, M., Van, R. T., Mishra, V., Van P. M., Touhafi, A., Theunis, J., Botteldooren, D., 2011. Correlation analysis of noise and ultrafine particle counts in a street Canyon. Science of Total Environment, 409, pp. 564–72.
CrossRef - Foraster, M., Deltell, A., Basagaña, X., Medina-Ramón, M., Aguilera, I., Bouso, L., Grau, M., Künzli, N., 2011. Local determinants of road traffic noise levels versus determinants of air pollution levels in a Mediterranean city. Environmental Research, 111, pp. 177–83.
CrossRef - Halonen, J. L., Vahtera, J., Stansfeld, S., Yli-Toumi, T., Salo, P., Pentty, J., 2012. Associations between night time traffic noise and sleep: the Finnish public sector study. Environment Health Perspective. 120, pp. 1391–1396.
CrossRef - Vogiatzis, K., 2013. Environmental noise and vibration monitoring and assessment of major road transportation networks: the case of Elefsina (Athens) — Korinthos motorway (2008–2011). International Journal of Sustainable Development Plan, 8, pp. 173–185.
CrossRef - Niemann, H., Bonnefoy, X., Braubach, M., Hecht, K., Maschke, C., Rodrigues, C., Robbel, N., 2006. Noise-induced annoyance and morbidity results from the pan-European LARES study. Noise Health, 8, pp. 63-79.
CrossRef - Babisch, W., 2006. Transportation noise and cardiovascular risk: updated review and synthesis of epidemiological studies indicate that the evidence has increased. Noise Health; 8, pp. 1–29.
CrossRef - Haralabidis, A. S, Dimakopoulou, K., Vigna-Taglianti, F., Giampaolo, M., Borgini, A., Dudley, M. L., Pershagen, G., Bluhm, G., Houthuijs, D., Babisch, W., Velonakis, M., Katsouyanni, K., Jarup, L., HYENA Consortium, 2008. Acute effects of night-time noise exposure on blood pressure in populations living near airports. European Heart Journal, 29, pp. 658–64.
CrossRef - Paunovic, K., Jakovljevic, B., Belojevic, G., 2009. Predictors of noise annoyance in noisy and quiet urban streets. Science of Total Environment, 407, pp. 3707–11.
CrossRef - Sorensen, M., Andersen, Z., Nordsborg, R. B., Becker, T., Tjonneland, A., Overvad, K., 2013. Long-term exposure to road traffic noise and incident diabetes: a cohort study. Environ Health Perspective 121, pp. 217–22.
CrossRef - Zuo, F., Li, Y., Johnson, S., Johnson, J., Varughese, S., Copes, R., Liuc, F. Wu, H. J., Hou, R., Chen, H., 2014. Temporal and spatial variability of traffic-related noise in the City of Toronto, Canada, Science of Total Environment, 472, pp. 1100–1107.
CrossRef - World Health Organization WHO, 2011. Burden of Disease from Environmental Noise Quantification of Healthy Life Years Lost in Europe. WHO Regional Office for Europe and JCR European Commission.
- Barrigón M., J. M, Gómez E. V, Méndez S. J. A., Vílchez-Gómez, R., Vaquero, J. M., 2005. Effect of leisure activity related noise in residential zones. Building Acoustics. 4, pp. 265–76.
CrossRef - Romeu, J., Genescà, T., Pàmies, T., Jiménez, S. 2011. Street categorization for the estimation of day levels using short-term measurements, Applied Acoustics, 72, pp. 569–77.
CrossRef - Yang, D., Wang, Z., Li, B., Lou, Y., Lian, X., 2011. Quantitative measurement of pass-by noise radiated by vehicles running at high speeds, Journal of Sound Vibrations, 330, pp. 1352–64.
CrossRef - Zeng, X., Zhan, Y., 2005. Development of a noise sources classification system based on new method for feature selection, Applied Acoustics, 65, pp. 1196–205.
CrossRef - Çolakkadıoglu, D., Yücel, M., 2017. Modeling of Tarsus-Adana-Gaziantep highway-induced noise pollution within the scope of Adana city and estimated the affected population, Applied Acoustics, 115, pp. 158–165.
CrossRef - Roswall, N., Raaschou-Nielsen, O., Ketzel, M., Gammelmark, A., Overvad, K., Olsen, A., Sørensen, M., 2017. Long-term residential road traffic noise and NO2 exposure in relation to risk of incident myocardial infarction–a Danish cohort study. Environmental Research, 156, pp. 80–86.
CrossRef - Bodin, T., Björk, J., Mattisson, K., Bottai, M., Rittner, R., Gustavsson, P., Albin, M., 2016. Road traffic noise, air pollution and myocardial infarction: a prospective cohort study, International Archives of Occupational and Environmental Health, 89 (5), pp. 793–802.
CrossRef - Suárez, E., Barros, J. L., 2014. Traffic noise mapping of the city of Santiago de Chile, Science of the Total Environment, 466–467, pp. 539–546.
CrossRef - De Roos, A.J., Koehoorn, M., Tamburic, L., Davies, H.W., Brauer, M., 2014. Proximity to traffic, ambient air pollution, and community noise in relation to incident rheumatoid arthritis, Environmental Health Perspective, 120 (1).
CrossRef - Dzhambov, A.M., Dimitrova, D.D., 2016. Exposures to road traffic, noise, and air pollution as risk factors for type 2 diabetes: a feasibility study in Bulgaria. Noise Health, 18 (82), pp. 33.
CrossRef - Halonen, J.I., Hansell, A.L., Gulliver, J., Morley, D., Blangiardo, M., Fecht, D., Kelly, F.J., 2015. Road traffic noise is associated with increased cardiovascular morbidity and mortality and all-cause mortality in London, European Heart Journal, 36 (39), pp. 2653–2661.
CrossRef - Tenailleau, Q. M., Bernard, N., Pujol, S., Parmentier, A.-L., Boilleaut, M., Houot, H., Mauny, F., 2016. Do outdoor environmental noise and atmospheric NO2 levels spatially overlap in urban areas? Environmental Pollution, 214, pp. 767–775.
CrossRef - Bilenko, N., Rossem, L., Brunekreef, B., Beelen, R., Eeftens, M., Hoek, G., Koppelman, G.H., 2015. Traffic-related air pollution and noise and children's blood pressure: results from the PIAMA birth cohort study. European Journal of Preventive Cardiology, 22 (1), pp. 4–12.
CrossRef - Jagla, J., Maillard, J., Defrance, J., 2014. Estimation of dynamic indicators based on auralization of urban traffic noise, Euronoise, 12
- Monazzam, M. R., Karimi, E., Abbaspour, M., Nassiri, P., Taghavi, L. 2015. Spatial traffic noise pollution assessment – A case study. International Journal of Occupational Medicine and Environmental Health, 28(3), pp. 625-634.
CrossRef - Marathe, P. D., 2012. Traffic noise pollution, IJED, 9(1), pp. 63–68
- Lakhtaria, K., Trivedi, S., Kandya, A. 2017. Spatio-Temporal Assessment of Noise Pollution in Ahmedabad City of Gujarat through Measurements and Mapping, Proceedeings of The ASCE India Conference 2017, Urbanization Challenges in Emerging Economies, pp. 122–129.
CrossRef - Rao, P Ramalingeswara, and M G Seshagiri Rao. 1992. “Community Reaction to Road Traffic Noise.” Applied Acoustics 37: 51–64.
CrossRef - Poodari, Saritha, Ch Anand, and V Himabindu. 2016. “Traffic Noise Level Assessment in Ranga Reddy District, India.” International Journal of Applied Physics 6(1): 2249–3174.
- Kumar, K V Dharmendra, and N Srinivas. 2014. “Study of Noise Levels at Traffic Density Areas In.” International Journal of Engineering Research & Technology 3(11): 783–86.
- Singh, Bane, and Mahendra Pratap Choudhary. 2017. “Evaluation of Noise Levels and Ascertaining Noise Indices in an Urbanizing City of Kota, Rajasthan, India.” Nature Environment and Pollution Technology 16(3): 935–38.
- Ma, Guoxia, Yujun Tian, Tianzhen Ju, and Zhengwu Ren. 2006. “Assessment of Traffic Noise Pollution from 1989 to 2003 in Lanzhou City.” Environmental Monitoring and Assessment 123(1–3): 413–30.
CrossRef - www.worldpopulationreview.com
- www.statista.com https://www.statista.com/statistics/665754/total-number-of-vehicles-in-ahmedabad-india/
- TOI, 2020 https://timesofindia.indiatimes.com/city/ahmedabad/city-has-just-0-54m-of-road-per-vehicle/articleshow/74250328.cms.


