Noise Descriptors For Kota Metropolis, Rajasthan (India)
Kuldeep
 , Sohil Sisodiya
*
and Dr. Anil K. Mathur
, Sohil Sisodiya
*
and Dr. Anil K. Mathur
http://dx.doi.org/10.12944/CWE.16.1.18
The most common environmental concern in metropolitan cities worldwide is noise pollution. Kota metropolis (India) is also suffering from the problem of the increased noise level in the urban environment. Kota metropolis has been selected for the assessment of noise pollution. The main reasons behind the increasing level of noise in the city are increased population, rapid urbanization and industrialization, increased transportation facilities, urban development, construction and demolition works etc. The noise levels were recorded for day-time (6 am to 10 pm) as per Indian standard time for 96 days. Sixteen sampling points are made within the city depending upon the category of area/zone such as industrial, residential, silence and commercial. Six days were prescribed for each sampling location for noise level measurement. Noise descriptors such as Lmax, Lmin, L10, L50, L90, NC (noise climate), Lnp (noise pollution level), Leq (equivalent noise level), and NEI (noise exposure index) were computed with the observed data. Noise descriptors are very useful to indicate the physiological and psychological effects of noise pollution associated with noise levels. It makes regulating agency to take necessary actions in high noise areas for noise vulnerable groups such as Childs, old persons etc. Noise levels were recorded with the digital sound level meter " HTC SL-1350". Obtained equivalent noise levels were in between 65 dB(A) to 85 dB(A). The results were then compared with the WHO standards of community noise levels, and Indian noise pollution standards. It is noticed that the noise levels in all monitoring stations were well above the limits of the standards prescribed by the WHO and CPCB. Small variations in noise levels were observed for all sampling locations i.e. noise levels were almost similar at sampling locations. Noise levels were distinct in magnitude for morning and evenings hours. Noise Exposure Index (NEI) was greater than 1 which shows significant high noise levels in all the sampling locations. Kota metropolis desperately needs new strategies to reduces the high noise level in the city. Regulating agencies should take necessary action before things get out of control. Some immediate actions are suggested in the study.
Copy the following to cite this article:
Kuldeep K, Sisodiya S, Mathur A. K. Noise Descriptors For Kota Metropolis, Rajasthan (India). Curr World Environ 2021;16(1). DOI:http://dx.doi.org/10.12944/CWE.16.1.18
Copy the following to cite this URL:
Kuldeep K, Sisodiya S, Mathur A. K. Noise Descriptors For Kota Metropolis, Rajasthan (India). Curr World Environ 2021;16(1). Available From : https://bit.ly/2LJIOkg
Download article (pdf) Citation Manager Publish History

Introduction
'Nausea' is a Latin word which implies 'unwanted level of sound ' or 'loud, distracting or unpredictable sound.' 1,2A more accurate definition would be "noise is an audible and high range of sound causing disturbance, disability or harm to health."3–6 Since it cannot be seen, smelled, or tasted, it is an underestimated environmental problem. Noise needs to be identified as a considerable threat to human well-being.7–9
Most Indian cities are increasingly urbanizing and industrializing. Most people are expected to live in the cities within the next two decades resulting in a tremendous increase in the number of motor vehicles continuously.10 Due to this surge in the motor vehicles population, vehicular noise has become one of the significant source of environmental noise pollution in urban environment, which affects the quality of the urban living environment.11–14
It is a sluggish and subtle killer, but there has been no effort to improve the same.6 It has become a threat to the quality of life, along with other forms of pollution. It is certified that even relatively low noise levels have a detrimental impact on human wellbeing. annoyance and aggression, high stress levels, hypertension, hearing loss, tinnitus, hamper children's cognitive development, sleep disturbances, and other effects.6,9,11,15–18 Furthermore, fatigue and hypertension are the leading causes of health problems, while tinnitus can contribute to forgetfulness, extreme distress, and often panic attacks. High sound levels may lead to cardiovascular consequences.19,20
The levels of noise in Kota City are increasing gradually due to increased number of vehicles used for transportation purpose. A vast number of studies regarding to noise pollution in Indian cities have been published, but there is not enough data available for Kota City. This research study on Kota city shows the area or zone-wise assessment and analysis of high noise levels in busiest places concerning equivalence sound levels.
Materials and Methods
Noise levels were recorded at sixteen (16) sampling places for four diverse groups of area/zone in the Kota metropolis, viz. industrial, residential, commercial and silence zone. For each group of sampling locations, four important and busiest places were selected. As per Indian guidelines launched by CPCB, Kota metropolis is classified for sampling places are following:
|
A. Commercial Area: |
B. Residential Area: |
||||||
|
Code |
Location |
Long. |
Lat. |
Code |
Location |
Long. |
Lat. |
|
S-1 |
Aerodrome Circle |
75.85 |
25.16 |
S-5 |
Dadwara |
75.87 |
25.22 |
|
S-2 |
Kotri Circle |
75.85 |
25.17 |
S-6 |
Keshavpura |
75.83 |
25.14 |
|
S-3 |
Sabjimandi |
75.84 |
25.18 |
S-7 |
Talwandi |
75.84 |
25.14 |
|
S-4 |
Gumanpura |
75.84 |
25.17 |
S-8 |
Jawahar Nagar |
75.83 |
25.15 |
|
C. Silence Zone: |
D. Industrial Area: |
||||||
|
Code |
Location |
Long. |
Lat. |
Code |
Location |
Long. |
Lat. |
|
S-9 |
RICCO Institutional Area, Ranpur |
75.84 |
25.06 |
S-13 |
KSTPS (Kota Super Thermal Power Station) |
75.81 |
25.17 |
|
S-10 |
MBS Hospital, Nayapura |
75.85 |
25.19 |
S-14 |
RICCO Industrial Area, Ranpur |
75.83 |
25.05 |
|
S-11 |
Antaghar Circle |
75.85 |
25.19 |
S-15 |
Chambal Industrial Area |
75.88 |
25.14 |
|
S-12 |
Instrumentation Limited Circle |
75.85 |
25.14 |
S-16 |
Indraprastha Industrial Area |
75.86 |
25.12 |
These sampling locations are shown in the figure 1 and research methodology used for this research work is presented in figure 2. The sound levels are measured by Digital Noise Level Meter “HTC SL-1350”.21 The Digital Sound Level Meter was placed 1.5 m above the road and, if there are reflecting surface, Then 3.0 to 3.5 m away from it. A 96 days observation period was decided to study noise levels in the 16 sampling locations of Kota city. Noise measurements were conducted continuously for six days from Monday to Saturday at each sampling location with 16 hours of continuous monitoring from 6:00 am to 10:00 pm per day.
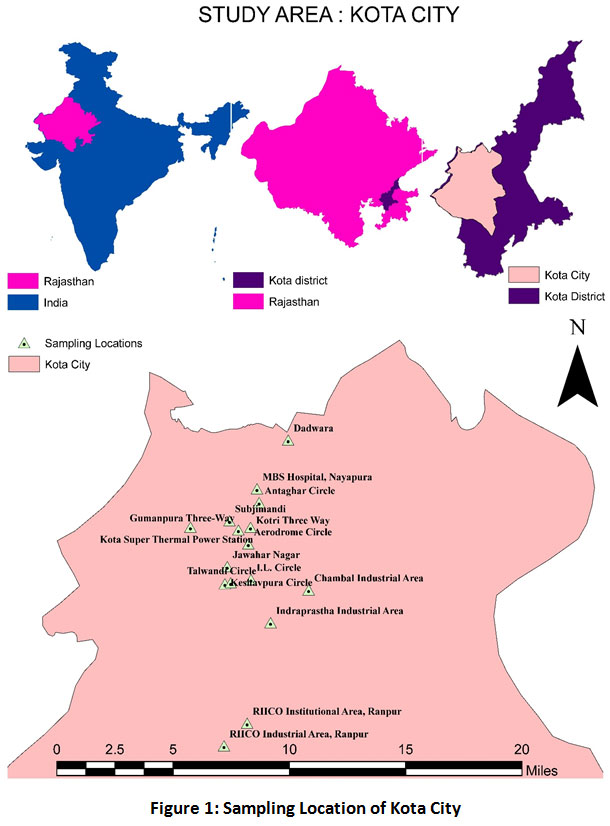 |
Figure 1: Sampling Location of Kota City Click here to view Figure |
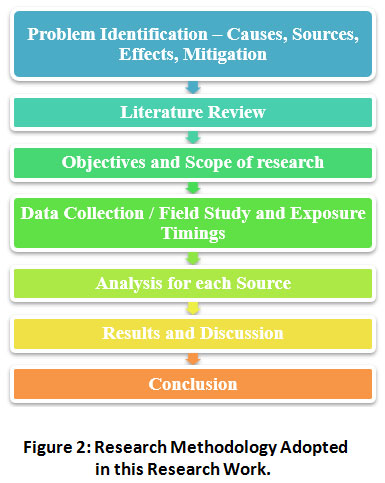 |
Figure 2: Research Methodology Adopted in this Research Work. Click here to view Figure |
Noise Pollution Standards
In India, under the Environment Protection Act, 1986, the Noise Pollution (Regulation and Control) Rules 2000 were framed. These are a set of guidelines for noise control and regulation. Table 1 shows the acceptable ambient noise levels for the different areas / zones as per Indian standards while WHO standards for community noise in specific environment is presented in Table 2.
Table 1: The Central Pollution Control Board Guidelines for Noise Pollution in India are as follow:6,22,23
|
Sr. No. |
Zonal Category |
Equivalent Noise Level Limits (Leq), dB(A) |
|
|
Night Time |
Day Time |
||
|
1. |
Industrial Area |
70 |
75 |
|
2. |
Commercial Area |
55 |
65 |
|
3. |
Residential Area |
45 |
55 |
|
4. |
Silence Zone |
40 |
50 |
Table 2: The World Health Organization (WHO) Standards for Community Noise in Specific Environment are as follow:24
|
Code |
Specific Environment |
Equivalent Noise Level Limits (Leq), dB(A) |
|
|
Time Base (Hours) |
Day Time |
||
|
1. |
Outdoor Living area |
16 |
55 |
|
2. |
School, Playground Outdoor |
During Play |
55 |
|
3. |
Commercial, Industrial, Shopping and Traffic Areas |
24 |
70 |
Noise Pollution Descriptors
To determine noise pollution levels in the city, different noise descriptors were estimated with the help of Gaussian percentile. Noise descriptors such as L10, L50, L90, Lmax, and Lmin, were computed by the recorded levels of noise and these variables are utilized for the analysis of NC (Noise Climate), Leq (Equivalent Noise Level) and Lnp (Noise Pollution Level).25 The noise pollution indices were determined using the following formulas:
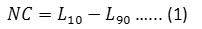
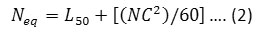
Where, NC is Noise Climate; L10 is the noise level that crosses 10 percent of total observation time or Peak Noise Level. L50 is the noise level that crosses 50% of the overall sampling time. L90 is the amount of sound that exceeds 90% of the total observation time or the level of background or residual noise. Leq is the continuous level of noise, and Lnp is the level of noise pollution. t1 to tn are the real exposure limit at the respective noise levels, and T1 to Tn are the allowable exposure limit at the very same noise levels. If the measured NEI value is more than 1, then the level of noise exposure is considered excessive.
Results
A. Commercial Area
The following results in the form of graphs have been generated from the 24 days study for sampling locations viz. Aerodrome Circle, Kotri Circle, Sabjimandi, and Gumanpura.
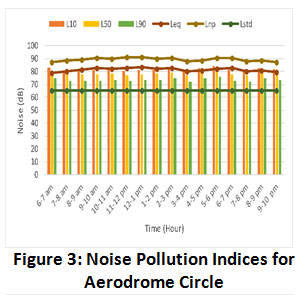 |
Figure 3: Noise Pollution Indices for Aerodrome Circle. Click here to view Figure |
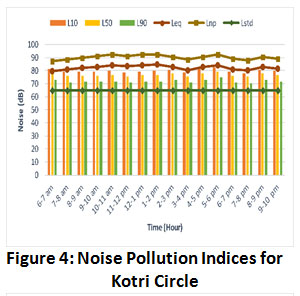 |
Figure 4: Noise Pollution Indices for Kotri Circle. Click here to view Figure |
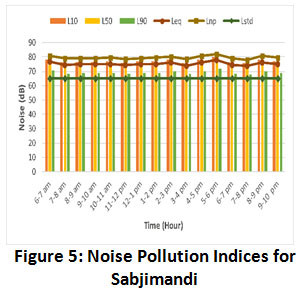 |
Figure 5: Noise Pollution Indices for Sabjimandi. Click here to view Figure |
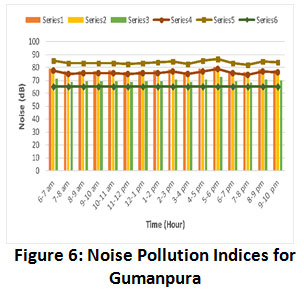 |
Figure 6: Noise Pollution Indices for Gumanpura. Click here to view Figure |
B. Residential Area
The following results in the form of graphs have been generated from the 24 days study for sampling locations viz. Dadwara, Keshavpura, Talwandi and, Jawahar Nagar
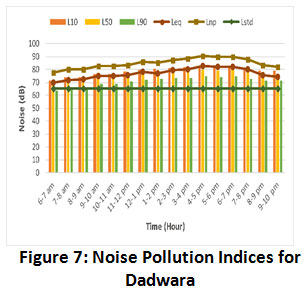 |
Figure 7: Noise Pollution Indices for Dadwara. Click here to view Figure |
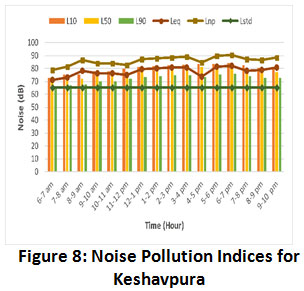 |
Figure 8: Noise Pollution Indices for Keshavpura. Click here to view Figure |
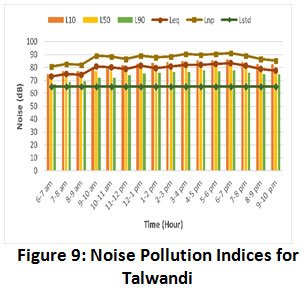 |
Figure 9: Noise Pollution Indices for Talwandi. Click here to view Figure |
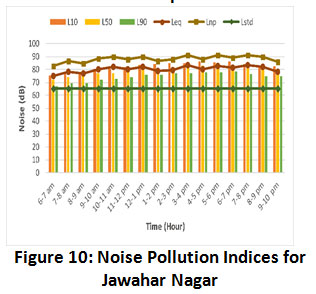 |
Figure 10: Noise Pollution Indices for Jawahar Nagar. Click here to view Figure |
C. Silence Zone
The following results in the form of graphs have been generated from the 24 days study for sampling locations viz. RICCO Institutional Area, Ranpur, MBS Hospital (Nayapura), and Antaghar Circle I.L. Circle:
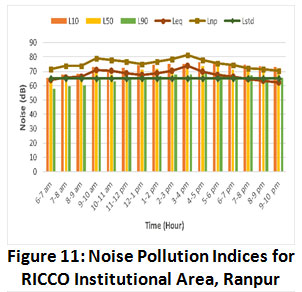 |
Figure 11: Noise Pollution Indices for RICCO Institutional Area, Ranpur. Click here to view Figure |
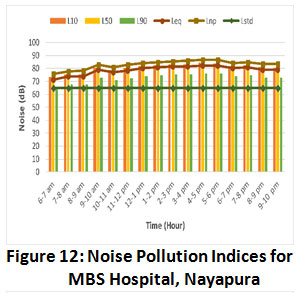 |
Figure 12: Noise Pollution Indices for MBS Hospital, Nayapura. Click here to view Figure |
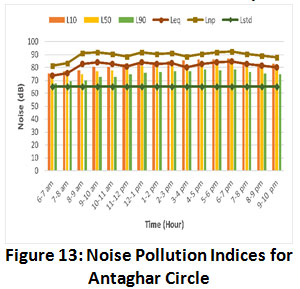 |
Figure 13: Noise Pollution Indices for Antaghar Circle. Click here to view Figure |
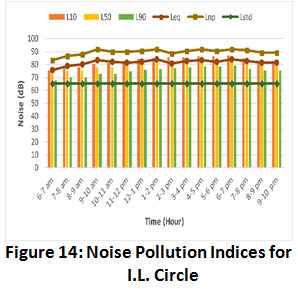 |
Figure 14: Noise Pollution Indices for I.L. Circle. Click here to view Figure |
D. Industrial Area
The following results in the form of graphs have been generated from the 24 days study for sampling locations viz. KSTPS, RICCO Industrial Area (Ranpur), Chambal Industrial Area, and Indraprastha Industrial Area:
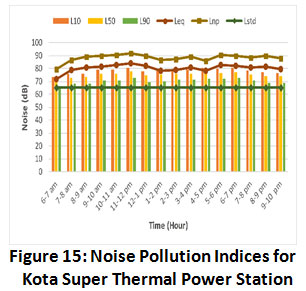 |
Figure 15: Noise Pollution Indices for Kota Super Thermal Power Station. Click here to view Figure |
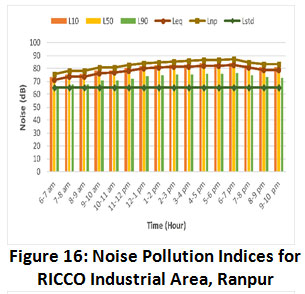 |
Figure 16: Noise Pollution Indices for RICCO Industrial Area, Ranpur. Click here to view Figure |
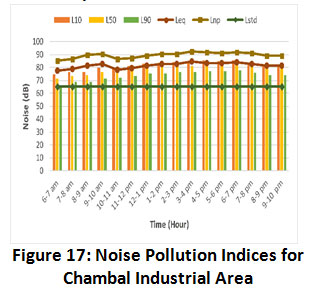 |
Figure 17: Noise Pollution Indices for Chambal Industrial Area. Click here to view Figure |
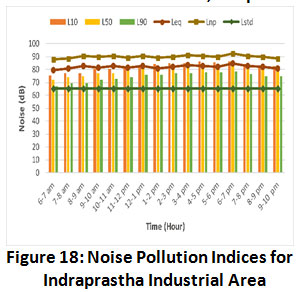 |
Figure 18: Noise Pollution Indices for Indraprastha Industrial Area. Click here to view Figure |
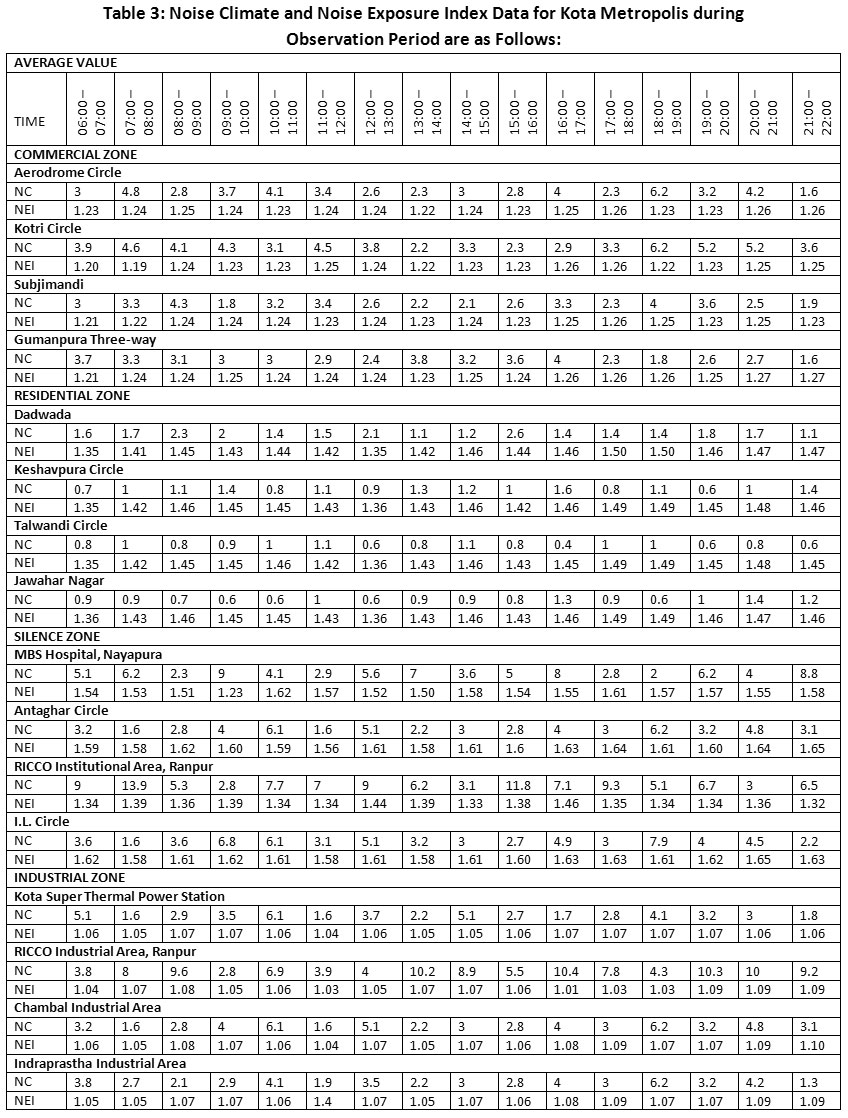 |
Table 3: Noise Climate and Noise Exposure Index Data for Kota Metropolis during Observation Period. Click here to view Table |
Discussion
A. Commercial Area
Figure 3, 4, 5, and 6 shows the average noise pollution indices viz. Leq, Lnp, L10, L50 and L90 for the commercial zone/area in the day-time from 6 am to 10 pm. It evidently showed that the range of Leq is between 77.98 – 82.62 dB(A). The maximum Leq was recorded at Aerodrome Circle [82.62 dB(A)] between 5:00–6:00 pm, while at Kotri Circle between 6:00–7:00 am, it was the minimum [77.98 dB(A)]. The Leq measured in the daytime was greater than 70 dB(A) and 65 dB(A)) in this zone, which exceeded the maximum standards limits of WHO and CPCB respectively. Figure 19 presents the comparison of equivalent noise level (Leq) with Indian and WHO standards regarding to community noise.
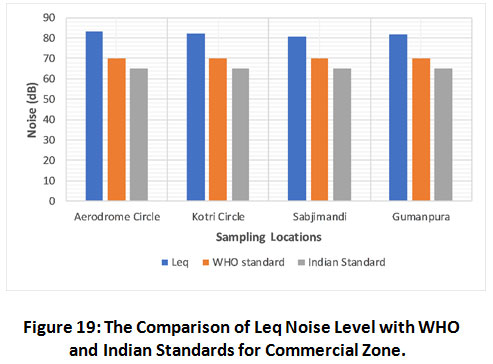 |
Figure 19: The Comparison of Leq Noise Level with WHO and Indian Standards for Commercial Zone. Click here to view Figure |
The range of L10 for Commercial zone is between 79.4 – 84.1 dB(A), having highest L10 value 84.1 dB(A) at Aerodrome Circle between 5:00–6:00 pm, and having lowest L10 value 79.4 dB(A) at Kotri Circle between 7:00–8:00 am during the observation period.
Similarly, the range of L90 is between 74.8 – 81.4 dB(A), having highest L90 value 81.4 dB(A) at Gumanpura Three-way between 8:00–9:00 pm, and having the lowest L90 value 74.8 dB(A) at Kotri Circle between 7:00–8:00 am. The Lnp takes into consideration the indices of both NC and Leq. It provides wide information regarding to noise pollution, with fluctuations in noise level. It regarded as the best indicator of the psychological and physiological effects of noise.
The highest Lnp observed 86.66 dB(A) between 8:00–9:00 pm at Aerodrome Circle and the minimum was 81.74 dB(A) between 1:00–2:00 pm at Subjimandi Circle. The range of Lnp is in between 81.74 – 86.66 dB(A). The data for NC and NEI in Table 3 shown for all the four studied zones of Kota city.
NC indicates more considerable changes in noise levels in the educational sector. The maximum NC = 6.2 between 6:00–7:00 pm at Kotri Circle, and the minimum NC = 1.6 between 9:00–10:00 pm was measured at Gumanpura Three-way. In the commercial sector, the value of NEI always seen over 1 in this observation period. These values are higher than the American National Standard (ANS) 1, indicating more significant noise in the commercial sector.
B. Residential Area
Figure 7, 8, 9, and 10 shows the average noise pollution indices viz. Leq, Lnp, L10, L50 and L90 for the Residential zone/area in the day-time from 6 am to 10 pm. It evidently showed that the maximum Leq was recorded at [82.95 dB(A)]. between 9:00–10:00 pm at Jawahar Nagar, while at 6:00–7:00 am, it was the minimum [74.48 dB(A)] at Dadwara. The Leq measured in the daytime was greater than 55 dB(A) in this zone, which exceeded the maximum standards limits of WHO and CPCB. Figure 20 presents the comparison of equivalent noise level (Leq) with Indian and WHO standards regarding to community noise.
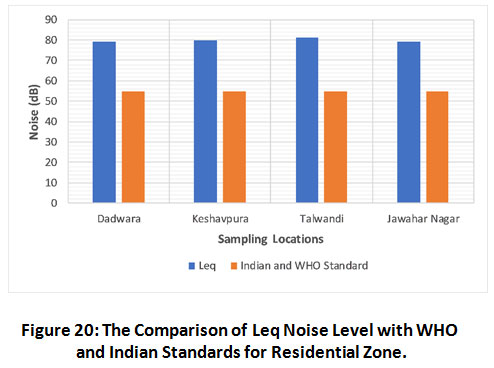 |
Figure 20: The Comparison of Leq Noise Level with WHO and Indian Standards for Residential Zone. Click here to view Figure |
The range of L10 for Commercial zone is between 75.1 – 84.1 dB(A), having highest L10 value 84.1 dB(A) at Keshavpura Circle between 7:00–8:00 pm, and having lowest L10 value 75.1 dB(A) at Dadwara between 6:00–7:00 am during the observation period.
Similarly, the range of L90 is between 72.9 – 82.3 dB(A), having highest L90 value 82.3 dB (A) at Dadwara between 6:00–7:00 pm, and having the lowest L90 value 72.9 dB(A) at Keshavpura Circle between 6:00–7:00 am. The range of Leq is between 74.48 – 82.95 dB(A).
The highest Lnp observed 87.46 dB(A) at Talwandi Circle between 6:00–7:00 pm, and the Lowest was 76.06 dB(A) between 6:00–7:00 am at Dadwara. The range of Lnp is in between 76.06 – 87.46. The calculate data for NC and NEI in Table 3 shown for all the four studied zones of Kota city.
NC presents more considerable changes in noise levels in the educational sector. The maximum NC = 5.1 between 9:00–10:00 am at Talwandi Circle, and the minimum NC = 1.1 between 9:00–10:00 pm was measured at Dadwara. In the Residential Area/Zone, the value of NEI always seen over 1 in this observation period. These values are higher than the American National Standard (ANS) 1, indicating more significant noise in the residential zone/area.
C. Silence Zone
Figure 11, 12, 13, and 14 shows the average noise pollution indices viz. Leq, Lnp, L10, L50 and L90 for the Silence zone/area in the day-time from 6 am to 10 pm. It evidently showed that the maximum Leq was recorded [82.84 dB(A)] between 9:00–10:00 pm at Antaghar circle, while at 9:00–10:00 am, it was the minimum [66.12 dB(A)] at RICCO Institutional Area, Ranpur. The Leq measured in the daytime was greater than 55 dB(A) and 50 dB(A) in this zone, which exceeded the maximum standards limits of WHO and CPCB respectively. Figure 21 presents the comparison of equivalent noise level (Leq) with Indian and WHO standards regarding to community noise.
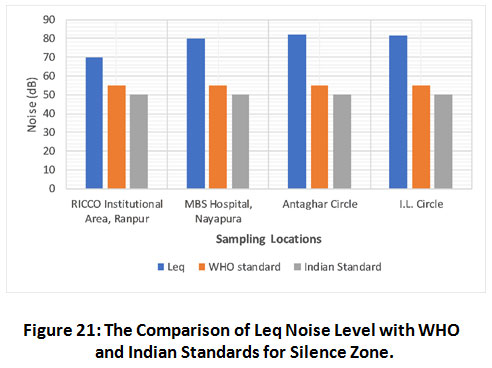 |
Figure 21: The Comparison of Leq Noise Level with WHO and Indian Standards for Silence Zone. Click here to view Figure |
The range of L10 for Silence Zone is between 67.9 – 84.9 dB(A), having highest L10 value 84.9 dB(A) at I.L. Circle between 4:00–5:00 pm, and having lowest L10 value 67.9 dB(A) at RICCO Institutional Area, Ranpur between 2:00–3:00 pm during the observation period.
Similarly, the range of L90 is between 62.1 – 81.3 dB(A), having highest L90 value 81.3 dB(A) at Antaghar circle between 9:00–10:00 pm, and having the lowest L90 value 62.1 dB(A) at RICCO Institutional Area, Ranpur between 6:00–7:00 am. The range of Leq is between 66.12 – 82.84 dB(A). The Lnp takes into consideration the indices of both NC and Leq.
The highest Lnp observed 88.27dBA between 9:00–10:00 am at I.L. Circle, and the minimum was 69.64 dBA between 2:00–3:00 pm at RICCO Institutional Area, Ranpur. The range of Lnp is in between 69.64–88.27. The calculated data for NC and NEI in Table 3 presented for all the four studied zones of Kota city.
NC shows more considerable changes in noise levels in the educational sector. The maximum NC = 11.8 between 7:00–8:00 am at RICCO Institutional Area, Ranpur, and the minimum NC = 1.6 between 7:00–8:00 am was measured at I.L. Circle. In the Silence Zone/Area, the value of NEI always seen over 1 in this observation period. These values are higher than the American National Standard (ANS) 1, indicating more significant noise in the commercial sector.
D. Industrial Area
Figure 15, 16, 17, and 18 shows the average noise pollution indices viz. Leq, Lnp, L10, L50 and L90 for the Industrial Area in the daytime from 6:00 am to 10:00 pm. It evidently showed that the maximum Leq was recorded at Chambal Industrial Area [82.84 dB(A)] between 9:00–10:00 pm, while at 11:00–12:00 am, it was the minimum [77.33 dB(A)] at RICCO Industrial Area. The Leq measured in the daytime was greater than 70 dB(A) and 75 dB(A) in this zone, which exceeded the maximum standards limits of WHO and CPCB respectively. Figure 22 presents the comparison of equivalent noise level (Leq) with Indian and WHO standards regarding to community noise.
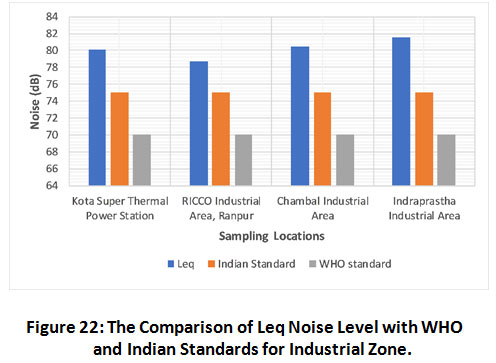 |
Figure 22: The Comparison of Leq Noise Level with WHO and Indian Standards for Industrial Zone. Click here to view Figure |
The range of L10 Industrial Area is between 79.1 – 84.6 dB(A), having highest L10 value 84.6 dB(A) at Chambal Industrial Area between 9:00–10:00 pm, and having lowest L10 value 79.1 dB(A) at RICCO Industrial Area between 6:00–7:00 am during the observation period.
Similarly, the range of L90 is between 74.9 – 81.3dB(A), having highest L90 value 81.3 dB(A) at Chambal Industrial Area between 9:00–10:00 pm, and having the lowest L90 value 74.9 dB(A) at RICCO Industrial Area between 5:00–6:00 pm. The range of Leq is between 77.33 – 82.84 dB(A). The Lnp takes into consideration the indices of both NC and Leq.
The highest Lnp observed 89.64 dBA between 9:00–10:00 pm at RICCO Industrial Area and the minimum was 80.22 dB(A) between 7:00–8:00 am at KSTPS. The range of Lnp is in between 80.22 – 89.64. The calculated data for NC and NEI in Table 3 shown for all the four studied areas of Kota city.
NC presents more considerable changes in noise levels in the educational sector. The maximum NC = 7.8 between 9:00–10:00 pm at RICCO Industrial Area, and the minimum NC = 1.3 between 9:00–10:00 pm was measured at Indraprastha Industrial Area. In the Industrial Area/Zone, the value of NEI always seen over 1 in this observation period. These values are higher than the American National Standard (ANS) 1, indicating more significant noise in the commercial sector.
Discussion
The equivalent sound pressure level (Leq) were observed well above the prescribed Environmental Noise Standards depending upon their area of classification given by CPCB, Delhi in India (Table 1). It is cleared that the equivalent sound pressure level (Leq) for day time was found in between 65-85 dB for all sampling locations except that RICCO Institutional area, Ranpur. It is due to the fact that it is situated outside of Kota city (17 KM away). The Sources which are responsible for high noise levels in the city include vehicular traffic, electrical appliances, music system and TV public address systems, neighborhood, railway and rarely air traffic, and generating sets. Main concern is vehicular traffic in all above mentioned sources.
Characteristically, noise pollution affects the rich and the poor alike. Some efforts that can be made in order to reduce noise pollution in urban environment of Kota city is:
- Promote the use of public transport rather than individual vehicles.
- Provide facility to park vehicles in a community parking mall.
- Parking of vehicles should be prohibited on the along the roads. It will also reduce traffic jam situations in the city.
- Increase the width of the roads where it can be possible.
- Make more overpass and underpass in the busiest area of the City.
- Improvements in the design of vehicles and their components, including low noise tyres, brake-blocks, train wheels.
- Infrastructure improvements, including low noise road surfaces and train lines.
- Urban development that restricts encroachment near busy highways, railways or airports, and rules on building site, architecture and acoustic efficiency.
- Traffic management strategies, including controlling the speed of road vehicles, and traffic calming.
- Increase roadside vegetation (Reduce 4 dB = 40% acoustic energy).
- Use effective Noise Barriers (Location & Surface Area dependent).
Conclusion
The violation of CPCB standards on a percentage basis by Commercial zone, Silence zone, Residential zone, and Industrial zone were 20-24%, 24-60%, 34-43%, and 1-6% respectively at the time of observation period. However, Noise Pollution levels of Kota city can show a considerable variation in a different season of a year. A detailed study should be conducted to determine it. Possible and appropriate steps expected before things get out of control to regulate and reduce the noise levels of Kota city.
References
- Al-tammer KKALAAM. Analysis and Assessment of Noise Pollution in Libraries. 2018;(March).
- Goldsmith JR, Jonsson E. Health effects of community noise. Am J Public Health. 1973;63(9):782-793. doi:10.2105/AJPH.63.9.782.
CrossRef - Dasarathy AK. Noise Pollution : Causes , Mitigation and Control Measures for Attenuation. 2015;(March):136. doi:10.1007/s004210050211.
CrossRef - Gupta S, Ghatak C. Environmental noise assessment and its effect on human health in an urban area. Int J Environ Sci. 2011;1(7):1954-1964.
- El-Sharkawy M, Alsubaie A. Study of environmental noise pollution in the university of dammam campus. Saudi J Med Med Sci. 2014;2(3):178. doi:10.4103/1658-631x.142532.
CrossRef - Sudarsan JS, Nithiyanantham S. Causes, Impact of Noises with Remedies in Rathinamangalam, Tamilnadu, India. Int J Recent Technol Eng. 2019;8(4S2):123-126. doi:10.35940/ijrte.d1029.1284s219.
CrossRef - Wawa EA, Mulaku GC. Noise Pollution Mapping Using GIS in Nairobi, Kenya. J Geogr Inf Syst. 2015;07(05):486-493. doi:10.4236/jgis.2015.75039.
CrossRef - Pantawane RN, Maske K V, Kawade NS. Effects of Noise Pollution on Human Health. Published online 2017:2393-2395. doi:10.17148/IARJSET.
CrossRef - Organization WH. Burden of Disease from Environmental Noise. Published online 2011:128.
- Kumar KVD, Srinivas N. Study of Noise Levels at Traffic Density Areas in. Int J Eng Res Technol. 2014;3(11):783-786.
- Mondal N, Ghatak B. Vulnerability of school children exposed to traffic noise. Int J Environ Health Eng. 2014;3(1):24. doi:10.4103/2277-9183.139739.
CrossRef - Registered V, The AT, Of END, Year F. REGISTRATION OF VEHICLES IN RAJASTHAN REGISTRATION OF VEHICLES IN RAJASTHAN STATE. 2018;(1204005):1-2.
- Singh B, Choudhary MP. Evaluation of noise levels and ascertaining noise indices in an Urbanizing City of Kota, Rajasthan, India. Nat Environ Pollut Technol. 2017;16(3):935-938.
- Singh PK, Gupta RK, Kumar V, Mishra MAK. a Comparative Study of Ambient Noise Levels At Commercial , Residential and Silent Zone in Gorakhpur. Published online 2016:774-778.
- Oni OO, Adetimirin OI, Ajibade SA, Kolade KR. Noise vulnerability mapping using geospatial technique in part of Ibadan north east local government area. World Sci News. 2016;52:143-161.
- Oloruntoba EO, Ademola RA, Sridhar MKC, et al. Urban environmental noise pollution and perceived health effects in Ibadan, Nigeria. African J Biomed Res. 2012;15(2):77-84.
- Thakre C, Laxmi V, Vijay R, Killedar DJ, Kumar R. Traffic noise prediction model of an Indian road: an increased scenario of vehicles and honking. Environ Sci Pollut Res. Published online 2020. doi:10.1007/s11356-020-09923-6.
CrossRef - Sawant SN, Bhave PP. Assessment and Impact of Indoor Noise Pollution. 2014;8354(3):72-78.
- Aluko E, Nna V. Impact of Noise Pollution on Human Cardiovascular System. Int J Trop Dis Heal. 2015;6(2):35-43. doi:10.9734/ijtdh/2015/13791.
CrossRef - Ahmed S, Ismail S. Noise Pollution, Its Sources and Effecrs: A Case Study of University Students in Delhi. EPRA Int J Econ Bus Rev. 2018;6(2):15-23.
- Instruments H. HTC SL1350 SL1352 Digital Sound Level Meter.pdf. :1. doi:https://htcinstrument.com/sl-1350.html.
- Ministry of Environment and forest. the Noise Pollution (Regulation and Control) Rules, 2000. 2000;12311(1110):1088-1569. http://cpcb.nic.in/divisionsofheadoffice/pci2/noise_rules_2000.pdf.
- CPCB (Ministry of Environment & Forests G. Noise Pollution Regulation in India.; 2001. http://cpcbenvis.nic.in/scanned reports/PCL 6 Noise Pollution Regulations in India.pdf.
- Birgitta Berglnd, Thomas Lindvall DHS. Guidelines For Community Noise.; 1999. doi:https://apps.who.int/iris/handle/10665/66217.
- Laxmi V, Dey J, Kalawapudi K, Vijay R, Kumar R. An innovative approach of urban noise monitoring using cycle in Nagpur, India. Environ Sci Pollut Res. 2019;26(36):36812-36819. doi:10.1007/s11356-019-06817-0.
CrossRef


