Seasonal Variation of Water Quality Parameters and Their Impact on Fish Biodiversity Indices of Hasadanga Beel: A Case Study
Chandan Sarkar1
 and Nimai Chandra Saha2
*
and Nimai Chandra Saha2
*
1
Fishery and Ecotoxicological Research Laboratory (Vice Chancellors Research Group),
The University of Burdwan,
Burdwan,
West Bengal,
India
http://dx.doi.org/10.12944/CWE.16.1.03
Copy the following to cite this article:
Sarkar C, Saha N. C. Seasonal Variation of Water Quality Parameters and Their Impact on Fish Biodiversity Indices of Hasadanga Beel: A Case Study. Curr World Environ 2021;16(1). DOI:http://dx.doi.org/10.12944/CWE.16.1.03
Copy the following to cite this URL:
Sarkar C, Saha N. C. Seasonal Variation of Water Quality Parameters and Their Impact on Fish Biodiversity Indices of Hasadanga Beel: A Case Study. Curr World Environ 2021;16(1). Available From : https://bit.ly/3qDVVlX
Download article (pdf) Citation Manager Publish History

Introduction
The transitional areas between terrestrial and aquatic ecosystems are called wetland where the water table is generally at or near the surface on the land which is covered by shallow water1. It is estimated that, India contains about 757.06 thousand wetlands with a total wetland area of 15.3 m ha, which is nearly 4.7% of the total geographical area of the country 2. In India, West Bengal holds a significant position for its large aquatic wealth in terms of floodplain lakes or natural wetlands 3. Floodplain lakes are formed by cutting of river meanders from the main river due to erosion of river banks and siltation. Floodplain wetlands or ox-bow lakes supports a rich and profitable inland fishery system in eastern and north-eastern states of the country particularly in West Bengal 4. More than 150 floodplain lakes are situated in West Bengal covering an area of 42,000 ha, which accounts almost 22% of the state’s total freshwater area 5. These wetlands or floodplain lakes are locally named as beels or baurs. These beels are rich in finfish diversity which is economically beneficial. The productivity of fish can be increased by sustainable use of fish as well as water quality monitoring in regular basis. The physico-chemical parameters of water like pH, temperature, dissolved oxygen, free carbon di-oxide, hardness, alkalinity, salinity, biochemical oxygen demand etc. should be recorded regularly for keeping the aquatic habitat favourable to the fish 6.
The present investigation was performed to study various physicochemical parameters of water in a floodplain lake for a period of three years from 2015 to 2017. River Jalangi and its branches form a large complex of floodplain lakes, locally known as “beels”. The study was based on the relationship between fish assemblage, seasonal fluctuation of water quality parameters and various biodiversity indices of such beel.
The water quality parameters have great influence on the fish assemblage of lakes 7. In India, since the last few decades, the floodplain lakes have become victims of environmental deterioration. Most of the lakes are shrinking due to siltation, various anthropogenic activities like municipal discharge, agricultural run-off, eutrophication etc. 8.
Therefore, seasonal changes in the physicochemical parameters of water and its relationship with various biodiversity indices of fish are very important for assessment of fish diversity in floodplain wetlands. So, the main objectives of the present study was to assess seasonal changes of various physicochemical parameters of water and their impact on various fish biodiversity indices of Hasadanga beel, a floodplain wetland of West Bengal to determine ecological health of the beel.
Materials and Methods
Study Area
The present studies were done on a floodplain lake namely Hasadanga beel. The Hasadanga beel is located besides NH34, near Bahadurpur rail station of the Sealdah-Lalgola Section of Eastern Railway, Under CD Block-Krishnagar-I, Sadar Sub-Division of Nadia District, West Bengal, India. The latitude and longitude of the area are 23026’41.56”N to 23027’48.50”N and 88027’26.54”E to 88029’16.83”E respectively. The tropic of cancer passes beside the area. The nearest town is Krishnagar, District-Nadia. The primary Source of pollution of the beel is agricultural run-off. The nearest river of the beel is Jalangi. Controlling authority of the beel is district administration, Nadia. Average depth of the beel is ranges between 0.7-2.25 m. Surrounding temperature (0C) is ranges between Summer-40-42 and Winter-9-12. Average rainfall is ranged between 1165-1215 mm. The beel is closed type and practices traditional type fisheries. Total length of the beel is 4.07 Km and water area is 64 Ha 8.
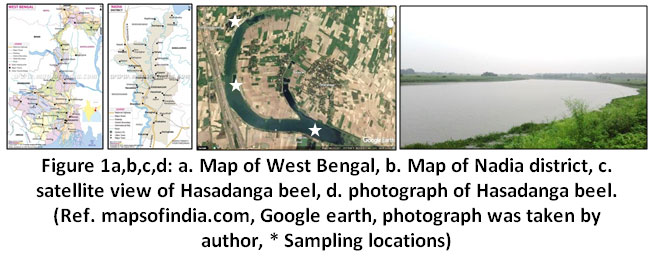 |
Figure 1a,b,c,d: a. Map of West Bengal, b. Map of Nadia district, c. satellite view of Hasadanga beel, d. photograph of Hasadanga beel. (Ref. mapsofindia.com, Google earth, photograph was taken by author, * Sampling locations) |
Sampling
The sampling was done at pre monsoon, monsoon and post monsoon season during the period from 2015 to 2017. Surface water samples were collected randomly from different sites of the beel (Fig. 1c) in 500 ml polypropylene bottles for determination of various physicochemical characters like temperature, pH, dissolved oxygen, free carbon di-oxide, alkalinity, hardness, biochemical oxygen demand etc. following the method of APHA (2012)9. Total 27 water samples were collected during the three-year study. A Celsius alcohol based thermometer (range 0 °C to 100 °C) was used to measure the surface water temperature. pH of water was measured directly by using pen pH meter made by Hanna Instruments, Italy. Dissolved Oxygen, Free Carbon di-oxide, Alkalinity, Hardness and Biochemical Oxygen Demand were measured by titrimetry. Random sampling for fish was done from three nettings in the Beel (Fig. 1c) to make ten kilogram (10 kg) of sample for determination of fish diversity. Total number of species, total number of individuals in a sample and total number of individuals in a species were recorded at pre monsoon, monsoon and post monsoon seasons during the period from 2015 to 2017. Shannon-Weaver species diversity index, Margalef’s species richness index, Pielou’s species evenness index and Simpson’s index of dominance 10-12were determined using the following equations:
- Shannon-Weaver species diversity index (Hꞌ) =
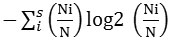
Where S is the total no. of species; N is the total no. of individual; Ni is the no. of specimens in each species. - Margalef’s Species richness index (D) =

Where S is the total no. of species; N is the total no. of individuals. - Pielou’s Species evenness index (Jꞌ) = (Hꞌ)/log2S
Where Hꞌ is the Shannon-Weaver species diversity index; S is the total no. of species. - Simpson’s index of dominance (ID) = Æ© (Ni/N)2
Where N is the total no. of individual; Ni is the no. of individuals in each species.
All the results were initially analysed by Shapiro-Wilk test for determination of normal distribution of a population and further statistically analysed by one-way ANOVA method described by R Development Core Team (2011)13 followed by Duncan’s Multiple Range Test (DMRT) 14. All data used here are the arithmetic mean of three observations. The collected fish were preserved in 4 % formalin solution and shifted to the laboratory for identification. Identification of fish species was done by following standard literatures like 15-18. Method of Ghosh and Biswas (2018) 22 was used for determination of correlation.
Results
The seasonal fluctuation of physicochemical properties of Hasadanga beel during pre-monsoon, monsoon and post monsoon period are given in Table 1. Values are mean of three samples collected from three different sampling sites of the beel (Fig 1c). Hence Standard Deviation is mentioned after each value as ±. All values were initially analysed by Shapiro-Wilk test for determination of normal distribution of a population. Each value is super scribed by (a,b,c) and (m,n,o) which refers that values are significantly different (p<0.05) from each other following one way ANOVA and DMRT (Duncan’s Multiple Range Test) by the R software.
Table 1: Seasonal Variation of the Physicochemical Parameters of Hasadanga Beel at Pre Monsoon, Monsoon and Post Monsoon during the Period from 2015 to 2017.
|
Parameters |
Seasons |
2015 |
2016 |
2017 |
Mean |
|
Water Temperature (°C) |
Pre-Monsoon |
31.3cmn±0.1 |
31.4cn±0.1 |
31.2cm±0.07 |
31.3 |
|
Monsoon |
28.5bm±0.07 |
29.1bo±0.07 |
28.7bn±0.07 |
28.77 |
|
|
Post-Monsoon |
20.2an±0.1 |
20.0am±0.04 |
20.9ao ±0.04 |
20.37 |
|
|
pH |
Pre-Monsoon |
8.65cn±0.01 |
7.85bm ±0.01 |
8.74bo±0.01 |
8.41 |
|
Monsoon |
8.43an±0.01 |
7.70am±0.01 |
8.75co±0 |
8.29 |
|
|
Post-Monsoon |
8.56bn±0.01 |
7.97cm±0 |
8.73ao±0 |
8.42 |
|
|
Free CO2 (mg/l) |
Pre-Monsoon |
0am±0 |
0am±0 |
0am±0 |
0 |
|
Monsoon |
0am±0 |
11.5bn±0.1 |
0am±0 |
3.83 |
|
|
Post-Monsoon |
0am±0 |
15.0cn±0.07 |
0am ±0 |
5 |
|
|
DO (mg/l) |
Pre-Monsoon |
4.5an±0.04 |
3.9am±0.07 |
4.4an±0.08 |
4.27 |
|
Monsoon |
4.7bn ±0.04 |
4.3bm±0 |
4.7bn±0.07 |
4.57 |
|
|
Post-Monsoon |
5.0co±0.01 |
4.7cm±0.04 |
4.9cn±0 |
4.87 |
|
|
Alkalinity (mg/l) |
Pre-Monsoon |
190bn±0.71 |
189bn±0.7 |
187cm±0.71 |
189 |
|
Monsoon |
193co±0.71 |
175an±0.7 |
156am ±0.71 |
175 |
|
|
Post-Monsoon |
184ao±0.71 |
175an±0.7 |
170bm±0.43 |
176 |
|
|
Hardness (mg/l) |
Pre-Monsoon |
145cn±0.71 |
140cm ±0.71 |
141cm±0.71 |
142 |
|
Monsoon |
115an±0.43 |
117ao±0 |
113am±0.71 |
115 |
|
|
Post-Monsoon |
119bm±0 |
119bm±0.43 |
120bn ±0.43 |
119 |
|
|
BOD (mg/l) |
Pre-Monsoon |
1.23bn±0 |
1.04am±0.01 |
1.85bo±0.01 |
1.37 |
|
Monsoon |
1.67cn±0.01 |
1.42cm±0.01 |
1.94co ±0.01 |
1.67 |
|
|
Post-Monsoon |
1.03am±0.01 |
1.25bn±0.01 |
1.55ao±0.01 |
1.27 |
(Values within columns indicated by different superscript letter (a,b,c) and values within rows indicated by different superscript letter (m,n,o) are significantly different at 5% level determined by Duncan’s Multiple Range Test).
Overall 34 fish species belonging to 8 Orders were recorded during the study period of three years (2015-2017) and are listed in table 2. Here IUCN refers to International Union for Conservation of Nature, PM refers to pre-monsoon, M refers to monsoon and PoM refers to post-monsoon. Here ‘+++’=highly abundant, ‘++’=moderately abundant, ‘+’=less abundant and ‘-’ =absent.
Table 2: Fish Species found in Hasadanga Beel during the Study Period of Three Years (2015-2017)
|
Order |
Family |
Species |
Common name |
IUCN status |
Population trend |
Occurrence |
||
|
PM |
M |
PoM |
||||||
|
1.Cypriniformes |
|
|
Rohu/Rui |
Least Concern |
Unknown |
+++ |
+++ |
+++ |
|
Bata |
Least Concern |
Unknown |
+++ |
+++ |
+++ |
||
|
Kalbose |
Least Concern |
Unknown |
+++ |
+++ |
+++ |
||
|
Katla |
Not Evaluated |
|
+++ |
+++ |
+++ |
||
|
Mrigel |
Least Concern |
Stable |
+++ |
+++ |
+++ |
||
|
Sarpunti |
Least Concern |
Unknown |
+++ |
+++ |
+++ |
||
|
Punti |
Least Concern |
Unknown |
+++ |
- |
+ |
||
|
Punti |
Least Concern |
Unknown |
+++ |
- |
+ |
||
|
Silver carp |
Near Threatened |
Decreasing |
+++ |
+++ |
+++ |
||
|
Common carp |
Vulnerable |
Unknown |
+++ |
+++ |
+++ |
||
|
Grass carp |
Not Evaluated |
|
+++ |
+++ |
+++ |
||
|
Mourola |
Least Concern |
Stable |
- |
+ |
+ |
||
|
Black carp |
Data Deficient |
Unknown |
+ |
- |
+ |
||
|
2.Siluriformes |
|
|
Pholui |
Least Concern |
Stable |
+++ |
+++ |
+++ |
|
Chital |
Not Evaluated |
|
++ |
++ |
++ |
||
|
|
Tengra |
Least Concern |
Decreasing |
+++ |
+++ |
+++ |
|
|
Aar tengra |
Least Concern |
Stable |
+ |
- |
- |
||
|
|
Boal |
Vulnerable |
Decreasing |
+++ |
+++ |
+++ |
|
|
|
Vacha |
Least Concern |
Decreasing |
+ |
- |
+ |
|
|
|
Magur |
Least Concern |
Stable |
+++ |
++ |
++ |
|
|
|
Singhi |
Least Concern |
Stable |
+++ |
++ |
++ |
|
|
3.Perciformes |
|
|
Bele |
Not Evaluated |
|
- |
++ |
++ |
|
|
Koi |
Least Concern |
Stable |
+ |
++ |
++ |
|
|
|
Bheda/Roina |
Least Concern |
Unknown |
- |
++ |
++ |
|
|
|
Nilontica |
Least Concern |
Stable |
+ |
+++ |
+++ |
|
|
4.Ophiocephaliformes |
|
|
Shal/Gajal |
Least Concern |
Unknown |
+++ |
++ |
++ |
|
Shol |
Least Concern |
Stable |
+++ |
++ |
++ |
||
|
Cheng |
Vulnerable |
Decreasing |
+ |
+ |
+ |
||
|
Lata |
Least Concern |
Stable |
+++ |
+++ |
+++ |
||
|
5.Mastacembeliformes |
|
|
Pankal |
Not Evaluated |
|
+ |
+ |
+ |
|
Guchi |
Not Evaluated |
|
+++ |
++ |
++ |
||
|
6.Clupeiformes |
|
|
Khoira |
Least Concern |
Decreasing |
++ |
++ |
++ |
|
7.Beloniformes |
|
|
Kankle |
Least Concern |
Unknown |
++ |
++ |
++ |
|
8.Symbranchiformes |
|
|
Ban/Cuche |
Least Concern |
Unknown |
+++ |
+++ |
++ |
Number and Percent Composition of Families, Genera and Species under various Orders of fish fauna found in Hasadanga beel during the study period are listed in Table 3.
Table 3: Number and Percent Composition of Families, Genera and Species Under Various Orders.
|
Sl no |
Order |
Families |
Genera |
Species |
% of Families in an Order |
% of Genera in an Order |
% of Species in an Order |
|
1 |
Cypriniformes |
01 |
09 |
13 |
6.25 |
34.62 |
38.25 |
|
2 |
Siluriformes |
06 |
07 |
08 |
37.5 |
29.92 |
23.53 |
|
3 |
Perciformes |
04 |
04 |
04 |
25 |
15.38 |
11.76 |
|
4 |
Ophiocephaliformes |
01 |
01 |
04 |
6.25 |
3.85 |
11.76 |
|
5 |
Mastacembeliformes |
01 |
02 |
02 |
6.25 |
7.69 |
5.88 |
|
6 |
Clupeiformes |
01 |
01 |
01 |
6.25 |
3.85 |
2.94 |
|
7 |
Beloniformes |
01 |
01 |
01 |
6.25 |
3.85 |
2.94 |
|
8 |
Symbranchiformes |
01 |
01 |
01 |
6.25 |
3.85 |
2.94 |
|
|
Total |
16 |
26 |
34 |
|
|
|
Percentage occurrence of fishes of Hasadanga beel under the various conservation categories of IUCN are listed in Table 4.
Table 4: Percentage Occurrence of fishes of Hasadanga Beel under the Conservation Status IUCN (2020) (Ref: https://www.iucnredlist.org/)
|
|
EN |
VU |
NT |
LC |
LR |
DD |
NE |
Total |
|
Number of species |
00 |
03 |
01 |
23 |
00 |
01 |
06 |
34 |
|
Percent contribution |
00% |
8.82% |
2.94% |
67.65% |
00% |
2.94% |
17.65% |
100% |
EN=Endangered
VU=Vulnerable
NT=Near Threatened
LC=Least Concerned
LR=Lower Risk
DD=Data Deficient
NE=Not Evaluated
Number of Families, Genera and Species under various Orders of fish fauna found in Hasadanga beel during the study period are graphically presented at Fig. 2.
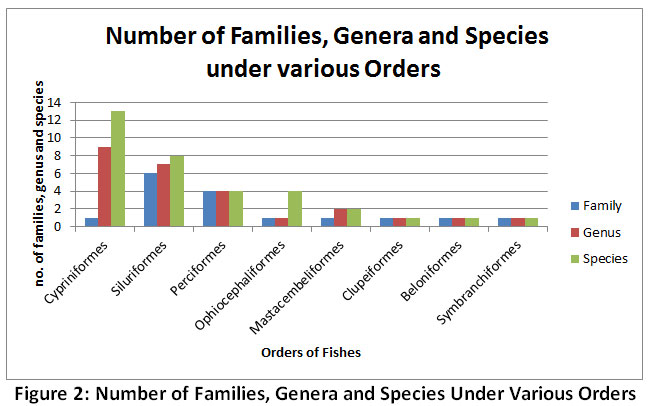 |
Figure 2: Number of Families, Genera and Species Under Various Orders. Click here to view Figure |
Percentage occurrence of fishes of Hasadanga beel under the various conservation categories of IUCN are graphically presented in Fig. 3.
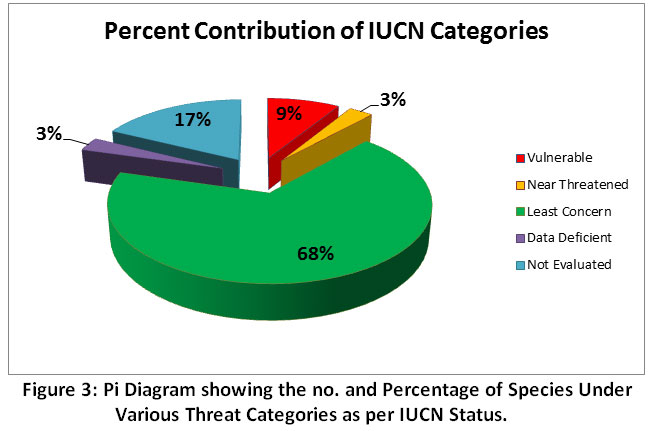 |
Figure 3: Pi Diagram showing the no. and Percentage of Species Under Various Threat Categories as per IUCN Status. Click here to view Figure |
The number of individuals belonging to 8 different orders of fish found per ten kilogram sample is represented graphically in figure 4.
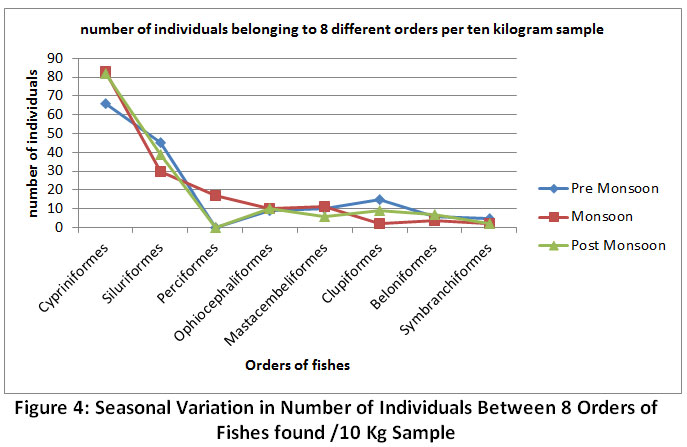 |
Figure 4: Seasonal Variation in Number of Individuals Between 8 Orders of Fishes found /10 Kg Sample. Click here to view Figure |
Shannon-Weaver species diversity index, Margalef’s species richness index, Pielou’s species evenness index and Simpson’s index of dominance for fish were determined at pre-monsoon, monsoon and post-monsoon period for 2015, 2016 and 2017 are listed in table 5. Each value is super scribed by (a,b,c) and (m,n,o) which refers that values are significantly different (p<0.05) from each other following one way ANOVA and DMRT (Duncan’s Multiple Range Test) by the R software.
Table 5: Various species diversity indices for fish of Hasadanga Beel at at pre-monsoon, monsoon and post-monsoon period for 2015, 2016 and 2017.
|
Sl no |
Diversity indices |
Season |
2015 |
2016 |
2017 |
Mean |
|
1 |
Shannon-Weaver species diversity index (Hꞌ) |
Pre-monsoon |
1.35cn |
1.30bm |
1.40co |
1.35±0.04 |
|
Monsoon |
1.29an |
1.25am |
1.32ao |
1.28±0.03 |
||
|
Post-monsoon |
1.34bn |
1.31cm |
1.37bo |
1.34±0.02 |
||
|
2 |
Margalef’s Species richness index (D) |
Pre-monsoon |
13.24bn |
13.10bm |
13.44bo |
13.26±0.14 |
|
Monsoon |
12.72an |
12.55am |
12.82ao |
12.69±0.11 |
||
|
Post-monsoon |
14.15cn |
13.98cm |
14.25co |
14.12±0.11 |
||
|
3 |
Pielou’s Species evenness index (Jꞌ) |
Pre-monsoon |
0.91cn |
0.90cm |
0.92co |
0.91±0.01 |
|
Monsoon |
0.88an |
0.87am |
0.89ao |
0.88±0.01 |
||
|
Post-monsoon |
0.89bn |
0.88bm |
0.91bo |
0.89±0.01 |
||
|
4 |
Simpson’s index of dominance (ID) |
Pre-monsoon |
0.053an |
0.054ao |
0.052am |
0.053±0.001 |
|
Monsoon |
0.071cn |
0.073co |
0.070cm |
0.071±0.001 |
||
|
Post-monsoon |
0.057bo |
0.056bn |
0.055bm |
0.056±0.001 |
(Values within columns indicated by different superscript letter (a,b,c) and values within rows indicated by different superscript letter (m,n,o) are significantly different at 5% level determined by Duncan’s Multiple Range Test).
Correlation between various physicochemical parameters with different species diversity indices of Hasadanga beel during the study period (2015-17) are listed in table 6.
Table 6: Correlations between Physicochemical Parameters and Species Diversity Indices
|
Parameters |
Shannon-Weaver species diversity index (Hꞌ) |
Margalef’s Species richness index (D) |
Pielou’s Species evenness index (Jꞌ) |
Simpson’s index of dominance (ID) |
|
Temperature |
-0.16742 |
-0.80804 |
0.40141 |
0.09948 |
|
pH |
0.97974 |
0.84137 |
0.70887 |
-0.96372 |
|
Free CO2 |
-0.41729 |
0.33551 |
-0.84775 |
0.47857 |
|
DO |
-0.13207 |
0.59732 |
-0.65465 |
0.19967 |
|
Alkalinity |
0.65947 |
-0.05247 |
0.96393 |
-0.70942 |
|
Hardness |
0.71298 |
0.02113 |
0.98090 |
-0.75934 |
|
BOD |
-0.93050 |
-0.92200 |
-0.57656 |
0.90322 |
Discussion
In the current study, temperature ranges between 20.2 to 31.3, 20.0 to 31.4 and 20.9 to 31.20C during 2015, 2016 and 2017 respectively (table 1). The temperatures are significantly varies (p<0.05) at all the seasons in every year. The highest and lowest temperature was recorded at pre-monsoon and post-monsoon season of 2016. High solar radiation and low level of water may cause the comparative higher temperature during summer season. Oppositely, high water level and low solar radiation may cause the lower temperature of winter season at every year26, 27. The values of pH range between 8.43 to 8.56, 7.70 to 7.85 and 8.73 to 8.75 during 2015, 2016 and 2017 respectively (table 1). Comparatively higher pH value may be caused by higher amount of macrophytes with algae and phytoplankton in the beel which consume Carbon dioxide from the water for photosynthesis thereby increase of pH level 27. The free CO2 remains nil at all seasons of 2015 and 2017 (table 1). But it ranges from 0.00 to 15.0 mg/l at 2016. The highest level of free CO2 recorded at post monsoon season which correspond the pH value of the water. The dissolved oxygen ranges between 4.5 to 5.0, 3.9 to 4.7 and 4.4 to 4.9 mg/l during 2015, 2016 and 2017 respectively (table 1). Comparatively higher DO value recorded at post-monsoon season and lower DO value was recorded at pre-monsoon season. High water temperature during summer reduces the holding capacity for oxygen molecule and thereby decreases the solubility of oxygen which results low DO value during summer season28. The total alkalinity ranges between 184 to 193, 175 to 189 and 156 to 187 mg/l during 2015, 2016 and 2017 respectively (table 1). The higher alkalinity value during summer season may be the result of organic decomposition, which releases CO2 which form bicarbonate ions causing increase in total alkalinity in water. Dilution of water due to rainfall causes reduction of total alkalinity at monsoon27. The hardness value ranges between 115 to 145, 117 to 140 and 113 to 141 mg/l during 2015, 2016 and 2017 respectively (table 1). The maximum value of hardness was observed during summer season whereas minimum at monsoon season. Reduction in water level at pre-monsoon may cause concentration of water with Ca and Mg salts which are responsible to increase hardness of water. Oppositely, at monsoon and post-monsoon seasons, the hardness has been decreased due to the dilution of the salts in water29. The Biochemical Oxygen Demand value ranges between 1.03 to 1.67, 1.04 to 1.42 and 1.55 to 1.94 mg/l during 2015, 2016 and 2017 respectively (table 1). Maximum BOD value was observed during monsoon season of every year. It may be due to huge inflow of rain-wash which contains detergents, domestic sewage and agricultural effluents. Higher BOD value may causes decline in aquatic biodiversity. These results corresponds the trends of earlier workers27.
Overall 34 fish species belonging to 8 Orders and 16 families were recorded during the study period of three years (2015-2017) (Table 2). Out of 34 species, three vulnerable and one near threatened species were found. Besides that, 23 least concerned species were found which constitutes almost 68% of total species. Almost 18% species found which were not evaluated by IUCN. Order Cypriniformes contains most numbers of Genera and Species followed by Siluriformes. Earlier workers 23 records 46 fish species in total at the beels of Nadia district. Ghosh and Biswas24 recorded 33 species of finfish belonging to 8 orders and 17 families in a study on Chhariganga Oxbow Lake located in Nakashipara development block of Nadia district.
The Shannon-Weaver species diversity index (Hꞌ) ranges between (1.2911-1.3502) which corresponds earlier workers24 where Shannon-Weaver species diversity index ranges between 1.19-2.02, Margalef’s species richness index (D) ranges between (12.72-14.15), Pielou’s species evenness index (Jꞌ) and Simpson’s index of dominance (ID) ranges between (0.8829-0.9140) and (0.05346-0.07139) respectively which does not correspond with earlier workers24 where Pielou’s species evenness index ranges between 0.36-0.64 and Simpson’s index of dominance ranges between 0.21-0.51. These may be the result of jute retting and other environmental and anthropogenic factors in those beels studied by earlier workers24, 25.
Shannon-Weaver species diversity index (Hꞌ) is highest in post-monsoon period of 2017 whereas lowest in monsoon season of 2016. Hꞌ has positive correlation with pH, alkalinity and hardness whereas negative correlation with temperature, free CO2, DO and BOD. Margalef’s Species richness index (D) is highest in post monsoon period of 2016 and lowest in monsoon season of both 2015 and 2017. D has positive correlation with pH, free CO2, DO and hardness whereas negative correlation with temperature, alkalinity and BOD. Pielou’s Species evenness index (Jꞌ) is highest in pre monsoon period of 2017 and lowest in pre monsoon season of 2015. Jꞌ has positive correlation with temperature, pH, alkalinity and hardness and whereas negative correlation with free CO2, DO and BOD. Simpson’s index of dominance (ID) is highest in monsoon period of 2016 and lowest in pre monsoon season of 2017. ID has positive correlation with temperature, free CO2, DO and BOD whereas negative correlation with pH, alkalinity and hardness.
The Shannon-Weaver species diversity index, Margalef’s species richness index and Pielou’s species evenness index values are highest in 2017 and lowest in 2016 at all seasons. But Simpson’s index of dominance value is highest at 2016 and lowest at 2017 for all seasons. This may be due to low pH value, low DO value and low BOD value in 2016.
The Shannon-Weaver species diversity index is highest in pre monsoon season and lowest in monsoon season for the year 2015 and 2017. But in 2016, it is highest in post monsoon. The Margalef’s species richness index and Pielou’s species evenness index are lowest in monsoon and highest in post monsoon for all the seasons (except J’ for 2017). The Simpson’s index of dominance shows highest value in monsoon and lowest in pre monsoon period for all the years. These are probably due to fall of agricultural runoff from adjacent agricultural land in monsoon season.
So, the impact of seasonal variations of physicochemical parameters like temperature, dissolved oxygen and pH are found to influence in fish diversity of the Hasadanga beel. The physicochemical parameters and anthropogenic activities can be considered as the key factors for reduction of biodiversity of the beels. Similar results were also observed by earlier workers 19-21, 27, 28.
Conclusion
From the present study, it is evident that, Hasadanga beel, a floodplain wetland of Nadia district, harbours a large number of freshwater fish fauna as compared to similar works carried out in West Bengal23, 24. But the range of Shannon-Weaver species diversity index (Hꞌ) (1.2911-1.3502) suggests that the diversity of fish is moderate here. The low level of SW in monsoon season also indicates that the water is moderately polluted during monsoon season, which may be due to the inflow of agricultural run-off and domestic sewage. Comparatively high SW value in pre-monsoon season can suggest that the water temperature can also support positively the fish diversity in the wetland. The seasonal variation of fish diversity indices should be taken into account for making long term policies for sustainability of wetlands in the country.
Acknowledgement
The authors are thankful to the Head, P.G. Dept. of Zoology, Krishnagar Govt. College and Head, Dept. of Zoology, University of Burdwan for providing infrastructural facilities to carry out the work.
Conflict of Interest
Authors have not any conflict of interest including any financial, personal or other relationships with other people or organizations that can influence the work.
References
- Das A C, Studies of impact of pollution of the wetlands of Guwahati. Ph.D. thesis, Gauhati University, 2008.
- Space Applications Centre (SAC), National Wetland Atlas. SAC, Indian Space Research Organisation, Ahmedabad. 2011.
- Saha N. C. and Dhara K. Use of water quality, floral and faunal diversity in the determination of ecological health of four beels of murshidabad in West Bengal, India, Proc. Nat. Con. Cha. Bio. Res. Man., 2014; 282-293p.
- Mondal, D.K. and A. Kaviraj. Distribution of fish assemblages in two floodplain lakes of north 24-parganas in west Bengal, India. Journal of Fisheries and Aquatic Science, 2009, 4(1): 12-21.
CrossRef - ICAR. Handbook of fisheries and Aquaculture. 1stEdn., Indian Council of Agricultural Research (ICAR), New Delhi, ISBN: 81-7164-061-3, 2006; pp: 756.
- Mondal, D.K., A. Kaviraj and S. Saha. Water quality parameters and fish biodiversity indices as measures of ecological degradation: a case study in two floodplain lakes of India, J. Water Resource and Protection, 2010; 2: 85-92.
CrossRef - Carol J, L. Benejam, C. Alcaraj, A. Vila-Gispert, L. Zamora, E. Navaro, J. Armengol, and E. Garcia-Berthou, , The effects of limnological features on fish assemblages of 14 spanish reservoirs, Ecology of freshwater fish, 2006;15: 66-77.
CrossRef - Khan R.A. The ecology and faunal diversity of two floodplain ox-bow lakes of south eastern West Bengal. Records of the Zoological Survey of India, 2002; 195:1-57.
- APHA, AWWA and WPCA.(2012). Standard methods for the examination of water and wastewater.(22). Washington: American Journal of Public Health.
- Shannon, C.E. and Weaver, W.The mathematical theory of communication.Urbana, University of Illinois, 1963, 117-125.
- Pielou, E.C. The measurement of diversity in different types of biological collections. Journal of Theoretical Biology, 1966, 13: 131-144.
CrossRef - Simpson, E.W. Measurement of diversity. Nature, 1949, 163: 688.
CrossRef - R Development Core Team 2011. R: A language and environment for statistical computing. R Foundation for Statistical Computing, Vienna, Austria. ISBN 3-900051-07-0, URL http://www.Rproject.org/. Accessed 8 Oct 2012.
- Gomez, K.A. and Gomez, A.A. Statistical procedures for agricultural research. . 1984; (2) Wiley, New York.
- Day F, The fishes of India; being a natural history of the fishes known to inhabit the seas and fresh waters of India, Burma and Ceylon. London, 1878.
CrossRef - Nelson J S, Fishes of the World.John Wiley and Sons. New York. 1976.
- Jayaram K C. The freshwater fishes of India, Pakistan, Bangladesh, Burma and Sri Lanka- A Handbook. ZSI, 1981; Calcutta, India.
- Talwar P K, Jhingran A G. Inland fishes of India and adjacent countries.Vol. 1 & 2, 1991; Oxford and IBH Publishing Company Pvt. Ltd., New Delhi.
- Benson B J, Magnuson J. Spatial heterogeneity of littoral fish assemblages in lakes: Relation to species diversity and habitat structure, Canadian Journal of Fisheries and Aquatic Science, 1992; 49:1493-1500.
CrossRef - Vono V, Barbosa F A R. Habitat and littoral zone fish community structure of two natural lakes in southeast Brazil, Envioronmental Biology of Fishes, 2001; 61:371-379.
CrossRef - Deka T K, Goswami M M, Kakati M. Causes of fish depletion- a factor analysis approach, NAGA, World Fish Centre Newsletter, 2005; 28: 37-42.
- Ghosh D. and Biswas J.K. Impact of jute retting on physicochemical profile of Chhariganga oxbow lake in Nadia district, West Bengal, India, Archives of Agriculture and Environmental Science, 2018; 3(1): 36-44; https://doi.org/10.26832/24566632.2018.030104.
CrossRef - Mukherjee S., Panigrahi A. K. and Mandal A, Study on the Effects of Pollution on Icthyofaunal Diversity of Selected Fresh Water Beels in Nadia District, West Bengal, Indian Journal of applied Research, 2015; 5(3): 558-561.
- Ghosh D, Biswas J K Fish Fauna Faces Anthropogenic Double Trouble: Erosion of Fish Diversity in Tropical Oxbow Lake of the Ganga River Basin in Eastern India. J Biodivers Endanger Species, 2017; 5:188. doi: 10.4172/2332-2543.1000188.
CrossRef - Ghosh, D. and Biswas, J.K. Impact of jute retting on physicochemical profile of Chhariganga oxbow lake in Nadia district, West Bengal, India. Archives of Agriculture and Environmental Science, 2018; 3(1): 36-44 DOI: 10.26832/24566632.2018.030104.
CrossRef - FAO, Fisheries and Aquaculture Department, Food and Agriculture Organization of the United Nations, Rome, The State of World Fisheries and Aquaculture, 2010; pp. 115–116,
- Dey D, Mukherjee D and Saha N C, A study on the seasonal fluctuation of water quality and zooplankton diversity in the determination of ecological health of five natural water bodies in West Bengal, Indian Journal of Fundamental and Applied Life Sciences, 2015; 5(1):65-72.
- Gogoi B., Kachari A. and Das D.N. Assessment of water quality in relation to fishery perspective in flood plain wetlands of Subansiri River basin Assam, India. J. Fish. Aquat. Sci., 2015; 10(3):171-180.
CrossRef - Sharma B.K. Phytoplankton diversity of two floodplain lakes (Pats) of Manipur (N.E. India). J. Threat. Taxa. 2010; 2(11):1273-1281.
CrossRef


