A Study of Socio-Economic Impact of Soft Approaches of Climate Adaptation using Changing Fuel Practice in Indoor Air at Rural Sites in India
Kopal Verma
and Umesh Chandra Kulshrestha
*

http://dx.doi.org/10.12944/CWE.16.2.11
Copy the following to cite this article:
Verma K, Kulshrestha U. C. A Study of Socio-Economic Impact of Soft Approaches of Climate Adaptation using Changing Fuel Practice in Indoor Air at Rural Sites in India. Curr World Environ 2021;16(2). DOI:http://dx.doi.org/10.12944/CWE.16.2.11
Copy the following to cite this URL:
Verma K, Kulshrestha U. C. A Study of Socio-Economic Impact of Soft Approaches of Climate Adaptation using Changing Fuel Practice in Indoor Air at Rural Sites in India. Curr World Environ 2021;16(2). Available From: https://bit.ly/386ap6T
Download article (pdf) Citation Manager Publish History

Introduction
In many countries majority of the people are spending more than 80-90% of their time indoors which is making it a serious concern to be taken into consideration1. Indoor air pollution has the capacity to cause two to five times more pollution than the outdoor environments2,3,4. The outdoor air pollution affects indoor air because the air ventilates through the houses5,6. The conditions contributing to the indoor air pollution are different in rural and urban areas. In the developing countries of the world, indoor air pollution in rural areas is causing severe risk, as here the population dependent on traditional biofuels (dung cake, charcoal, fuelwood, crop residue, etc.) for cooking and heating is as high as 3.5 billion people7,8,9,10. In India, around 86% people in rural and 24% in urban areas , are using local biomass such as dung cake, wood and crop residue11,12. State wise in India, the highest users of biomass fuel are in Bihar followed by Uttar Pradesh. Tamil Nadu state has the lowest users of biomass fuel13. However around 31.5% of houses do not have a separate area for kitchen. The same microenvironment is used for other activities such as cooking, sleeping, etc. This adds on to the extra exposure of the residents to indoor air pollution13, 14.
Liquefied Petroleum Gas (LPG) is also used as a common fuel but it is predominantly limited to urban and suburban areas of the country. Large amount of smoke and other air pollutants is produced by burning these fuels, which in the restricted space of home multiplies the indoor levels of particulate matter exceeding even those of the polluted cities, thereby resulting in high exposure. In addition, poor ventilation in a house results in a longer residence time for some of the pollutants present in the smoke15,16,17,18
The factors controlling the concentration and generation of wide range of indoor pollutants in the kitchen microenvironment are: socio-economic status of the country, outdoor air quality, meteorological conditions, type of activities in the surroundings, occupancy of the building, ambient atmospheric conditions, stove type, fuel type, structure of kitchen, cooking raw material and ventilation19,20,21. A chullah is an earthen U-shaped open stove that is used for cooking and heating purposes, mostly in rural households using solid biomass as fuel. In these traditional open stoves, the incomplete combustion of biomass fuel leads to the production of huge amounts of pollutants and also these are highly inefficient cookstoves with very low fuel combustion efficiency (~15%)22,23,24,25. There are reports revealing that during cooking time, the suspended particulates and carbon monoxide levels were high ranging from 200-30,000 µg/m3 and 10-500 ppm respectively26,27,28,29,30. The biomass burning also affects the atmospheric radiations by emitting Black Carbon (BC) particles and carbon dioxide (CO2) which are resulting in climate change31,32,33. Among atmospheric aerosol particles, carbon shares the largest elemental fraction in various physical and chemical forms which can be classified as carbonaceous aerosols34. Carbonaceous aerosols include two types of components viz. organic and elemental. Organic carbon (OC) is the component, which scatters solar radiation and causes net negative radiative forcing. The other component, which absorbs the refractory light, causing net positive radiative forcing, is known as elemental carbon (EC) when thermal optical methods are used for quantification and is known as black carbon (BC) when optical methods are used for quantification. Graphitic carbon or soot are also light-absorbing components35,36,37
In order to manage the emissions of carbonaceous species, adaptation and mitigation approaches are helpful. According to IPCC (2014), mitigation can be defined as a human intrusion to improve the sinks or minimize the sources of greenhouse gases causing global warming38. Various hard and soft measures or approaches have been worked upon for mitigation. There are various approaches available for the existing measures, and so it is necessary to understand these before inculcating the outlook of adaptation into them39. Soft approaches correspond to adaptation, which mainly focuses on implementing and designing the procedures to motivate behavior of adaptation and reduce frangibility. Soft approaches can be defined as the set of procedures designed and implemented to encourage mitigative and adaptive behavior by the users including proper information dissemination, economic feasibility and ease of applicability38. Soft approaches can be applied by a well-informed team which encourages a voluntary involvement from the users. Also, with a little effort this method can prove to be extremely beneficial and economical for the users. Soft approaches include behavioral, non-physical, non-structural, institutional aspects, etc. On the other hand, hard approaches include substantial adjustments in user’s lifestyle and are governed by enforcement of laws and regulations which may or may not be economical and easily applicable. Hard approaches involve the alteration in the structural features like physical infrastructure, facilities, equipment, etc.
Various models and theories have been proposed to understand, evaluate and extrapolate the energy use and domestic fuel choice in developing countries. Two such theories are Energy Ladder Theory and Fuel Stacking (Multi-Fuel) Theory40.
The Energy Ladder Theory
This theory is based on the economic theory of consumer behavior41, which propose that when income increases, households start consuming same good in comparatively larger quantities and start shifting towards more sophisticated means and methods. The energy ladder theory establishes a strong correlation between household fuel choice and income40. Economic growth may result into the reduction in the demand of solid biomass fuel and leads to a shift towards the use of commercial fuels (kerosene, LPG, electricity, improved cookstove). This theory in a nutshell is the movement from traditional to modern energy services in the energy ladder when income/economic status of the households increases42. The main reason for the movement is that the households preferred clean fuels, ease of use and greater efficiency and modern fuels have these qualities unlike traditional fuels such as fuelwood, crop residues and dung43. On the contrary, various studies also provided that the fuels choice and transition is not only dependent on income but there are other significant factors as well such as access to electricity, accessibility and forest scarcity, etc42.
Fuel Stacking (Multi-Fuel) Theory
This theory suggests that in developing countries, households do not switch to modern energy sources straightaway but instead use a combination of traditional and modern fuels. This method of consumption of fuel is known as fuel stacking44. Thus, they are not moving up the ladder step by step with the rise in income, instead households choose different fuels for use as per their convenience. Insufficient funds become a big barrier for households in developing countries to purchase expensive modern energy appliances and therefore they keep multiple fuel options as a back up to provide them a sense of energy security45. There are a few additional factors as well like frequent fluctuations in prices and unreliable services. This model elucidates the livelihood strategy that rural households are adopting which is helping them protect from fragile markets, cope up with fluctuating income supply and keeping a hold of their cultural practices along with benefitting from the modern fuels also to some extent46.
This study was carried out in the Budhwada and Baggi villages of Madhya Pradesh (M.P.) and Himachal Pradesh (H.P.) states respectively. Budhwada village lies in the plain region whereas Baggi village is situated in hilly terrain. Different challenges are faced by the rural households in plain and hilly regions with respect to fuel availability and collection, cleaner fuel outreach, perception towards using cleaner fuel (LPG in this case), health issues, etc. This study will help understand the difference in the cooking practices and people’s outlook in two regions and so these sampling sites were selected. An effort has been made in this study to understand the spatial variation of carbonaceous aerosols (organic carbon, OC and elemental carbon, EC) and water-soluble inorganic constituents (WSIC) in both the villages using biomass (dung cake or fuelwood) and LPG as the fuel for cooking. The WSIC included major cations: Na+ (sodium), NH4+ (ammonium), K+ (potassium), Mg2+ (magnesium) & Ca2+ (calcium) and major anions: F- (fluoride), Cl- (chloride), SO42- (sulphate), NO3- (nitrate) & PO43- (phosphate). In order to notice the socio-economic impact, a questionnaire survey of the residents of the house under experimentation was conducted which has been summarized in this paper.
Methodology
Sampling Sites
We selected two sampling sites for this study (Fig. 1) viz. i). Baggi Village, located along the coordinates 31.48°N, 76.58°E in Hamirpur district of Himachal Pradesh state and ii). Budhwada village, located along the coordinates 22.75°N, 77.72°E in Hoshangabad district of Madhya Pradesh state in India. These two different sites in two states were selected based on their differences in geography, topography, demographics, daily practices and dependence on biomass burning of the population.
Baggi Village
Baggi village is situated in Hamirpur district of Himachal Pradesh state with 34.63 hectares of total geographical area. Baggi has a very small population of 195 people with 89 males and 106 females47. There are about 42 houses in Baggi village. This village is situated at an altitude of 375m above sea level. This village is in a close proximity to the Sheer Khadd River Basin, which is seasonally filled.
Budhwada Village
Budhwada Village is a gram panchayat which belongs to Narmadapuram Division in Madhya Pradesh with the total population of 1040 (53% Male & 47% Female) and number of houses, 178. Hoshangabad is nearest town to Budhwada which is approximately 4 km away47. Total geographical area of Budhwada village is 4 km2. It is situated in the central Narmada Valley and lies in the Satpura Plateu’s northern fringe48. The village has a Security Paper Mill and Vardhman textile Industry at a distance of 4km and 13km respectively. This village has minimal traffic flow. It is surrounded by farms of wheat and paddy.
Every household in both the villages had cows and buffaloes to meet their needs of milk, cow dung cake and for ploughing activities and also had the availability of both traditional chullah and LPG (through Pradhan Mantri Ujjawala Yojana, PMUY or state government subsidies). Four households were selected from both the villages. The basis of selection was the different construction styles of the kitchen. Since only indoor air pollution is being considered, all the selected houses contained chullah inside their houses only.
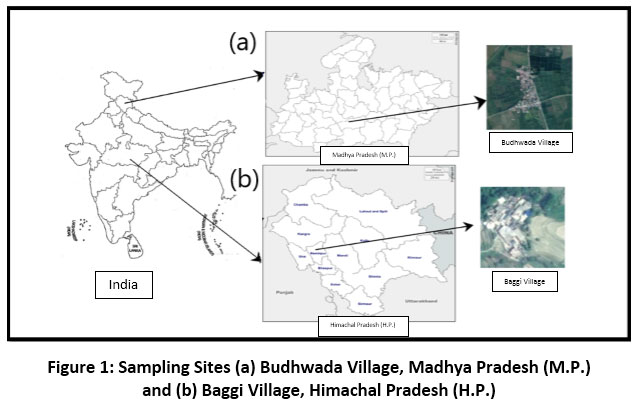 |
Figure 1: Sampling Sites (a) Budhwada Village, Madhya Pradesh (M.P.) and (b) Baggi Village, Himachal Pradesh (H.P.) Click here to view Figure |
The selected houses were having a separate kitchen area. The specifications of these houses are given below:
Table 1: Specifications of the Selected Houses.
|
House Code |
Area of Kitchen |
No. of Ventilators |
Height of the roof |
Material of roof |
|
A |
100 sq ft |
3 |
13 feet |
Red mud (kavelu) |
|
B |
70 sq ft |
0 |
12 feet |
Red mud (kavelu) |
|
C |
250 sq ft |
1 |
17 feet |
Red mud (kavelu) |
|
D |
250 sq ft |
1 |
17 feet |
Red mud (kavelu) |
|
E |
300 sq ft |
2 |
15 feet |
Black Slate |
|
F |
150 sq ft |
1 |
15 feet |
Black Slate |
|
G |
100 sq ft |
2 |
15 feet |
Black Slate |
|
H |
175 sq ft |
1 |
15 feet |
Black Slate |
Methodology for Sample Collection
Sampling Description
Sampling was carried out in the winter season of December 2016 for two days in each house. The samples collected were of four types namely, (i) morning (M) & (ii) evening (Ev) which are the cooking times and the non-cooking times, (iii) afternoon (Af) & night (N) for three hours each using a low volume sampler of 15 liters per minute (LPM) flow rate. However, night-time samples were not collected at Baggi (H.P.) site because of the early bedtime of the residents. During sampling periods, the women who work in the kitchen were advised to first meal on Chullah and second meal on LPG. The ambient temperature during the sampling period ranged between 8-12? Celsius and no extreme weather events occurred at that time. A general survey of the people of each house was also carried out which included questions related to their houses, surroundings, cooking habits, techniques and air pollution awareness. There were a few limitations to this sampling. The residents of the households were not able to guarantee constant cooperation for the sampling because of their issues of commitment and personal space intrusion. Also, it was very difficult to get consent of the household leader for collecting samples with switching over fuels. This limits the number of samples for this study. As the sampling was done by the author herself, the data was collected with utmost care in all the steps so that any kind of error can be minimized, keeping most of the parameters constant e.g. sample collection height and distance from the cookstove, time of sampling, etc.
General Characteristics of the Rural Households
All the selected households for the study had an indoor and separate kitchen. All the kitchens had both traditional cook stoves i.e. Chullah and LPG. All the houses can be categorized to be semi-pucca, in which the walls are made up of cement/mud and bricks but the slanting roof is made up of kavelu (natural clay tiles) or slate tiles, which keeps the house comparatively cooler and provide ventilation. As conveyed by the questionnaires, usually these household residents cooked only two meals a day, in the morning and in the evening. In both the villages, the residents cooked the morning meal on Chullah and evening meal on LPG. Since the study was carried out in winters, residents keep themselves warm by igniting Chullah, in which they may or may not cook the meal. Solid biomass and clean fuels were used by the residents in Chullah and LPG respectively. In Chullah, all the households were observed to use mixed solid biomass fuel containing wood and cow dung. According to the residents of Budhwada (M.P.), they used wood only to ignite the fire and for the rest of the cooking they used dried cow dung whereas in Baggi (H.P.), dung cake was rarely used and whole meal was cooking on wood and dried plant debris.
Chemical Analysis of Aerosols
The sampling set was assembled in the kitchen of each household. Aerosol samples were collected on Whatmann Quartz fiber filter paper (47mm diameter). These samples were collected from the kitchen of each household, through a vacuum suction pump (flow-rate 15 LPM; PDF1-15, Promivac Engineers, New Delhi, India) which was kept at a distance of 7-9 feet from the stove and at a consistent height of 4-5 feet which comes under the breathing zone. After removing all the human-induced pollution (dried leaves, twigs, etc.), 56 samples were acquired. The quartz filter was baked at 550 °C in a muffle furnace for 5 hours and then kept in a desiccator for 48 hours after it is cooled. Finally, the filter membranes were wrapped up in the aluminum foil and kept in separate petri plates to protect them from any other contamination during use. After sampling the filters were saved in the cold room at −20 °C. The carbonaceous aerosol contents i.e. Organic Carbon (OC) and Elemental Carbon (EC) on the quartz fiber filter were measured by IMPROVE (Interagency Monitoring of Protected Visual Environments) thermal/optical reflectance (TOR) protocol on thermal/optical carbon analyzer Model 2001A (American Desert Research Institute, NV, USA). Because of the volatile nature of volatile organic compounds (VOCs), there was negligible probability that it would interfere with the OC and EC concentrations in the collected aerosol samples. The water extracts of the aerosol sample filters were analyzed for major cations (Na+, NH4+, K+, Ca2+, Mg2+) and anions (F-, Cl-, NO3-, SO42-) by ion chromatography (Metrohm 883 Basic IC Plus).
Results and Discussions
Variation of EC and OC in Households
Time-Wise Variation
All the houses were monitored to record the temporal variation in a day to account for cooking periods in morning (M) and evening (Ev) and non-cooking periods in afternoon (Af) and night (N). Fig. 2 represents temporal variation of OC and EC taken as an average for all the houses at both the sites, which clearly depicts that the concentration of both OC and EC peaks in cooking period (i.e. M and Ev). This happens because of the burning of fuel taking place to cook food, which is either biomass or LPG, which releases carbonaceous aerosols into the ambient atmosphere. In Budhwada (M.P.), the high concentration of night-time sample is because wood was being burnt for heating purposes as it was winters. Also, in all the houses, few of the cooking time samples (M, Ev) are having low concentrations which is because LPG is being used for cooking. The exceptionally high concentration of the M sample of House H of Baggi (H.P.) may be due to the use of dried leaves and agricultural residue49 along with the fuel wood for cooking and also because one of the residents of House H was a frequent smoker.
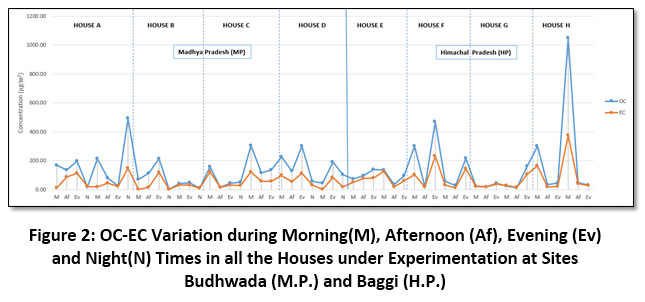 |
Figure 2: OC-EC Variation during Morning(M), Afternoon (Af), Evening (Ev) and Night(N) Times in all the Houses under Experimentation at Sites Budhwada (M.P.) and Baggi (H.P.) Click here to view Figure |
The comparison of concentrations of OC and EC for Morning (M), Afternoon (Af), Evening (Ev) and Night (N) times of the day (Fig. 3), revealed that both OC and EC are higher in cooking times (M & Ev). In Baggi (H.P.), the morning’s average OC and EC concentrations are higher at 246.4 µg/m3 and 112.9 µg/m3 respectively than that of the evening at 151.4 µg/m3 and 89.8 µg/m3 respectively. The possible reason for this may be that the quantity of meal cooked in the morning time is more than that of the evening as both breakfast and lunch were cooked in the morning and only dinner in the evening. Although in Budhwada (M.P.), the average morning concentrations of OC and EC viz. 153.6 µg/m3 and 51.1 µg/m3 respectively were quite comparable with the evening concentrations of OC and EC at 144.7 µg/m3 and 70.9 µg/m3 respectively. In Budhwada (M.P.) too, the quantity of meals cooked in morning is more than that in the evening, but due to winter season, after the meals are cooked the residents continue the fire with wood for heating purposes. The EC concentrations are higher in evening time than in the morning time as wood was being used in the evening time for heating purposes and dung cake in the morning for cooking50. Clearly, in afternoon times when cooking is not taking place, concentrations of OC and EC in Budhwada (M.P.) was decreased only by 44.6% and 33.8% respectively whereas in Baggi (H.P.) the concentrations of OC and EC for the same were decreased significantly by 85.1% and 75.9% respectively. The probable reason behind this can be the better ventilation in Baggi (H.P.)51,52. When the overall average values of OC and EC for both the rural sites were compared with an urban site, a huge difference was noticed. For an urban site like Delhi, Sharma et al. (2014) found comparatively much lower values of OC and EC at 26.7 ± 9.2 µg/m3 and 6.1 ± 3.9 µg/m3 respectively53.
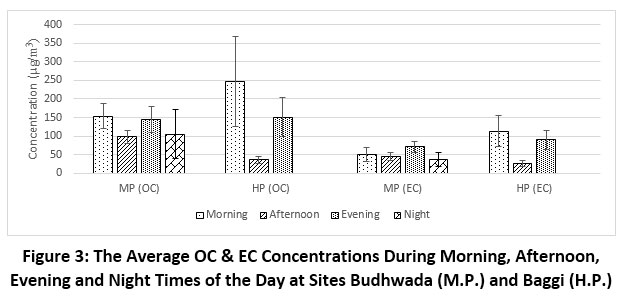 |
Figure 3: The Average OC & EC Concentrations During Morning, Afternoon, Evening and Night Times of the Day at Sites Budhwada (M.P.) and Baggi (H.P.) Click here to view Figure |
House Wise Variation
Budhwada Village (M.P.)
At Budhwada, all the houses A, B, C & D under experimentation had a separate kitchen with varying ventilation. The roofs of the houses in MP are sloping gable type and are constructed with locally available tiles called kabelu which are made up of natural clay as described earlier. The average OC and EC concentrations from the site Budhwada (M.P.) were 124.34 ± 34.68 µg/m3 and 55.51 ± 15.51 µg/m3 respectively.
In House A, the OC and EC were found in the range of 23.24-494.57 µg/m3 and 12.44 – 147.29 µg/m3 respectively with the respective average concentrations at 166.6 ± 50.29 µg/m3 and 58.83 ± 16.84 µg/m3 (Fig. 4). The average OC concentration was highest in House A among all four houses. The members of the family in house A were highest as compared to that in other houses and hence greater amounts of meal was prepared everyday. In House B, the ranges of OC and EC concentrations varied widely from 2.77 – 213.28 µg/m3 and 2.27 – 119.06 µg/m3 respectively and their respective average concentrations were 68.31 ± 25.56 µg/m3 and 34.76 ± 15.93 µg/m3. This house had the least average concentrations of OC and EC because of the least members in the family and biomass was not burnt for heating purposes. In house C, the range of OC obtained was 15.85 – 304.79 µg/m3 with its average concentration of 112.12 ± 30.40 µg/m3 and the range of EC was 15.46 – 122.24 µg/m3 and its average concentration was 62.03 ± 15.26 µg/m3. In house D, the range of OC was found to be 44.82 – 300.51 µg/m3 and its average concentration as 150.31 ± 32.73 µg/m3 and the range of EC was 18.96 – 111.81 µg/m3. The average concentration of EC was highest in House D among all houses in MP at 66.40 ± 13.83 µg/m3 because of the burning of the fuel wood for heating purposes after the cooking. The moisture content in fuelwood is lesser as compared to dung cake, hence fuelwood contributes higher emissions of EC50,54.
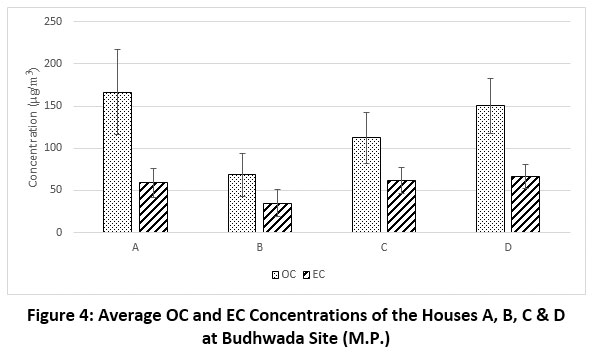 |
Figure 4: Average OC and EC Concentrations of the Houses A, B, C & D at Budhwada Site (M.P.) Click here to view Figure |
Baggi Village (H.P.)
At Baggi site, the walls of the selected houses E, F, G & H are made up of bricks and mud, and the hip-roofs are made up of slate tiles. For ventilation, along with the windows there is a narrow slit between roof and the wall for the smoke to vent out. The average OC and EC concentrations from this site are 105.26 ± 35.63 µg/m3 and 62.98 ± 20.75 µg/m3 respectively.
In house E, the range of OC and EC concentrations were 34.59 – 140.55 µg/m3 and 19.63 – 124.49 µg/m3 respectively. The average concentrations of OC and EC in this house were 96.24 ± 14.86 µg/m3 and 69.43 ± 12.94 µg/m3 respectively (Fig. 5). This house had maximum ventilation (4 windows) out of all the houses but the residents kept two windows closed always. House F had the broadest range of OC and EC concentrations from 20.04 – 471.06 µg/m3 and 11.94 – 232.10 µg/m3 respectively. The average concentrations of OC and EC in this house were highest at 182.98 ± 67.48 µg/m3 and 90.11± 32.54 µg/m3 respectively. House G had the lowest average OC and EC concentrations out of all the houses at this site at 49.25 ± 13.05 µg/m3 and 37.45 ± 12.79 µg/m3 respectively. The range of OC and EC obtained were 15.92–162.10 µg/m3 and 12.90–106.51 µg/m3 respectively. This house had Chullah, LPG as well as induction cook stove for cooking purposes, hence biomass burning was least in this house and so are the emissions. Among all the houses, house H had the average concentrations of OC and EC at 92.56 ± 47.14 µg/m3 and 54.93 ± 24.72 µg/m3 respectively. One of the residents of the house used to smoke 10-12 cigarettes in a day, which can be an additional factor contributing to the high concentrations of OC and EC along with biomass burning.
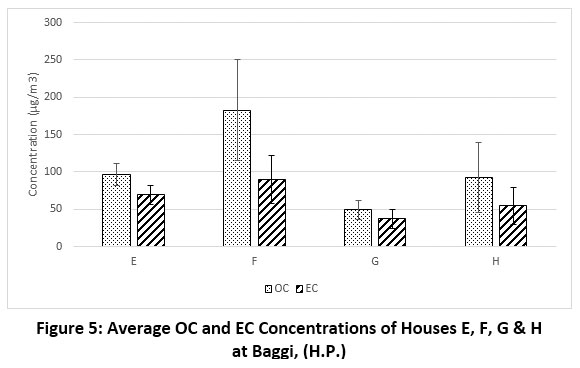 |
Figure 5: Average OC and EC Concentrations of Houses E, F, G & H at Baggi, (H.P.) Click here to view Figure |
Fuel Wise Variation
At both the sites, OC and EC concentrations were studied during cooking times when either biomass (fuelwood/dung cake) or LPG is used and during non-cooking times when no fuel is burning in the ambient indoor environment.
As given in Fig. 6, at Budhwada (M.P.), the biomass used for cooking was dung cake. The average concentrations of OC and EC when cooking was done using dung cake were 206.10 ± 33.99 µg/m3 and 76.55 ± 13.77 µg/m3 respectively and their respective ranges were 40.24–494.57 µg/m3 and 12.44–147.29 µg/m3. When LPG was used the average concentrations of OC and EC were 90.39 ± 29.81 µg/m3 and 50.84 ± 15.14 µg/m3 and their ranges were 24.01–198.92 µg/m3 and 21.29–114.33 µg/m3 respectively. The OC and EC concentrations were decreased by 56.14% and 33.57% respectively when LPG was used as compared to the dung cake. Also, the median value of OC showed a decrease from 213.28 µg/m3 for dung cake to 92.02 µg/m3 for LPG use and the decrease for EC was from 98.39 µg/m3 for dung cake to 44.14 µg/m3 for LPG. It was found that even when no cooking is taking place and neither of the fuel is burning, significant concentrations of the carbonaceous aerosols are sustained in the ambient indoor environment. During this time, the average concentrations of OC and EC were 67.26 ± 15.80 µg/m3 and 33.39 ± 7.91 µg/m3 respectively. The OC and EC concentrations were respectively lying in the range 2.77–134.65 µg/m3 and 2.27–86.33 µg/m3 when no fuel burnt. Although, there was a huge decrease in the OC and EC concentrations, i.e. by 67.36% and 56.38% respectively when dung cake usage was compared with no fuel burning and by 25.59% and 34.33% respectively when LPG usage was compared with no fuel burning.
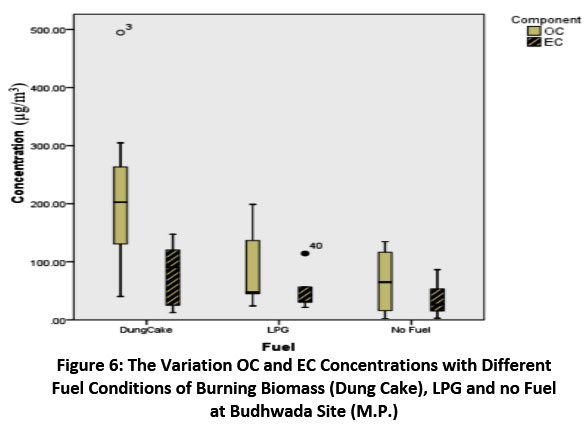 |
Figure 6: The Variation OC and EC Concentrations with Different Fuel Conditions of Burning Biomass (Dung Cake), LPG and no Fuel at Budhwada Site (M.P.) Click here to view Figure |
At the site Baggi (H.P.), the fuelwood of the locally found tree called beul (Grewia optiva) along with other tree-fallouts, dried leaves, twigs etc. is used for cooking and heating purposes. As given in Fig. 7, the average OC and EC concentrations when wood was used for cooking in the traditional chullah, were 164.18 ± 34.11 µg/m3 and 94.75 ± 16.14 µg/m3 respectively. Their respective ranges were 32.53–471.06 µg/m3 and 22.92–232.09 µg/m3. With LPG usage, OC and EC concentrations were significantly reduced by 76.69% and 70.10% with values 38.27 ± 3.19 µg/m3 and 28.32 ± 4.38 µg/m3 respectively. The range of OC and EC when LPG was used were 29.23–48.18 µg/m3 and 17.29–40.22 µg/m3 respectively. The median values for OC & EC showed a significant reduction from wood burning to LPG use, which for OC was from 136.98 µg/m3 to 39.8 µg/m3 respectively and for EC was from 80.56 µg/m3 to 34.45 µg/m3 respectively. After applying the Student’s t-test, OC & EC both were found to be significantly different at p<0.05 for fuelwood burning and LPG use. During non-cooking time, the average OC and EC concentrations at this site were found to be the lowest at 21.60 ± 2.07 µg/m3 and 16.63 ± 1.76 µg/m3 respectively. Also, a comparatively narrower range of OC of 15.92-28.82 µg/m3 and EC of 11.94–22.92 µg/m3 was found. The OC and EC concentrations were greatly reduced by 86.84% and 82.44% respectively when compared with wood use and by 43.54% and 41.28% respectively when compared with LPG use.
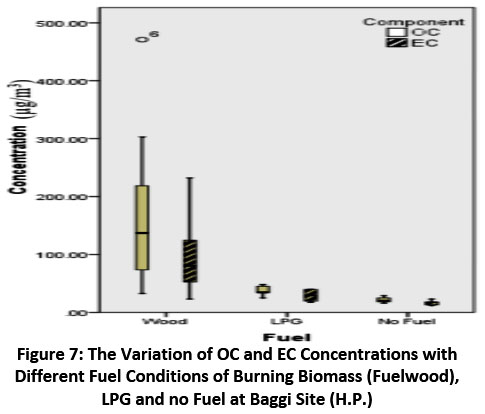 |
Figure 7: The Variation of OC and EC Concentrations with Different Fuel Conditions of Burning Biomass (Fuelwood), LPG and no Fuel at Baggi Site (H.P.) Click here to view Figure |
Characterization of Carbonaceous Aerosols
In this study, the overall range of OC/EC ratio in Budhwada (M.P.) was found to be 1.01–13.54 with an average value of 2.89 ± 0.56 and for Baggi (H.P.), the range obtained was 1.03–2.92 with an average value of 1.56 ± 0.10. For Budhwada (M.P.), the OC – EC correlation was not strong (r2 = 0.6568) but for site HP, there was a strong correlation with r2 = 0.9306 between OC and EC (Fig. 8). A good correlation between OC and EC is implying that they are being emitted from the common source55, which is biomass (fuelwood/dung cake) in this case. On the other hand, when the correlation between OC and EC is poor then this is indicating the secondary organic aerosol formation for the VOC’s gas to particle conversion in the atmosphere by a photochemical reaction53. The individual ranges of the fuel used in Budhwada (M.P.) and Baggi (H.P.) sites are given in Table 2. The highest value of OC/EC ratio was observed for the dung cake at 4.08 ± 1.09 (Table 2) following which was the fuelwood at 1.67 ± 0.13. The OC/EC ratio for the LPG was varying only slightly for Budhwada (M.P.) and Baggi (H.P.) site with values 1.65 ± 0.19 and 1.45 ± 0.16 respectively. The median values of OC/EC for both sites were decreased when fuel changed from biomass to LPG. For Budhwada (M.P.), the median value of OC/EC ratio for using dung cake as fuel was 2.41 which reduced to 1.56 with the use of LPG. Similarly, for Baggi (H.P.), the median value of 1.55 for wood reduced to 1.19 for LPG. After applying the t-test, a significant difference was found (at p<0.05) in the OC/EC ratio of dung cake and LPG at Budhwada (M.P.). Also, during non-cooking time, Budhwada (M.P.) had an average OC/EC ratio of 1.56 ± 0.15 and the same for Baggi (H.P.) was 1.38 ± 0.23.
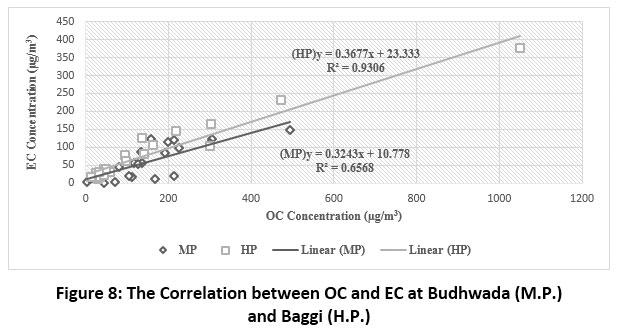 |
Figure 8: The Correlation between OC and EC at Budhwada (M.P.) and Baggi (H.P.) Click here to view Figure |
The carbonaceous species (OC and EC) and K+ ion concentrations are significantly enhanced by the emissions from biomass burning and thus the K+/OC ratio and K+/EC ratio can be used as its markers56. In this study, the K+/OC ratio (Table 2) was obtained in the range 0.01-0.085 with an average of 0.033±0.009 for dung cake in Budhwada, M.P. and 0.010-0.100 with an average value of 0.051±0.007 for fuelwood in Baggi, H.P. Also, the median value of K+/EC ratio was reduced from 0.06 for dung cake to 0.02 for LPG use in Budhwada (M.P.) which remained comparable in case of Baggi (H.P.) Ram and Sarin (2010, 2011) and Rengarajan et al. (2007) obtained almost similar range from 0.02-0.13 for K+/OC ratio for biomass burning56,57,58. K+/OC was found in the range 0.04-0.13 for agricultural waste burning by Andreae and Merlet (2001)59. The K+/EC ratio was obtained in the range from 0.014 to 0.793 (average value=0.167±0.086) for dung cake in Budhwada, M.P. which is going well with the range (0.20-0.69) obtained by Andreae (1983) and Ram and Sarin (2010) for biomass burning. For fuelwood at Baggi, H.P. the range obtained was from 0.028 to 0.195 (average value=0.083±0.013)57,60.
Table 2: Various Ratios of Different Fuels at Budhwada M.P. and Baggi H.P.
|
|
Budhwada, M.P. (n=32) |
Baggi, H.P. (n=24) |
|||||||
|
|
Biomass (Dung Cake) |
LPG |
Biomass (Wood) |
LPG |
|||||
|
|
Average |
Range |
Average |
Range |
Average |
Range |
Average |
Range |
|
|
OC (µg/m3) |
206.10±33.99 |
40.24–494.57 |
90.39±29.81 |
24.01–198.92 |
164.18±34.11 |
32.53–471.06 |
38.27±3.19 |
29.23–48.18 |
|
|
EC (µg/m3) |
76.55±13.77 |
12.44–147.29 |
50.84±15.14 |
21.29–114.33 |
94.75±16.14 |
22.92–232.09 |
28.32±4.38 |
17.29–40.22 |
|
|
OC/EC |
4.08±1.09 |
1.29 - 13.54 |
1.65±0.19 |
1.12 - 2.41 |
1.67±0.13 |
1.09 - 2.92 |
1.45±0.16 |
1.13 - 1.98 |
|
|
K+/OC |
0.033±0.009 |
0.010-0.085 |
0.019±0.006 |
0.006-0.040 |
0.051±0.007 |
0.010-0.100 |
0.055±0.010 |
0.009-0.084 |
|
|
K+/EC |
0.167±0.086 |
0.014-0.793 |
0.030±0.011 |
0.007-0.069 |
0.083±0.013 |
0.028-0.195 |
0.074±0.014 |
0.013-0.127 |
|
Variation of Major Cations and Anions
The concentrations of major cations (Na+, NH4+, K+, Mg2+, Ca2+) and anions (F-, Cl-, SO42-, NO3-, PO43-) from biomass (dung cake/fuelwood) and LPG from both the sites are summarized in Fig. 9. At Budhwada (M.P.), when dung cake was used for cooking, major ions were observed in the following order :- Ca2+>NH4+>Na+>K+>Mg2+>Cl->SO42->NO3->F->PO43- and when LPG was used the order observed was :- NH4+>Na+>Ca2+>Mg2+>K+>Cl->SO42->NO3->F->PO43-. When dung cake was used the concentration of Ca2+ was highest with its average value of 19.92 ± 12.03 µg/m3 followed by NH4+ at 13.08 ± 5.79 µg/m3. During the use of LPG, the highest concentration was found for NH4+ at 9.68 ± 0.54 µg/m3 followed by Na+ 9.57 ± 0.44 µg/m3. There was a significant decrease in the concentration of K+, Ca2+ and SO42- ions from dung cake to LPG by 67.91%, 76.98% and 51.85% respectively.
At Baggi (H.P.), when wood was used for cooking, the concentration of ions were found in the order :- Na+>K+>Ca2+>Cl->NH4+>Mg2+>F->SO42->PO43- and that when LPG was used :- Na+>Ca2+>K+>Mg2+>NH4+>SO42->Cl->PO43->F-. The highest concentrations during the use of fuelwood as well as LPG was found that of Na+ with quite comparable values of 8.17 ± 0.16 µg/m3 and 8.17 ± 0.23 µg/m3 respectively. Also, it can be observed that there is a significant reduction in K+ ion concentration from wood to LPG by 63.4%. Saxena et al. (2016)50 also found in their study that fuelwood has the highest emission factor of K+ and Na+ whereas dung cake had the highest emission factor for Na+ and Ca2+.
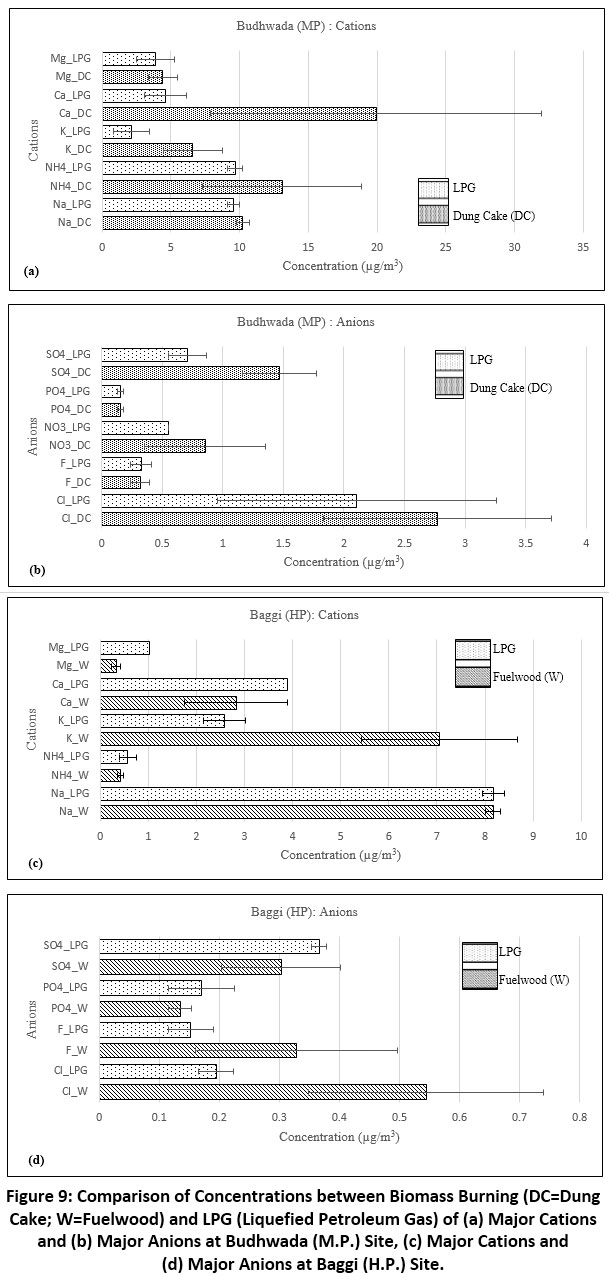 |
Figure 9: Comparison of Concentrations between Biomass Burning (DC=Dung Cake; W=Fuelwood) and LPG (Liquefied Petroleum Gas) of (a) Major Cations and (b) Major Anions at Budhwada (M.P.) Site, (c) Major Cations and (d) Major Anions at Baggi (H.P.) Site. Click here to view Figure |
Questionnaire Survey
The evalutation of various socio-economic parameters such as the number of family members, ventilation, monthly income, time spent by women in the kitchen and in collection of the fuel, health condition and preferable method for cooking was attempted. It was carried out at both the sites in the selected houses by surveying the women of the house. It contained a basic questionnaire related with their basic lifestyle details and cooking practices. The outcomes of the survey has been depicted in Fig. 10.
It can be observed from the responses of the survey that in Budhwada (M.P.), the maximum number of family members are in House A which had the highest average concentration of OC and also the women of the house spends on an average 8 hours everyday in the kitchen and hence getting significantly exposed. It took 1-2 hours for them to collect and prepare the biomass for using everyday. This house was economically better than other other houses. In Baggi (H.P.), house F had the highest average OC and EC concentrations which had very less ventilation and not very good financial condition. In this house the women are spending on an avergae 5 hours everyday in the kitchen and 1 hour finding and preparing the fuel.
In Budhwada (M.P.) people usually kept cows and buffalows to meet their needs of milk and dung cake and the cattle is in the close vicinity of the house whereas in Baggi (H.P.) the fuel used is fuelwood and cattle is also tied far from the house. For the same reason, it can be noticed from Fig. 10 that Budhwada (M.P.) has very high NH4+ concentrations as compared to those in Baggi (H.P.).
In Budhwada (M.P.), the women had almost no awareness about the harmful effects of biomass burning and the resulting air pollution. In Baggi (H.P.) only the women of House G and H had a slight awareness. When asked that which method/fuel is easy and convenient to use for cooking, all the houses agreed for LPG except E and F which found chullah more convenient. But when asked which method/fuel they will prefer to use, only B, F and G houses preferred LPG which was because of the ease in cooking, no danger from fire and no discomfort from the smoke. Although, rest of all the houses wanted to continue cooking on chullah which may be because of the traditional practices they have been following from various generations and the strongly developed taste for the food cooked on chullah, that they were not willing to give up. Also, the solid biomass fuel viz. dung cake and fuelwood are easily available for them at negligible cost.
When assessed for health conditions (in respect of eye irritation, difficulty in breathing, respiratory diseases, skin irritation, cough and dizziness) only houses B and G in Budhwada (M.P.) and Baggi (H.P.) respectively were found with good conditions which eventually had the lowest average OC and EC concentrations. All the other houses has moderate to very poor health conditions. The response of the questionnaire survey is totally satisfying with the fuel stacking theory but indicating a contradiction to the energy ladder theory. Factors such as high initial and recurring cost of LPG, tedious process of application and long waiting time for LPG connection and refill were responsible for the households to continue the use of traditional solid biomass fuel in Budhwada (Madhya Pradesh) despite having the ownership of LPG. Long distance of distributor center and accessibility of modern energy services in tougher hilly terrains are additional factors faced by the rural households of Baggi (Himachal Pradesh) site.
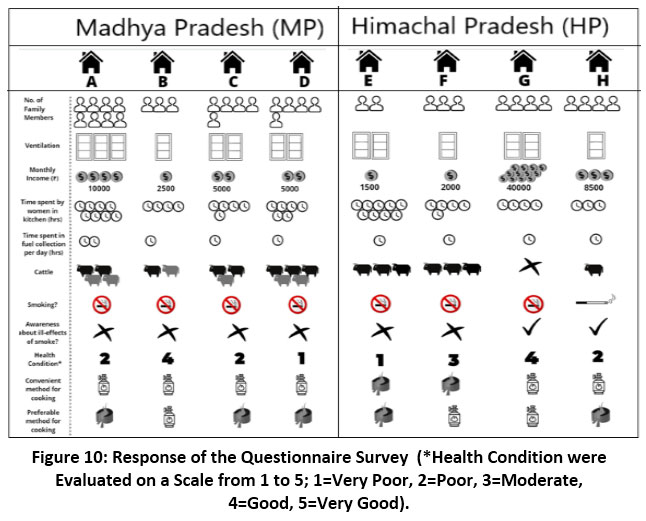 |
Figure 10: Response of the Questionnaire Survey (*Health Condition were evaluated on a Scale from 1 to 5; 1=Very Poor, 2=Poor, 3=Moderate, 4=Good, 5=Very Good). Click here to view Figure |
Conclusion
The chemical analysis of carbonaceous aerosols showed that at Budhwada (M.P.), the average concentrations of OC and EC were decreased by 56.14% and 33.57% respectively when LPG was used in place of dung cake. Similarly, the OC and EC concentrations were reduced by 76.69% and 70.10% with the usage of LPG in place of fuelwood at Baggi (H.P.). The average concentrations of major cations and anions were also reduced remarkably at both the sites including the reduction in K+ indicating lesser emission contributions from biomass and fuelwood. The socio-economic analysis through a questionnaire survey revealed that soft approach is very effective in reducing carbonaceous emissions from the households. The adaptation of soft approaches improves socio-economic indicators and the attitude of people towards environment and health. The exercise can further be elaborated in order to bring out a feasible policy. However, this needs more serious efforts about- (i) spreading awareness in public; (ii) changing the pattern of fuel use; (iii) variation in stove design; (iv) enhancement in the ventilation; and (v) involvement of agencies responsible for good health, energy efficiency, lesser pollution in rural areas.
Acknowledgements
We are grateful to the Council of Scientific and Industrial Research (CSIR) –University Grants Commission (UGC)–Junior Research Fellowship and Senior Research Fellowship being awarded to the author (KV) and to the Department of Science & Technology – Promotion of University Research and Scientific Exellence (DST-PURSE) financial assisstance. We are thankful for the support from Jawaharlal Nehru University, School of Environmental Sciences to make the facilities available to carry out this research. We also want to immensely thank the residents of the selected houses in Madhya Pradesh and Himachal Pradesh for co-operating extensively in this study.
References
- Delgado-Saborit J. M, Aquilina N. J, Meddings C, Baker S, Harrison R. M. Relationship of personal exposure to volatile organic compounds to home, work and fixed site outdoor concentrations. The Science of the Total Environment. 2011; 409(3), 478—488.
CrossRef - Settimo G, Manigrasso M, Avino P. Indoor Air Quality: A Focus on the European Legislation and State-of-the-Art Research in Italy. Atmosphere. 2020; 11(4), 370.
CrossRef - Taylor J, Shrubsole C, Symonds P, Mackenzie I, Davies M. Application of an indoor air pollution metamodel to a spatially-distributed housing stock. Science of The Total Environment. 2019; 667, 390–399.
CrossRef - World Health Organization (WHO). Burden of disease from household air pollution for 2012. 2014.
- Spengler J. D, Chen Q. Indoor air quality factors in designing a healthy building. Annual Review of Energy and the Environment. 2000; 25(1), 567-600.
CrossRef - Colbeck I, Nasir Z. A, Ali Z. The state of indoor air quality in Pakistan—a review. Environmental Science and Pollution Research. 2010;17(6), 1187-1196.
CrossRef - Balakrishnan K, Sambandam S, Ramaswamy P, Mehta S, Smith K. R. Exposure assessment for respirable particulates associated with household fuel use in rural districts of Andhra Pradesh, India. Journal of Exposure Science & Environmental Epidemiology. 2004;14(1), S14-S25.
CrossRef - Barnes D. F, Openshaw K, Smith,K. R. van der Plas R. What makes people cook with improved biomass stoves. A comparative international review of Stove Programs. Energy series. World Bank technical paper. 1994. (No. PB-94-195427/XAB; WORLD BANK TP--242). International Bank for Reconstruction and Development, Washington, DC (United States).
- Reddy A. K, Williams R. H, Johansson T. B. Energy after Rio: prospects and challenges (p. 176). New York, NY: United Nations Development Programme. 1997.
- Solarin S. A, Al-Mulali U, Gan G. G. G, Shahbaz M. The impact of biomass energy consumption on pollution: Evidence from 80 developed and developing countries. Environmental Science and Pollution Research. 2018; 25(23), 22641–22657.
CrossRef - Sen A. Estimates of consumer expenditure and its distribution: Statistical priorities after NSS 55th round. Economic and Political weekly. 2000;4499-4518.
- Bonjour S, Adair-Rohani H, Wolf J, Bruce N. G, Mehta S, Prüss-Ustün A, Smith K. R. Solid fuel use for household cooking: country and regional estimates for 1980–2010. Environmental health perspectives. 2013;121(7), 784-790.
CrossRef - Rohra H, Taneja A. Indoor air quality scenario in India—an outline of household fuel combustion. Atmospheric Environment. 2016;129, 243-255.
CrossRef - Singh A. L, Jamal S. Assessing vulnerability of women to indoor air pollution. Research Journal For Environmental and Earth Sciences. 2012;4(11), 982-89.
- Sharma D, Jain S. Impact of intervention of biomass cookstove technologies and kitchen characteristics on indoor air quality and human exposure in rural settings of India. Environment International. 2019; 123, 240–255.
CrossRef - Iii P, Arden C. Biomass burning and its effects on health. Jornal Brasileiro de Pneumologia. 2004; 30(3), 193–193.
CrossRef - Deepthi Y, Shiva Nagendra S. M, Gummadi S. N. Characteristics of indoor air pollution and estimation of respiratory dosage under varied fuel-type and kitchen-type in the rural areas of Telangana state in India. Science of The Total Environment. 2019; 650, 616–625.
CrossRef - Clark M. L, Reynolds S. J, Burch J. B, Conway S, Bachand A. M, Peel J. L. Indoor air pollution, cookstove quality, and housing characteristics in two Honduran communities. Environmental Research. 2010; 110(1), 12–18.
CrossRef - Fullerton D. G, Bruce N, Gordon S. B. Indoor air pollution from biomass fuel smoke is a major health concern in the developing world. Transactions of the Royal Society of Tropical Medicine and Hygiene. 2008;102(9), 843-851.
CrossRef - Leung D. Y. C. Outdoor-indoor air pollution in urban environment: Challenges and opportunity. Frontiers in Environmental Science. 2015; 2.
CrossRef - Tsakas M. P, Siskos A. P, Siskos P. Indoor Air Pollutants and the Impact on Human Health. Chemistry, Emission Control, Radioactive Pollution and Indoor Air Quality. 2011.
- Ezzati M, Saleh H, Kammen D. M. The contributions of emissions and spatial microenvironments to exposure to indoor air pollution from biomass combustion in Kenya. Environmental health perspectives. 2000;108(9), 833-839.
CrossRef - Zhang J, Smith, K. R. Indoor air pollution: a global health concern. British medical bulletin. 2003; 68(1), 209-225.
CrossRef - Saud Dr. T, Saxena M, Yadav S, Mandal T, Gadi R, Singh D, Sharma S. K. Spatial Variation of Chemical Constituents from the Burning of Commonly used Biomass Fuels in Rural Areas of the Indo-Gangetic Plain (IGP), India. Atmospheric Environment. 2013; 71.
CrossRef - Jagger P, Pedit J, Bittner A, Hamrick L, Phwandapwhanda T, Jumbe C. Fuel efficiency and air pollutant concentrations of wood-burning improved cookstoves in Malawi: implications for scaling-up cookstove programs. Energy for Sustainable Development. 2017; 41, 112-120.
CrossRef - Aggarwal A. L, Raiyani C. V, Patel P. D, Shah P. G, Chatterjee S. K. Assessment of exposure to benzo (a) pyrene in air for various population groups in Ahmedabad. Atmospheric Environment (1967). 1982;16(4), 867-870.
CrossRef - Ellegård A. Cooking fuel smoke and respiratory symptoms among women in low-income areas in Maputo. Environmental health perspectives. 1996;104(9), 980-985.
CrossRef - Pandey M. R, Neupane R. P, Gautam A, Shrestha I. B. The effectiveness of smokeless stoves in reducing indoor air pollution in a rural hill region of Nepal. Mountain Research and Development. 1990;313-320.
CrossRef - Reid H. F, Smith K. R, Sherchand B. Indoor smoke exposures from traditional and improved cookstoves: comparisons among rural Nepali women. Mountain research and development. 1986;293-303.
CrossRef - Smith K. R, Aggarwal A. L, Dave R. M. Air pollution and rural biomass fuels in developing countries: a pilot village study in India and implications for research and policy. Atmospheric Environment (1967). 1983;17(11), 2343-2362.
CrossRef - Ahmed K, Awe Y. A, Barnes D. F, Cropper M. L, Kojima M. Environmental health and traditional fuel use in Guatemala. The World Bank. 2005.
CrossRef - Rehman I. H, Ahmed T, Praveen P. S, Kar A, Ramanathan V. Black carbon emissions from biomass and fossil fuels in rural India. Atmospheric Chemistry & Physics Discussions. 2011;11(4).
CrossRef - Venkataraman C, Sagar A. D, Habib G, Lam N, Smith K. R. The Indian national initiative for advanced biomass cookstoves: the benefits of clean combustion. Energy for Sustainable Development. 2010; 14(2), 63-72.
CrossRef - Gelencsér A. Carbonaceous Aerosol. Springer Netherlands. 2004.
- Andreae M. O, Rosenfeld D, Artaxo P, Costa A. A, Frank G. P, Longo K. M, Silva-Dias M. a. F. Smoking rain clouds over the Amazon. Science (New York, N.Y.). 2004; 303(5662), 1337–1342.
CrossRef - Bond T. C, Bergstrom R. W. Light Absorption by Carbonaceous Particles: An Investigative Review. Aerosol Science and Technology. 2006; 40(1), 27–67.
CrossRef - Ramanathan V, Carmichael G. Global and regional climate changes due to black carbon. Nature Geoscience. 2008; 1(4), 221–227.
CrossRef - IPCC. Mitigation of Climate Change, Climate Change. Fifth Assessment Report of the Intergovernmental Panel on Climate Change. (https://www.ipcc.ch/pdf/assessment-report/ar5/wg3/ipcc_wg3_ar5_full.pdf). 2014.
- Committee to Approaches to Climate Change Adaptation. Approaches to Climate Change Adaptation. November. (https://www.env.go.jp/en/earth/cc/adapt_guide/pdf/approaches_to_adaptation_en.pdf). 2010.
- Song C, Bilsborrow R, Jagger P, Zhang Q, Chen X, & Huang Q. Rural household energy use and its determinants in China: how important are influences of payment for ecosystem services vs. other factors?. Ecological Economics. 2018; 145, 148-159.
CrossRef - Hosier R & Dowd J. Household Fuel Choice in Zimbabwe: An empirical test of the energy ladder hypothesis. Resource and Energy Journal. 1987; 9: 347-361.
CrossRef - Muazu N. B, Ogujiuba K. O. Analysis of dynamics of domestic fuelwood energy consumption in Nigeria: Is fuel stacking theory apt. Journal of Science Technology and Education. 2020; 8(1), 302-317.
- Darazo A. A. Babayo M. Determination of Fuel stacking behavior among Households in Bauchi Metropolis. The Business and Management Review. 2016; 7(3):84-97.
- Masera Saalkamp B, Kammen D. From linear Fuel Switching to Multi Cooking Strategies: A Critique and Alternative to the Energy Ladder Model. A world development. 2000; 28: 2083-103.
CrossRef - Elias R. J, Victor D. G. Energy Transition in the Developing Countries: Review of Concept and Literature Working Paper. 2005; 40.
- Van der Kroon, Bianca R B, Pieter J H van Beukering. "The Energy Ladder: Theoretical Myth or Empirical Truth? Results from a Meta-Analysis." Renewable and Sustainable Energy Reviews. 2013; 20: 504-513.
CrossRef - Census 2011. House-listing and Housing Census Data, New Delhi. Office of the Registrar General & Census Commissioner, India Ministry of Home Affairs, Government of India. 2011.
- Chandramouli C, General R. Census of India 2011. Provisional Population Totals. New Delhi: Government of India. 2011;409-413.
- Parashar D. C, Gadi R, Mandal T. K, Mitra A. P. Carbonaceous aerosol emissions from India. Atmospheric Environment. 2005;39(40), 7861-7871.
CrossRef - Saxena M, Sharma S. K, Tomar N, Ghayas H, Sen A, Garhwal R. S, Gupta N.C, Mandal T. K. Residential biomass burning emissions over northwestern Himalayan region of India: chemical characterization and budget estimation. Aerosol and air quality research. 2016;16(3), 504-518.
CrossRef - Bruce N, Perez-Padilla R, Albalak R. Indoor air pollution in developing countries: a major environmental and public health challenge. Bulletin of the World Health organization. 2000;78, 1078-1092.
- Smith K.R. Biofuels, Air Pollution, and Health. New York: Plenum. 1987.
CrossRef - Sharma S. K, Mandal T. K, Saxen, M, Sharma A, Datta A, Saud T. Variation of OC, EC, WSIC and trace metals of PM10 in Delhi, India. Journal of Atmospheric and Solar-Terrestrial Physics. 2014;113, 10-22.
CrossRef - Gadi R, Sarkar A. K, Gera B. S, Mitra A. P, Parashar D. C. Chemical composition of atmospheric aerosols at New Delhi. 2002.
- Salma I, Chi X, Maenhaut W. Elemental and organic carbon in urban canyon and background environments in Budapest, Hungary. Atmospheric Environment. 2004;38(1), 27-36.
CrossRef - Ram K, Sarin M. M. Day–night variability of EC, OC, WSOC and inorganic ions in urban environment of Indo-Gangetic Plain: implications to secondary aerosol formation. Atmospheric Environment. 2011;45(2), 460-468.
CrossRef - Ram K, Sarin M. M. Spatio-temporal variability in atmospheric abundances of EC, OC and WSOC over Northern India. Journal of Aerosol Science. 2010;41(1), 88-98.
CrossRef - Rengarajan R, Sarin M. M, Sudheer A. K. Carbonaceous and inorganic species in atmospheric aerosols during wintertime over urban and high?altitude sites in North India. Journal of Geophysical Research. 2007;Atmospheres, 112(D21).
CrossRef - Andreae M. O, Merlet P. Emission of trace gases and aerosols from biomass burning. Global biogeochemical cycles. 2001;15(4), 955-966.
CrossRef - Andreae M. O. Soot carbon and excess fine potassium: long-range transport of combustion-derived aerosols. Science. 1983;220(4602), 1148-1151.
CrossRef


