Assessment of Water Quality Parameters and Aquatic Insect Assemblages in Dalvoy Lake, Mysore District, Karnataka, India.
Hebbal Rajendra Abhilash
 and Malliah Mahadevaswamy
*
and Malliah Mahadevaswamy
*
http://dx.doi.org/10.12944/CWE.16.2.17
Copy the following to cite this article:
Abhilash H. R, Mahadevaswamy M. Assessment of Water Quality Parameters and Aquatic Insect Assemblages in Dalvoy Lake, Mysore District, Karnataka, India. Curr World Environ 2021;16(2). DOI:http://dx.doi.org/10.12944/CWE.16.2.17
Copy the following to cite this URL:
Abhilash H. R, Mahadevaswamy M. Assessment of Water Quality Parameters and Aquatic Insect Assemblages in Dalvoy Lake, Mysore District, Karnataka, India. Curr World Environ 2021;16(2). Available From : https://bit.ly/3maXHMi
Download article (pdf) Citation Manager Publish History

Introduction
Freshwater resources are of great importance to man and other organisms of the environment for sustenance of life and maintaining the balance in the nature.1 About one-third of the world's fresh water requirement is met by naturally occurring surface waters in rivers, streams, lakes, and ponds.2 Due to the limited availability of freshwater on earth, it has become imperative to assess its quality as much of the world’s freshwater resources are becoming deteriorated by the influence of anthropogenic activities.3 According to The Millennium Ecosystem Assessment report, freshwater ecosystems are suspected to have the highest number of species threatened with extinction as a result of climate change.4
Countries across the globe are facing the challenge of managing the increasing risks and adverse effects of temperature change and urbanization. Among the various freshwater habitats, ponds, reservoirs and lakes in urbanized areas are significantly affected by anthropogenic activity.5 Urbanization alone puts greater pressure on freshwater resources as more people reside in confined landscapes by converting the natural terrain into water-impermeable lands, diminishing accessible freshwater resources.6 The watershed of the lakes in urban setup thus tend to emphasize the environmental problems affecting the metropolitan areas, by collecting and accumulating large amount of nutrients and pollutants.7
Water quality monitoring assists in identifying and managing pollution conditions, as well as ensuring the effectiveness of management programmes.8 The use of physico-chemical characteristics and aquatic macro invertebrates are popularly considered worldwide for monitoring the health status of aquatic ecosystems. Among fresh water macro invertebrates aquatic insects are the most numerous and diverse. As they spend all or significant part of their life cycle in the water, they can serve as valuable indicators of the health of water bodies.9 Different aquatic insect species have different habitat requirements and pollution tolerance. The presence of tolerant species or absence of sensitive taxa can be used to assess the quality of water.10 Several investigations have been conducted to explore the use of aquatic insects as bio-monitoring tools for assessing water quality.11,12,13
Mysore is a well-known tourist destination in India, located at the foot of the Chamundi Hills in the southern state of Karnataka. The city is adorned with many small and medium-sized lakes. Among the popular lakes are Kukkarahalli Lake, Devanoor Lake, Lingambudi Lake, Dalvoy Lake, and Karanji Lake.14 Several water bodies in and around Mysore have been subjected to various forms of environmental degradation as a consequence of rapid population growth, increasing industrialization, and urban sprawl.15 The water quality parameters of some of these lakes have been investigated by several workers.16,17 Studies on the population dynamics of rotifers and the water quality index (WQI) of four major lakes in Mysore city revealed that the rotifers at Dalvoy Lake were stressed, and the lake had a high WQI.18 In another study abundance of zooplanktons, as well as the physico-chemical characteristics of the same lake, was investigated, and it was shown that the abundance of zooplanktons was unusually high indicating the pollution status of the water body.19 Most of the studies at Dalvoy were restricted only to the planktons. Studies pertaining to macro-invertebrates diversity in the lake water were lacking. Therefore, in line with this significant lacuna, the present study is designed to thoroughly investigate the composition of aquatic insects and the physico-chemical properties of Dalvoy Lake. In addition, various biotic indices from aquatic insect assemblage and water quality index (WQI) from physico-chemical variables will be computed to determine the overall health of the water body.
Materials and Methods
Study Area
Dalvoy Lake is located 5 km south of Mysore district, Karnataka state India (76°65’72.29” E latitude, 12°25’17.81” N, longitude and 707.1m amsl). The water spread area of lake is 133.43 acres and having a length of 2.2 km. The lake is bordered by three villages viz., Gejjagalli, Kuppalur, and Bandipalya, and is located close to the Mysore Nanjangud road. The lake is heavily infested with water hyacinth, Eichhornia crassipes (Mart.) along with Pistia stratiotes, Lemna minor and Wolffia globosa. The lake's primary water source includes rain, sewage, and surface runoff from adjoining urban settings (Figure 1).
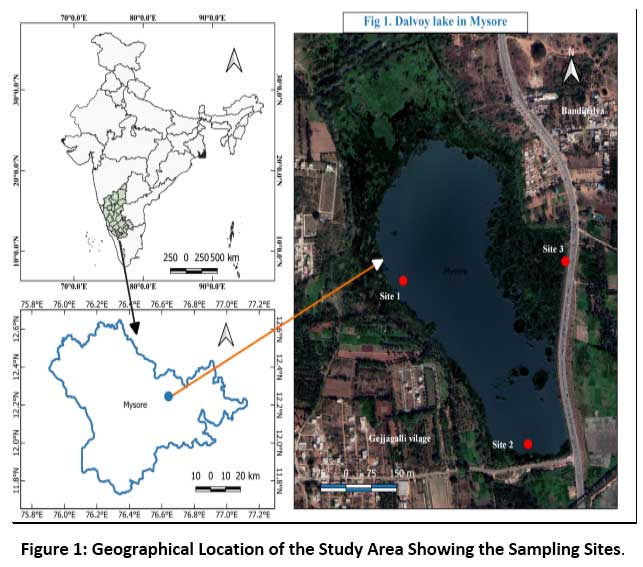 |
Figure 1: Geographical Location of the Study Area Showing the Sampling Sites. Click here to view Figure |
Water Sample Collection and Physico-Chemical Analysis
For studying the physico-chemical parameters of water, monthly sampling was done at Dalvoy Lake between 8.00am to 10.00am, for a period of one year (from October2017 to September 2018). Water samples were collected using 1 liter labeled plastic containers from three sampling sites by keeping in view the accessibility and the location of inlet and outlet. The surface water temperature and pH were recorded in the field, with a hand held mercury thermometer and Hanna HI98107 pH meter, respectively. Analysis of different physico-chemical variables like electrical conductivity, salinity, turbidity, total dissolved solids, dissolved oxygen, free carbon dioxide, total alkalinity, calcium, total hardness, nitrate, phosphate, sulphate, chloride, biological oxygen demand (BOD) and chemical oxygen demand (COD) were carried out in the laboratory as per standard methods.20,21 Variations in the physicochemical properties of water were recorded and compared with Bureau of Indian Standards (BIS)22 and Indian Council of Medical Research (ICMR) specifications for potable water.23 The pollution status was determined using water quality index (WQI). For the computation of WQI, the ‘weighted arithmetic index method' 24 was implemented. The overall WQI was calculated using the equation:
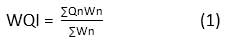
Where, Qn and Wn indicate the quality rating and unit weight of nth water quality parameter, respectively.
The Qn is computed using the following formulae:
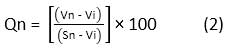
Where, Vn and Sn represent the observed value and standard value of the nth water quality parameter, respectively.
Vi indicates the ideal value, which is 0 for all parameters, except for pH and DO which are 7.0 and 14.6 mg/l respectively.
The Unit weight (Wn) is determined following the equation:
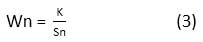
Where, K is the proportionality constant, which is computed following equation:
The computed WQI can be used to assess the overall health of the lake by comparing it with the WQI scale (Table 1).
Table 1: Water Quality Index Scale 24,25
|
WQI |
Rating |
|
0-25 |
Excellent water quality |
|
26-50 |
Good water quality |
|
51-75 |
Poor water quality |
|
76-100 |
Very poor water quality |
|
100 and above |
Unsuitable for drinking |
Collection and Identification Aquatic Insects
Aquatic insects were collected at each sampling site using a circular pond net (Opening 30×30 cm2, mesh size 500 µm). The collection was done by disturbing the substrate of littoral zone and dragging the net for one minute across the vegetation. A sample is made up of three such drags.10,26,27 The aquatic insects were sorted in white treys and were then preserved in 4% formalin at the sampling sites. Insects were identified at the laboratory to the possible lowest taxonomical level with help of a stereo zoom microscope (Labomed CZM4) following the standard keys. 28,29,30,31
Statistical Analysis
Descriptive statistics for all water quality parameters such as mean (x?) and standard deviation (S.D.) were calculated using Microsoft Excel. The PAST software was used to calculate diversity indices like Shannon, Evenness, Margalef and Berger-Parker index. The Pearson correlation coefficient analysis between different environmental variables and the density of aquatic insects was performed using SPSS (version 16) software. The CANOCO v.4.5 software was used to perform Canonical Correspondence Analysis (CCA) to determine the association between aquatic insect taxa and abiotic factors in different seasons. To understand the impact of water quality on aquatic insects community two biotic indices viz., Biological Monitoring Working Party (BMWP) scores and Average Score Per Taxon (ASPT) were computed using family level biotic scores based on their pollution tolerance.32
Results
Physicochemical Properties of Water
Season wise grouped data of water quality variables of Dalvoy Lake from October 2017 to September 2018 are given in Table 2. Most of the physico-chemical (Water quality) variables studied in this investigation showed significant differences across the seasons. Except, water temperature (27.18 - 30.21oC), pH (7.51 – 7.84), calcium (51.3 – 55.30 mg/L) and phosphate (2.38 – 2.9 mg/L) concentrations revealed no significant seasonal changes (Table. 2). The surface water conductivity showed clear cut seasonal variations with less (1008.58µS/cm) during monsoon (July to October), moderate (1192.5µS/cm) in post monsoon (November to February) and more (1270. 83µS/cm) during pre- monsoon (March to June). The turbidity of water was significantly higher (22.31 NTU) in post-monsoon season when compared to pre monsoon (16.44 NTU) and monsoon (15.16 NTU) seasons. Similarly, during the monsoon season, the total dissolved solids were significantly lower (486.08 mg/L) than in the pre-monsoon (668.33 mg/L) and post-monsoon (660 mg/L) seasons. Likewise, the Free CO2 concentration showed significant variations among seasons with 27.26 mg/L during monsoon, 44.56mg/L in post monsoon and 58.10mg/L in pre monsoon. The DO concentration was higher during the post monsoon (4.16 mg/ L) season than during the monsoon (3.96 mg/ L) and pre monsoon (2.49 mg/ L) seasons. The total hardness assessed showed seasonal differences, with Monsoon (267.83mg/L) being much lower than pre-monsoon and post-monsoon seasons (333.33mg/L), which was similar in both seasons. Total alkalinity recorded among seasons ranged between (204.33 – 238.08 mg/L). The high Total alkalinity value (238.08 mg/L) was measured during Monsoon period. The seasonal variation in Chemical Oxygen Demand (COD) ranged between (39.48 - 51.4 mg/L). Further, less COD (39.48mg/L) was reported during post-monsoon and maximum COD value (51.4 mg/L) during monsoon. There were no significant seasonal differences in the Biological Oxygen Demand (BOD). The BOD values (4.58 mg/L) during post monsoon and (6.42 mg/L) in pre-monsoon were the lowest and highest measured values respectively. The surface water Nitrate concentration was comparatively more (12.55 mg/L) during monsoon, when compare to pre monsoon (7.79 mg/L) and post monsoon (8.91 mg/L) seasons. The sulphate concentration showed seasonal differences with less (33.52 mg/L) in the monsoon, moderate (43.85 mg/L) in the pre-monsoon and more (54.32 mg/L) in the post-monsoon. The concentration of chloride among different seasons revealed that the monsoon had a lower concentration (114.7 mg/L) than the pre monsoon (136.72 mg/L) and post monsoon (140.64 mg/L) seasons (Table. 2).
Table 2: Physicochemical Characteristics of Lake Water in Different Seasons.
|
Parameters |
Post monsoon |
Pre monsoon |
Monsoon |
Annual x? ± SD |
|
Water temp. (°C) |
27.18 ± 2.25 |
30.21 ± 1.06 |
28.62 ± 1.32 |
28.67 ± 1.52 |
|
pH |
7.71 ± 0.16 |
7.51 ± 0.09 |
7.84 ± 0.40 |
7.69 ± 0.16 |
|
Cond(µS/cm) |
1192.5 ± 92.23 |
1270.83 ± 72.74 |
1008.58 ± 139.52 |
1157.3 ± 134. 62 |
|
Turb.(NTU) |
22.31 ± 13.19 |
16.44 ± 14.09 |
15.16 ± 9.17 |
17.97 ± 3.82 |
|
TDS (mg/L) |
660 ± 71.91 |
668.33 ±29.63 |
486.08 ± 66.68 |
604.81 ± 102.90 |
|
Free CO2 (mg/L) |
44.56 ± 1.95 |
58.1 ± 17.15 |
27.26 ± 6.31 |
43.31 ± 15.45 |
|
DO (mg/L) |
4.16 ± 0.81 |
2.49 ± 1.34 |
3.96 ± 0.22 |
3.54 ± 0.91 |
|
Ca2+(mg/L) |
55.30 ± 5.11 |
53.74 ± 2.79 |
51.3 ± 6.92 |
53.45 ± 2.02 |
|
TH (mg/L) |
333.33 ± 10.26 |
328.16 ± 22.50 |
267.83 ± 42.51 |
309.78 ± 36.42 |
|
TA (mg/L) |
204.75 ± 35.10 |
204.33 ± 53.60 |
238.08 ± 59.51 |
215.72 ± 19.37 |
|
COD (mg/L) |
39.48 ± 17.50 |
48.91 ± 21.99 |
51.4 ± 15.08 |
46.6 ± 6.29 |
|
BOD (mg/L) |
4.58 ± 1.23 |
6.42 ± 3.23 |
6.02 ± 1.52 |
5.67 ± 0.97 |
|
NO3-(mg/L) |
8.91 ± 3.69 |
7.79 ± 2.73 |
12.55 ± 7.32 |
9.75 ± 2.49 |
|
PO43-(mg/L) |
2.9 ± 1.30 |
2.38 ± 1.22 |
2.792 ± 0.10 |
2.71 ± 0.30 |
|
SO42-(mg/L) |
54.32 ± 19.77 |
43.85 ± 19.78 |
33.52 ± 4.93 |
43.89 ± 10.40 |
|
Cl-(mg/L) |
140.64 ± 5.54 |
136.72 ± 12.44 |
114.7 ± 12.51 |
130.68 ± 13.98 |
Water Quality Index (WQI)
In accordance with the conventional methods of calculating WQI, the first step is to estimate the unit weight for each parameter to a common scale. The unit weight and standard values for selected parameter as per BIS and ICMR standards used for calculating the WQI is given in Table 3. The WQI scores of the surface water samples of Dalvoy Lake for all the 3 seasons are shown in Table 4. The findings revealed that water quality of Dalvoy Lake in all seasons fall under unsuitable category (WQI > 100). The highest value of WQI was seen during post-monsoon (179.02), followed by pre monsoon (WQI = 160.83) and lowest was during monsoon (151.17).
Table 3: Drinking Water Standards and Recommended Agencies with Unit Weight (Wn)
|
Parameters |
Water quality standards (Sn) |
Recommended agency |
Unit weight (Wn) |
|
pH |
6.5-8.5 |
ICMR/ BIS |
0.1514 |
|
Conductivity |
300 |
BIS |
0.0043 |
|
TDS |
500 |
ICMR/ BIS |
0.0026 |
|
DO |
5 |
ICMR/ BIS |
0.2573 |
|
Calcium |
75 |
ICMR/ BIS |
0.0172 |
|
Hardness |
300 |
ICMR/ BIS |
0.0043 |
|
TA |
200 |
BIS |
0.0064 |
|
BOD |
5 |
ICMR |
0.2573 |
|
Nitrate |
45 |
BIS |
0.0286 |
|
Sulphate |
200 |
BIS |
0.0064 |
|
Chloride |
250 |
ICMR/ BIS |
0.0051 |
|
Turbidity |
5 |
BIS |
0.2573 |
|
|
|
∑Wn = |
1.00 |
Table 4: Season Wise Summary of WQI in Dalvoy Lake.
|
Seasons |
WQI |
WQS |
|
Post-monsoon |
179.02 |
Unsuitable |
|
Pre-monsoon |
160.83 |
Unsuitable |
|
Monsoon |
151.17 |
Unsuitable |
|
Overall WQI |
163.67 |
Unsuitable |
Pearson Correlation (Two- Tailed)
The results of significant correlations calculated between various physico-chemical parameters and aquatic insect density are shown in Table 5. The physico-chemical (water quality) variables studied, showed weak correlations with density of aquatic insects except free carbon dioxide, chloride, biological oxygen demand and chemical oxygen demand. FCO2 showed a positive correlation with aquatic insect density (0.618, P < 0.05). Similarly, chloride showed a positive correlation with aquatic insect density (0.618, P <0.05). There was a negative correlation between aquatic insect density and biological oxygen demand (-0.833, P 0.01) and chemical oxygen demand (-0.755, P 0.01), respectively. Further, the correlations among water quality variables (Table 5) revealed that the FCO2 having positive correlations of lesser significant with other water quality variables such as, conductivity, TDS, total hardness and chloride. A similar positive correlation was noticed between total hardness and calcium, phosphate and dissolved oxygen, sulphate and calcium. Further, more significant correlations were noticed between TDS and conductivity, total hardness and conductivity, total hardness and TDS, and between BOD and COD. Similarly, chloride showed significant correlations with TDS, Conductivity and Total Hardness.
Table 5: Significant Pearson’s Correlations between Physico-Chemical Variables and Aquatic Insect Density in Dalvoy Lake, Mysore.
|
Variables |
r |
Variables |
r |
|
Free CO2 vs Conductivity |
.660* |
Insect density vs Free CO2 |
.618* |
|
Free CO2 vs TDS |
.674* |
Density vs Chloride |
.618* |
|
Free CO2 vs Total hardness |
.660* |
TDS vs Conductivity |
.922** |
|
Total hardness vs Calcium |
.602* |
Total hardness vs Conductivity |
.845** |
|
Phosphate vs Dissolve oxygen |
.622* |
Total hardness vs TDS |
.889** |
|
Sulphate vs Calcium |
.662* |
BOD vs COD |
923** |
|
Chloride vs Free CO2 |
.707* |
Chloride vs TDS |
.899** |
|
Insect density vs COD |
-.775** |
Chloride vs Conductivity |
.865** |
|
Insect density vs BOD |
-.833** |
Total hardness vs Chloride |
.920** |
**significant at p <0.01 level (2 tailed); * significant at p < 0.05 level (2 tailed).
Composition and Distribution of Aquatic Insects
In the present investigation, 15 species of aquatic insects were identified and recorded. These belonged to 4 orders – Hemiptera, Coleoptera, Diptera and Ephemeroptera. The species composition of different orders of insects revealed that, the largest group noticed was Hemiptera comprising of 8 species, followed by 4 species of Diptera, 2 species of Coleoptera, and a lone species of Ephemeroptera (Table 6). The Order Hemiptera was the dominant, most diverse and abundant group when compare to remaining Insect groups studied. Hemiptera accounted for 64.88% of the total insect fauna (Fig. 2). In the current investigation, the order Hemiptera was represented by 6 families (Fig.3) viz. Notonectidae (32.23%), Belastomatidae (26.89%), Corixidae (3.05%), Mesovellidae (1.53%), Nepidae (0.59%) and Gerridae (0.59%). The second largest group was Diptera with 4 families (Fig.4) Chironomidae (13.15%), Culicidae (12.21%) Stratiomyidae (2.54%) and Syrphidae (0.76%). Coleoptera was represented by 2 families (Fig.5) Hydrophilidae (1.70%) and Dytiscidae (1.19%). Ephemeroptera was least represented with only one family Baetidae (3.56%).
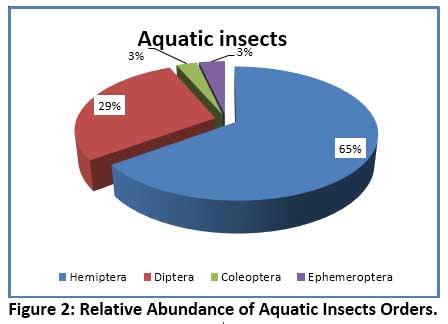 |
Figure 2: Relative Abundance of Aquatic Insects Orders. Click here to view Figure |
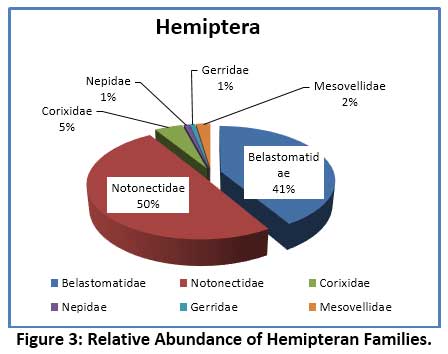 |
Figure 3: Relative Abundance of Hemipteran Families. Click here to view Figure |
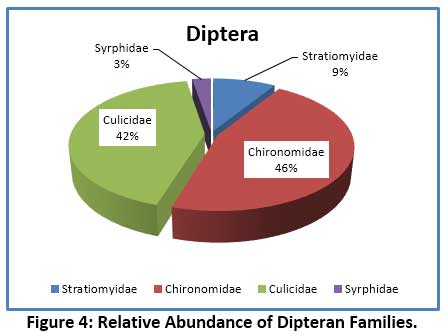 |
Figure 4: Relative Abundance of Dipteran Families. Click here to view Figure |
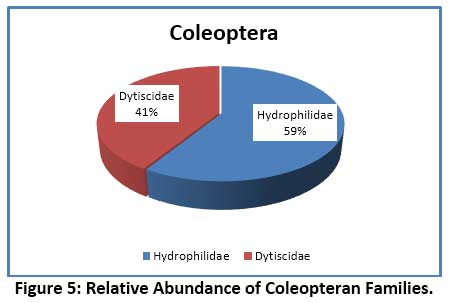 |
Figure 5: Relative Abundance of Coleopteran Families. Click here to view Figure |
Season wise distribution of aquatic insects revealed that, all families and orders of aquatic insects recorded in this study were present during post-monsoon season. Further, the Belastomatidae and Notonectidae of order Hemiptera; Chironomidae, Culicidae and Stratiomyidae of order Diptera and Dytiscidae of order Coleoptera are common across all the seasons. A lower family variation was found during pre-monsoon with only 8 families representing three orders (Table 6).
The abundance of different taxa of aquatic insects and their relative abundance and dominance status calculated based on Engelmann’s scale33 in the surface waters of Dalvoy Lake are given in Table 7. The species Diplonychus rusticus, Anisops sp. and Enithares sp. of order Hemiptera and Chironomous sp. and Culex sp. of order Diptera (Relative abundance (RA %) range 12.21 - 26.89%) are the most abundant and dominant species. The Baetis sp. of order Ephemeroptera was the only subdominant (RA = 3.56%) species reported. However, Sigara sp. and Mesovilia sp. of order Hemiptera; Hydroglyphus sp. and Berosus sp. of order Coleoptera and Stratiomys sp. of order Diptera were reported as recedent species (RA% range 1.19 - 3.05%). The Ranatra filiformes, Laccotrephes sp. Limnogonus sp. Eristalis sp. (RA% range 0.25 - 0.76%) were reported in subrecedent category (Table 7).
Seasonal variation in the diversity indices score based on insect assemblages calculated is shown in the Table 8. The Shannon index (H’) value measured in different seasons ranged from 1.392 to 2.111. The seasonal variation in Evenness value (e^H/S) revealed small differences, the minimum value of 0.5505 was recorded in post-monsoon, and maximum value 0.6659 in monsoon. The value of Margalef’s index showed significant variation with maximum value seen in post-monsoon (2.227) and minimum in pre-monsoon (1.166). Seasonal differences in the Berger Parker dominance index were also seen, with the highest score (0.4469) observed in the pre-monsoon season, compared to the post-monsoon (0.2565) and monsoon (0.2542) seasons.
Table 6: Seasonal Variation of Aquatic Insects during Studied Period in Dalvoy Lake.
|
Family |
Taxa Species |
Post monsoon |
Pre-monsoon |
Monsoon |
|
Hemiptera |
||||
|
Belastomatidae |
Diplonychusrusticus |
+ |
+ |
+ |
|
Notonectidae |
Anisops sp. |
+ |
+ |
+ |
|
Enithares sp. |
+ |
+ |
+ |
|
|
Corixidae |
Sigara sp. |
+ |
- |
+ |
|
Nepidae |
Ranatrafiliformes |
+ |
- |
- |
|
Laccotrephes sp. |
+ |
- |
- |
|
|
Gerridae |
Limnogonus sp. |
+ |
+ |
- |
|
Mesovellidae |
Mesovilia sp. |
+ |
- |
+ |
|
Coleoptera |
||||
|
Hydrophilidae |
Hydroglyphus sp. |
+ |
- |
- |
|
Dytiscidae |
Berosus sp. |
+ |
+ |
+ |
|
Diptera |
||||
|
Stratiomyidae |
Stratiomys sp. |
+ |
+ |
+ |
|
Chironomidae |
Chironomous sp. |
+ |
+ |
+ |
|
Culicidae |
Culex sp. |
+ |
+ |
+ |
|
Syrphidae |
Eristalis sp. |
+ |
- |
+ |
|
Ephemeroptera |
||||
|
Baetidae |
Baetis sp. |
+ |
- |
+ |
+ = Present; - =Absent
Table 7: Relative Abundance and Dominance Status of Aquatic Insects in Dalvoy Lake.
|
Taxa Species |
Abundance |
Relative abundance (RA)% |
Status |
|
Diplonychusrusticus |
317 |
26.89 |
Dominant |
|
Anisops sp. |
218 |
18.49 |
Dominant |
|
Enithares sp. |
162 |
13.74 |
Dominant |
|
Sigara sp. |
36 |
3.05 |
Recedent |
|
Ranatrafiliformes |
3 |
0.25 |
Subrecedent |
|
Laccotrephes sp. |
4 |
0.34 |
Subrecedent |
|
Limnogonus sp. |
7 |
0.59 |
Subrecedent |
|
Mesovilia sp. |
18 |
1.53 |
Recedent |
|
Hydroglyphus sp. |
20 |
1.70 |
Recedent |
|
Berosus sp. |
14 |
1.19 |
Recedent |
|
Stratiomys sp. |
30 |
2.54 |
Recedent |
|
Chironomous sp. |
155 |
13.15 |
Dominant |
|
Culex sp. |
144 |
12.21 |
Dominant |
|
Eristalis sp. |
9 |
0.76 |
Subrecedent |
|
Baetis sp. |
42 |
3.56 |
Subdominant |
Relative abundance < 1%= Sub-recedent; 1.1-3.1% = Recedent; 3.2-10 % = Sub-dominant; 10.1-31.6 % = Dominant; > 31.7% = Eudominant33
Table 8: Seasonal Variation in the Diversity Indices and Biomonitoring Scores of Dalvoy Lake.
|
Seasons |
Shannon_H’ |
Evenness_e^H/S |
Margalef |
Berger-Parker |
BMWP |
ASPT |
|
Post monsoon |
2.111 |
0.5505 |
2.227 |
0.2565 |
57 |
4.4 |
|
Pre monsoon |
1.392 |
0.5029 |
1.166 |
0.4469 |
32 |
4.6 |
|
Monsoon |
1.991 |
0.6659 |
1.83 |
0.2542 |
42 |
4.2 |
Scores of BMWP reflecting water quality: 0-16 = Very Poor; 17-50 = Moderate; 51-100 = Good; 101-150 = High; 151+ = very high. ASPT score: > 6 = Good water quality, 5-6 = Doubtful water quality, 4-5 = probable moderate pollution, < 4 = Intense pollution 32
BMWP and ASPT
The Biological Monitoring Working Party (BMWP) score is an index that uses macro-invertebrates as biological indicators to evaluate biological water quality34. The BMWP score is calculated by adding the scores of individual families present, where the score values of each family reflect their pollution tolerance. A high score indicates the presence of families that are sensitive to pollution, and a low score indicates families that are tolerant of pollution35. The average score per Taxon (ASPT) is determined by dividing BMWP score with total number of families present32. In the present investigation, the result obtained from the BMWP index revealed that, the water quality was moderate (score 32) during Pre-monsoon and in Monsoon (score 42). Whereas, the BMWP index during Post-monsoon was 57 which is at border for good water quality (50-100). However, the ASPT score was similar among the seasons studied (range 4.2 – 4.6) indicates probably moderate water quality in the surface waters of Dalvoy Lake (Table 8).
Canonical Correspondence Analysis (CCA)
The association between aquatic insect taxa and water quality variables for first the two axes in Dalvoy Lake are shown in Table. 9. CCA showed the following eigenvalues: axis I- 0.182, axis II- 0.076. The species and environmental correlation coefficient for both the axis I and axis II was 1.00, which indicates a significant association between aquatic insect community and environment parameters. The cumulative variance for axis I and axis II was 70.5 % for species data and 100 % for species-environment relationships, respectively.
Table 9: Summary of Canonical Correspondence Analysis Between Aquatic Insect Species and Environmental Variables for the First 2 Axes in Dalvoy Lake.
|
|
Axis 1 |
Axis 2 |
|
Eigenvalues |
0.182 |
0.076 |
|
Species-environment correlations |
1.000 |
1.000 |
|
Cumulative percentage variance: |
|
|
|
Of species data |
70.5 |
100 |
|
Of species-environment relation |
70.5 |
100 |
|
Sum of all eigenvalues |
0.259 |
|
|
Sum of all canonical eigenvalues |
0.259 |
|
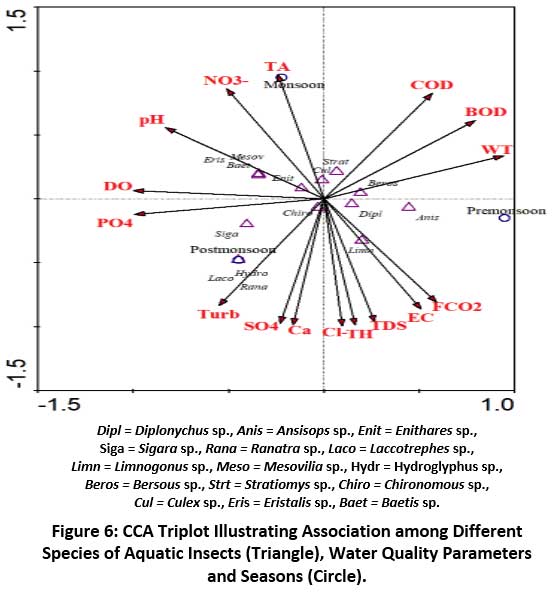 |
Figure 6: CCA Triplot Illustrating Association among Different Species of Aquatic Insects (Triangle), Water Quality Parameters and Seasons (Circle). |
Discussion
Environmental Factors
The seasonal variations in the mean values of selected physico-chemical (Water quality) parameters (Table 2) revealed that some of the Physico-chemical variables viz., Dissolved oxygen, BOD, Conductivity, TDS, Total hardness, Turbidity and Total alkalinity in the present investigation were beyond the minimum permissible limits of BIS and ICMR standards.
Temperature is the major physical factor which affects physicochemical and biological characteristics of water. The increase in water temperature not only accelerates chemical reactions but also reduces gas solubility and there by intensifies the taste and odour of water.36,37 In the present investigation the mean water temperature did not show much significant seasonal variations, except a slight increase in temperature was found during pre-monsoon (30.210C) which could be attributable to increased solar radiation, clear skies, and low water levels.38 The pH of the water was slightly alkaline throughout the sampling period, which agrees with the results of earlier workers 39 and was found to be within the acceptable range of drinking water standards. Electrical conductivity is a function of dissolved solids and it was strongly correlated with total dissolved solids during the study. Moreover, the measured conductivity levels and TDS were significantly higher in all seasons. The maximum values for conductivity (1270.83 S/cm) and TDS (668.33 mg/L) were observed during the pre-monsoon season, which corresponds with a reduction in water levels which is known to cause an increase in concentration of dissolved solids. Similar trend was observed in earlier studies on Dalvoy Lake.15,17 The high concentration of total dissolved solids is known to increase the water colour, which leads to increased temperature and decrease the rate of photosynthesis.40
The mean turbidity value was higher than the permissible limit (5 NTU) according to the BIS standards. Turbidity is inversely proportional to water transparency which is caused by suspended particles and organic matter, planktons and other microscopic organisms.41 Turbidity is regarded as a significant limiting factor in the biological productivity of water bodies.42
The FCO2 concentration was high throughout the study period and ranged from 27.26 – 58.10 mg/L, which can attribute to increased respiration. Further, FCO2 exhibited a strong positive association with aquatic insect density, which could be due to increased respiration by a large number of insects.43 Determination of dissolved oxygen (DO) concentration is a fundamental part of water quality assessment. The DO was maximum in the post-monsoon season (4.16 mg/L), which is due to the greater solubility of oxygen at lower temperature, while the lowest was observed in the pre-monsoon season (2.49mg/l) due to high temperatures.44 Further in this study a negative correlation between water temperature and DO (r = -0.459) was noticed. The depletion of DO can also be attributed to pollution, respiration and decomposition of decaying sediment.45
Calcium is a major divalent ion that is necessary for shell development, bone growth, and plant precipitation in freshwater bodies.46 The highest concentration of Calcium was measured during the post-monsoon season (55.30 mg/L) which was within the acceptable limits of BIS. The total hardness of water is also an important water quality parameter for its intended application in domestic or agricultural purposes.47 The maximum and minimum value of hardness was observed during post-monsoon (333.33 mg/L) and monsoon (267.83 mg/L). There was a strong positive association between total hardness, conductivity and total dissolved solids, which was in accordance with earlier reports.17
Alkalinity refers to water's ability to neutralize acids. Water becomes alkaline when carbonates, bicarbonates, and hydroxides are present.17 The total alkalinity of the water sample was slightly higher than the permissible limit (< 200 mg/L) according to BIS standard. The higher value of biological oxygen demand (BOD) attained during summer (6.42 mg/L) was in contrast to DO value. Moreover, BOD values correlated with COD, which is consistent with previous study15 and is linked to increased loads of residential sewage.48 A low BOD/COD value indicate good water quality, whereas a high BOD/COD value indicates polluted water which harms aquatic life.49 This is supported by a negative correlation of BOD and COD with aquatic insect density.
Nitrate is among the most stable forms of nitrogen and plays key role in growth of plankton and primary production. High concentrations of nitrate are generally the result of human activities like agriculture, disposal of organic and domestic sewage and industrial wastes.50 In the present study, the concentration of nitrate falls within the normal limits according to BIS standards. The concentration of phosphate during the study period ranged between 2.38 – 2.97 mg/L. A steady input even low level of nitrates and phosphates to an aquatic water body can considerably enhance algae growth.51 The mean sulphate values was also within the acceptable limit according to ICMR standards (< 200 mg/L). Sulphate levels in water can be increased by sewage and industrial wastes, as well as biological oxidation of reduced sulphur species.15 The concentration of chloride was within the acceptable limit of less than 250 mg/L. The general increase in chloride in lakes is likely corresponding to pollution from domestic sewage and agricultural wastes.52 The positive correlation of chloride with conductivity and total hardness can be attributed to the increase in salinity of the water.53
The WQI helps in transforming complex data sets into numeric expressions and present the status of water quality as a single number.54 The degradation of water quality was significantly higher in post-monsoon season (WQI- 179.02) and was almost similar in pre-monsoon (WQI- 160.83) and in monsoon season (151.17). The finding suggests that water quality is deteriorated throughout the year and is unsafe for human usage. The poor water quality can be ascribed to the excessive inflow of sewage waste and runoff from nearby urban settings.17
Biotic Factors
Aquatic insects are generally considered as the dominant macro-invertebrates in freshwater ecosystems. Several studies have shown that the structure and composition of biotic community changes with water quality which is often reflected in their distribution, diversity and abundance pattern of species.55, 56, 57 The species diversity and percentage composition of various insect orders collected from Dalvoy Lake is shown in Fig.2. The Hemiptera had the highest number of species represented by 8 genera, accounting for 65% of the total insects collected (table 6). Belastomatidae and Notonectidae were the most abundant family among Hemiptera which together accounted 91% of the family (Fig. 4). The dominance of the order Hemiptera is mainly because of its ability to use atmospheric oxygen through various respiratory devices (plastron, siphon etc.) thus they do not rely on DO in water.58 This is further evidenced in CCA analysis, where Laccotrephes sp., Sigarasp., Ranatra filiformes were associated with turbidity and low dissolved oxygen, suggesting their less dependency on DO.59 Similar reports as to the dominance of Hemiptera in freshwater lakes are noted in several studies. 5, 60, 61 The major Coleopteran was contributed by the families Hydrophilidae and Dytiscidae, represented by the genus Hydroglyphus and Berosus respectively. Studies have shown that Dytiscidae family generally inhabits submerged macrophytes, while the Hydrophilidae which are water scavengers occur in shallow water zones of the lake and feed on detritus and decaying organic matter.28 In the present study the heavy infestation of lake by Eichhornia crassipes support these families. Diptera constituted second major order and was contributed by 4 major families representing Chironomidae, Culicidae, Stratiomyidae and Syrphidae (Fig. 3). The genus Chironomous of Chironomidae and Culex sp. of Culicidae were regarded as dominant as per Engelmann’s scale.33 The members of these families tend to dominate heavily polluted water bodies. The high abundance of Chironomidae generally reveals environmental stress from anthropogenic activities. It is for this reason the larvae of the Chironomous genus are used as bio-indicators of pollution in many studies.62, 63, 64 The order Ephemeroptera was represented by only one genus Baetis (family: Baetidae) which is reported to be tolerant to organic pollution.65
The CCA ordination diagram showed that both environmental variables and aquatic insect assemblages were homogenously scattered (Fig.6). The correlation coefficient between sites and environmental variables is shown by the Eigen values associated with each axis.66 An Eigen value closer to 1 suggests a higher magnitude of connectivity among sites and environmental factors.67 In the present investigation, the correspondence was examined between seasons and variables, thus the total Eigen value of 0.26 suggests a low to medium level of correlation between species and season. The CCA ordination graph distinctly separated the seasons as per the aquatic insect community structure. During pre-monsoon, Berosus.sp. Diplonychus rusticus and Anisops sp. showed dependence on water temperature and FCO2. In postmonsoon season Laccotrephes sp., Sigara sp., Ranatra filiformes, Hydroglyphus sp. revealed strong dependence on concentration of phosphate and turbidity. Again in monsoon most of the species showed dependence on concentration of nitrate and total alkalinity.
The data on assemblage of aquatic insects in different seasons showed a high abundance during the Post monsoon season as compared to other two seasons. This is supported by a high Shannon index value of 2.111 in post monsoon season. The diversity index between 01 - 03 indicates moderate pollution. 68 The low Shannon (H') value (1.392) was recorded during pre-monsoon season which is justified by the maximum Berger – Parker Index (0.4469) indicating that the system was occupied by dominant species (Hemiptera) in that season. Several studies have found a large abundance of aquatic insects during the post-monsoon season, with similar findings.69,70 The low evenness value throughout the study indicates relatively even distribution of aquatic insects.71 The value of Margalef index ranged between 1.83 - 2.227, which indicates moderate pollution.72 These results are corroborated with the values of biotic indices BMWP (score 17-50) and ASPT (scores 4.2-4.6) suggesting moderate pollution by degradable organic matter.73
Conclusion
The results of the present analysis revealed that Dalvoy Lake is highly polluted, as evidenced by WQI and biological indices that indicate agitation of the system. Elevated levels of various water quality parameters like conductivity, TDS, total hardness, turbidity, and BOD throughout the year suggest a steady inflow of domestic and industrial waste. The study on the composition of aquatic insects revealed the abundance of Hemiptera and Diptera across all seasons. The high abundance of pollution-tolerant genera Chironomous and Culex of the order Diptera during the study period suggests high organic contamination. This is supplemented by the low diversity value (H ') along with low BMWP and ASPT scores. From the investigation, it can be said that the lake ecosystem is adversely affected and calls for stringent measures to control the indiscriminate dumping of municipal waste, industrial effluents as well as other pollutants into the lake water. Further, a long-term monitoring program and strict vigilance are needed for conservation and sustainable management of this perennial water body.
Acknowledgments
The authors would like to acknowledge the Principal of Yuvarajas’s college, University of Mysore, Mysore, for providing laboratory facilities. In addition the researchers want to appreciate the help of Dr. Goutham S and Mr. Lokesh D for their assistance during the field work.
Funding Sources
The author(s) received no financial support for the research, authorship, and/or publication of this article.
Conflict of Interest
The author(s) declares no conflict of interest.
References
- Ramachandra M.M. Water Quality Monitoring of Magadi Hill Range Lakes and Reservoirs of India. Hydrology. 2018;6(1):18-31. doi:10.11648/j.hyd.20180601.13.
CrossRef - Jalal F.N, Sanalkumar M.G. Water quality assessment of Pamba River of Kerala, India in relation to pilgrimage season. Int J Res Chem Environ IJRCE. 2013;3(1):341-347.
- Gupta S, Dey S, Purkayastha P. Use of Aquatic Insects in Water quality assessment of Ponds around two Cement Factories of Assam, India. Int Res J Environ Sci. 2013;2:15-19.
- Millennium Ecosystem Assessment (Program). Ecosystems and Human Well-Being: Wetlands and Water Synthesis: A Report of the Millennium Ecosystem Assessment. World Resources Institute; 2005.
- Dalal A, Gupta S. Aquatic insect diversity in two temple ponds of Silchar, Assam, N.E. India and their conservation values. Knowl Manag Aquat Ecosyst. Published online 2014:09. doi:10.1051/kmae/2014035.
CrossRef - Sun Y, Tong S, Fang M, Yang Y.J. Exploring the effects of population growth on future land use change in the Las Vegas Wash watershed: An integrated approach of geospatial modeling and analytics. Environ Dev Sustain. 2013;15:1495-1515. doi:10.1007/s10668-013-9447-z.
CrossRef - Naselli-Flores L. Urban Lakes: Ecosystems at Risk, Worthy of the Best Care. In; 2008:1333-1337.
- Singh A, Jayakumar S. Water Quality Assessment of Kanwar. Imp J Interdiscip Res. 2016;2(4):793-803.
- El Husseiny I.M, Mona Mohamed H, Seif A.I, Yassin M.T. Aquatic Insects as Bio Indicators for Pollution in Some Egyptian Streams. Sci-Afric J Sci Issues Res Essays. 2015;3(2):607-615.
- Subramanian K.A, Sivaramakrishnan K.G. Aquatic Insects for Biomonitoring Freshwater Ecosystems- A Methodology Manual. Asoka Trust Res Ecol Env. Published online 2007:31.
- Payakka A, Prommi T-O. Aquatic Insects Biodiversity and Water Quality Parameters of Receiving Water body. Curr World Environ. 2014;9(1). doi:10.12944/cwe.9.1.08.
CrossRef - Moore I.E, Murphy K.J. Evaluation of alternative macroinvertebrate sampling techniques for use in a new tropical freshwater bioassessment scheme. Acta Limnol Bras. 2015;27:213-222. doi:10.1590/S2179-975X8813.
CrossRef - Choudhury D, Gupta S. Impact of waste dump on surface water quality and aquatic insect diversity of Deepor Beel (Ramsar site), Assam, North-east India. Environ Monit Assess. 2017;189(11):540. doi:10.1007/s10661-017-6233-7.
CrossRef - Mamatha T, Parinitha T.N, Umesha S, Krishna B. Water Quality Monitoring and Trophic status classification of Karanji Lake, Mysore. Int J Curr Eng Technol. 2013;6.
- Adarsh S, Manasa M.P, Shesha Prakash M.N. Water Quality Assessment of Lakes in Mysuru, India - A Case Study. Int J Eng Res Technol. 2019;8(6):270-275.
- Padmanabha B. Diversity of Macroinvertebrates as a Tool to Assess Aquatic Pollution in Lentic Ecosystems. Nat Environ Pollut Technol. 2011;10(1):69-71.
- Upadhyay A, Chandrakala M. Water quality assessment of Dalvoy Lake water, Mysore, Karnataka, India. Int J Sci Environ Technol. 2016;5(5):3254-3261.
- Padmanabha B, Belagali S.L. Ostracods as indicators of pollution in the lakes of Mysore. J Environ Biol.2008:29(3):415-418.
- Savitha N, Yamakanamardi SM. Studies on abundance of zooplanktons in lakes of Mysore, India. J Environ Biol. 2012;33:1079-1085.
- Trivedy RK, Goel PK. Chemical and Biological Methods for Water Pollution Studies.Environmental publication(Karad,India). 1986.
- APHA. Standard Methods for the Examination of Water and Wastewater. American Water Works Association, Water Environment Federation; 2005.
- BIS. 2012. Specifications for Drinking Water- Indian Standard: IS 10500. Bureau of Indian Standards, New Delhi.
- ICMR. Manual of standards of quality for drinking water supplies. 1975.
- Brown R.M, McClelland N.I, Deininger R.A, O’Connor MF. A Water Quality Index — Crashing the Psychological Barrier. In: Thomas WA, ed. Indicators of Environmental Quality. Environmental Science Research. Springer US; 1972:173-182. doi:10.1007/978-1-4684-2856-8_15.
CrossRef - Chatterjee C, Raziuddin, M. Determination of water quality index (WQI) of a degraded river in Asansol Industrial area, P.O. Raniganj, District Burdwan,. Nat Environ Pollut Technol. 2002;1(2):181-189.
- Macan T.T, Maudsley R. The insects of the stony substratum of Windermere. Trans Soc Br Entomol. 1968;18:1-18.
- Brittain JE. Studies on the lentic Ephemeroptera and Plecoptera of Southern Norway. 1974;21:135-151.
- Khan R.A, Ghosh L.K. Faunal Diversity of Aquatic Insects in Freshwater Wetlands of South Eastern West Bengal. Zoological Survey of India; 2001.
- Subramanian K.A, Sivaramakrishnan K.G. Aquatic Insects of India-A Fieldguide. Ashoka Trust for Ecology and Environment (ATREE); 2007.
- Merritt R.W, Cummins K.W. An Introduction to the Aquatic Insects of North America. Kendall/Hunt Pub. Co.; 2008.
- Thirumalai G. Insecta: Hemiptera (Aquatic and Semi -aquatic), in: Fauna of Karnataka. In: Fauna of Karnataka, India. State Fauna Series. Zoological Survey of India; 2013:133-162.
- Mandaville SM. Benthic Macroinvertebrates in Freshwaters- Taxa Tolerance Values, Metrics, and Protocols. Soil & Water Conservation Society of Metro Halifax; 2002.
- Engelmann HD. Untersuchungen zur Erfassung predozoogener komponenten im de?nierten.Okosystem. Forschungen Staatl Mus NaturkdeGorlitz. 1973.
- Hawkes HA. Origin and development of the biological monitoring working party score system. Water Res. 1998;32(3):964-968. doi:10.1016/S0043-1354(97)00275-3.
CrossRef - Sivaramakrishnan K.G. Composition and Zonation of Aquatic Insect Fauna of Kaveri and its Tributaries and the Identification of Insect Fauna as Indicator of Pollution. 1992.
- Singh R, Mathur P. Investigation of variations in different physico-chemical characteristics in a fresh water reservoir of Ajmer city, Rajasthan. Indian J Environ Sci. 2005;9:57-61.
- Mamatha M. Water Quality Assessment of Kukkarahalli Lake Water Mysore, Karnataka, India. Int Res J Eng Technol. 2017;04(03):5.
- Latha S.N, Rai N.A. Ecological studies of Banjara Lake with reference to water pollution. J Environ Biol. 1998;19:179-186.
- Kalasaiah M, Balasubramanian A. Analysis of water quality index (WQI) in Dalvoy Lake, Mysore City, India. Nat Environ Pollut Technol. 2010;9:663-670.
- Chauhan B.S, Sagar S.K. Impact of Pollutants on Water Quality of River Sutlej in Nangal Area of Punjab, India. Biol Forum – Int J. 2013;5(1):113-123.
- Kumar S.M, Ravindranath S. Water Studies–Methods for Monitoring Water Quality. Center for Environment Education (CEE); 1998:191.
- Mahajan S, Billore D. Seasonal Variations and Assessment of Water Quality of Nagchoon Pond of Khandwa District (M. P.) India. Curr World Environ. 2014;9:829-836.
CrossRef - Purkayastha P, Gupta S. Insect diversity and water quality parameters of two ponds of Chatla wetland, Barak valley, Assam. Curr World Environ. 2012;7(2):243-250.
CrossRef - Wetzel RG. Limnology: Lake and River Ecosystems. Gulf Professional Publishing; 2001.
- Payakka A, Prommi T-O. Aquatic Insects Biodiversity and Water Quality Parameters of Receiving Water body. Curr World Environ J. 2014;9(1):53-58. doi:10.12944/CWE.9.1.08.
CrossRef - Jhingran VG. Fish and Fisheries of India. Delhi: Hindustan Pub. Corp. (India); 1991.
- Hameed A, Al Obaidy A.H, Abid H, Maulood B. Application of Water Quality Index for Assessment of Dokan Lake Ecosystem, Kurdistan Region, Iraq. J Water Resour Prot. 2010;2:792-798. doi:10.4236/jwarp.2010.29093.
CrossRef - Khan M.Y.A, Hu H, Tian F, Wen J. Monitoring the spatio-temporal impact of small tributaries on the hydrochemical characteristics of Ramganga River, Ganges Basin, India. Int J River Basin Manag. 2020;18(2):231-241. doi:10.1080/15715124.2019.1675677.
CrossRef - Edokpayi, J.N.; Odiyo, J.O.; Durowoju, O.S. Impact of Wastewater on Surface Water Quality in Developing Countries: A Case Study of South Africa | IntechOpen. 2017.
CrossRef - Gupta S, Narzary R. Aquatic insect community of lake, Phulbari anua in Cachar, Assam. J Environ Biol. 2013;34(3):591-597.
- Hasler A.D. Eutrophication of Lakes by Domestic Drainage. Ecology. 1947;28(4):383-395. doi:10.2307/1931228.
CrossRef - Sudarshan P, Mahesh M.K, Ramachandra T.V. Assessment of Seasonal Variation in Water Quality and Water Quality Index (WQI) of Hebbal Lake, Bangalore, India. Environ Ecol. 2019;37(1):309-317.
- Haggag A.A, Mahmoud M.A, Bream A.S, Amer M.S. Family Variation of Aquatic Insects and Water Properties to Assess Freshwater Quality in El-Mansouriya Stream, Egypt. Afr Entomol. 2018;26(1):162-173. doi:10.4001/003.026.0162.
CrossRef - Sutadian AD, Muttil N, Yilmaz AG, Perera BJC. Development of river water quality indices—a review. Environ Monit Assess. 2015;188(58). doi:10.1007/s10661-015-5050-0.
CrossRef - Brraich OS, Kaur R. Temporal composition and distribution of benthic macroinvertebrates in wetlands. Curr Sci. 2017;112(1):116-125.
CrossRef - Das K, Gupta S. Aquatic Hemiptera Community of Agricultural Fields and Rain Pools in Cachar District, Assam, North East India. Assam Univ J Sci Technol. 2010;5:123-128.
- Adu B.W, Oyeniyi E.A. Water quality parameters and aquatic insect diversity in Aahoo stream, southwestern Nigeria. J Basic Appl Zool. 2019;80(1):15. doi:10.1186/s41936-019-0085-3.
CrossRef - Thorpe W.H. Plastron Respiration in Aquatic Insects. Biol Rev. 1950;25(3):344-390. doi:https://doi.org/10.1111/j.1469-185X.1950.tb01590.x.
CrossRef - Bouchard R.W Jr. Guide to aquatic macroinvertebrates of the Upper Midwest. Water Resource Centre. In: ; 2004.
- Barman A, Baruah B.K. Aquatic insects of Kapla Beel, a flood plain wetland of Barpeta District of Assam, India. Clar- Int Multidiscip J. 2013.
- Abhijna U.G, Ratheesh R, Kumar A.B. Distribution and diversity of aquatic insects of Vellayani lake in Kerala. J Environ Biol. 2013; 34:605-611.
- Al-Shami S, Rawi C.S.M, Nor SAM, Ahmad AH, Ali A. Morphological deformities in Chironomus spp. (Diptera: Chironomidae) larvae as a tool for impact assessment of anthropogenic and environmental stresses on three rivers in the Juru river system, Penang, Malaysia. Environ Entomol. 2010;39(1):210-222. doi:10.1603/EN09109.
CrossRef - Lee J-M, Gan J-Y, Yule CM. The ecology of littoral zone Chironomidae in four artificial, urban, tropical Malaysian lakes. Urban Ecosyst. 2019;22(1):149-159. doi:10.1007/s11252-018-0802-6.
CrossRef - Gower AM, Buckland PJ. Water quality and the occurrence of Chironomus riparius Meigen (Diptera: Chironomidae) in a stream receiving sewage effluent. Freshw Biol.1978:153-164.
CrossRef - Menetrey N, Oertli B, Sartori M, Wagner A, Lachavanne J.B. Eutrophication: are mayflies (Ephemeroptera) good bioindicators for ponds? Hydrobiology. 2008; 597:125-135.
CrossRef - Pielou EC. The Interpretation of Ecological Data: A Primer on Classification and Ordination. Wiley; 1984.
- Palmer MW. Putting Things in Even Better Order: The Advantages of Canonical Correspondence Analysis. Ecology. 1993;74(8):2215-2230. doi:https://doi.org/10.2307/1939575.
CrossRef - Wilhm JL, Dorris TC. Species Diversity of Benthic Macroinvertebrates in a Stream Receiving Domestic and Oil Refinery Effluents. Am Midl Nat. 1966;76(2):427-449. doi:10.2307/2423096.
CrossRef - Takhelmayum K, Gupta S. Distribution of aquatic insects in phumdis (floating island) of Loktak Lake, Manipur, northeastern India. J Threat Taxa. 2011;3(6):1856-1861. doi:10.11609/JoTT.o2526.1856-61.
CrossRef - Barman A, Baruah BK. Influence of physico-chemical characteristics of water in seasonal abundance of insects of Kapla Beel, Assam, India. Int Res J Biol Sci. 2018;7(3):1-8.
- Türkmen G, Kazanci N. Applications of various biodiversity indices to benthic macroinvertebrate assemblages in streams of a national park in Turkey. Rev of Hydrobiology.2010;3(2):115-125.
- Lenat DR, Smock LA, Penrose DL. Use of Benthic Macroinvertebrates as Indicators of Environmental Quality. In: Biological Monitoring for Environmental Effects, Lexinton Books, Toronto, Canada.; 1980.
- Washington HG. Diversity, biotic and similarity indices: A review with special relevance to aquatic ecosystems. Water Res. 1984;18(6):653-694. doi:10.1016/0043-1354(84)90164-7.
CrossRef


