Comparative Study of Water Quality Parameters along NH, SH and Link Road of Shivalik Foothills in Himachal Pradesh
Anuja Bhardwaj
 , Rajeev Kumar Aggarwal
*
and Satish Kumar Bhardwaj
, Rajeev Kumar Aggarwal
*
and Satish Kumar Bhardwaj
http://dx.doi.org/10.12944/CWE.16.2.19
Copy the following to cite this article:
Bhardwaj A, Aggarwal R. K, Bhardwaj S. K. Comparative Study of Water Quality Parameters along NH, SH and Link Road of Shivalik Foothills in Himachal Pradesh. Curr World Environ 2021;16(2). DOI:http://dx.doi.org/10.12944/CWE.16.2.19
Copy the following to cite this URL:
Bhardwaj A, Aggarwal R. K, Bhardwaj S. K. Comparative Study of Water Quality Parameters along NH, SH and Link Road of Shivalik Foothills in Himachal Pradesh. Curr World Environ 2021;16(2). Available From : https://bit.ly/3vKxnty
Download article (pdf) Citation Manager Publish History

Introduction
Water could be regarded as a renewable resource, but in order to meet the needs of the human population and diverse developmental activities, it would have to become non-renewable, posing an environmental dilemma. Water is an integral part of life and is paramount for sustenance of the life cycle. Water resources are used for irrigation for agricultural output in addition to drinking and other domestic tasks.1 For human society and well-being, riverine systems provide a variety of ecosystem services, including supporting, supplying, regulating, and cultural services.2 Anthropogenic activities are damaging this vital part of environment in active as well as passive ways. From building through maintenance, road activities have a wide range of negative effects on water resources, including deforestation, vehicle and engine operation and maintenance, bitumen treatment and laying, cleaning and garbage dumping at construction sites, and fuel spills. Morphology of river streams and canals are significantly influenced by the roadway structure, which further disturbs the biota of the adjoining areas. Road activities have been precisely considered as a leading source of contaminants to adjacent water bodies like rivers, lakes and streams.3 These pollutants released through roads mainly consists of soil loss through runoff, spilled oils, paints and solvents, cleaners and other toxic chemicals, as well as dirt. Contaminants are delivered to water bodies either directly or as a result of runoff, resulting in physical, chemical, and biological degradation of the water quality. Water quality has been impacted by deforestation and degradation activities such as river sand mining, garbage disposal, and river bank farming.4 The presence of salts in water bodies such as rivers, oceans, streams and lakes create salinity and retards evaporation from these water bodies, which consequently affects the climate.5 Furthermore, recent increases in urbanization and industrialization, in order to meet the requirements of an ever-growing population, have resulted in an increasing pace of constructional activities, which has had a significant negative impact on the water quality of many natural water bodies.6
The current study aims to characterize the impact of road operations on local surface water sources, as well as to evaluate the impact of spatial variation associated with road pollutants on water quality and to investigate the relationship between various water quality parameters and seasons. The investigation's findings contributed in determining the extent to which water quality has deteriorated as a result of vehicular emission and other activities on road.
Materials and Methods
Study Area
Three different roads viz., National highway NH-154 (Jassur to Shahpur), State highway SH-28 (Nurpur to Lahru) and Link Road in Shivalik foothills of Kangra district of Himachal Pradesh were selected for the present study. The selected stretches (National and State Highways) are from part of route connecting both towns (Dharamshala and Dalhousie) with each other and also with Pathankot city of Punjab state. Moreover, routes are subjected to heavy traffic load besides tourism, it is also used as a corridor to transport vegetables, fruits and other goods and services to these towns. Link roads connects villages to each other and with main roads (NH or SH).
Climate and Weather Conditions
The climate of district Kangra is warm and temperate. Winter season commences from December to February, spring season falls from March to May, followed by summer season which remains from June to August and autumn season prevails till month of November. In this region 83 per cent of rains occurs during monsoon months. The average annual rainfall in the district Kangra is about 1751 mm. The average temperature ranges from 0oC to 38oC. June is the hottest month and January is the coldest one.
Experimental Details
To study the effects of road activities on water quality, total three sites (National Highway, State Highway and Link Road) were taken for study which further divided into two segments in each road. The surface water samples from each site were collected during pre-monsoon, monsoon and the post-monsoon seasons in the year 2018 and 2019. In total there were 9 treatment combinations (3×3) which were replicated three times in randomized block design. The flow chart of methodology is given in fig 1.
Sampling Method and Analysis
The samples were collected in the plastic bottles of one liter capacity. The surface water samples were collected from 10 to 12 cm below the water surface for detailed chemical analysis. The water quality parameters (pH, Electrical Conductivity (EC), turbidity, Total Dissolved Solids (TDS), Biological Oxygen Demand (BOD) and Chemical Oxygen Demand (COD) were analysed immediately after collection. The pH, EC and TDS of the water samples was determined using microprocessor-based pH, EC and TDS meter. Biochemical Oxygen Demand (BOD) was analysed by using BOD-system Oxi-direct and chemical oxygen demand (COD) with TR320 Spectroquant after digesting at 148oC for 2 hours. Chloride (Cl-) and nitrate (NO3-) were determined photometrically by using spectroquant pharo 300. The results were compared with permissible limits prescribed by WHO, CPCB (Table 1).
Table 1: Indian Standards for Drinking Water.
|
Water Chemical Properties (mg l-1) |
Desirable Limit3 |
Permissible Limit3 |
|
pH |
6.5-8.5 |
No relaxation |
|
Electrical conductivity |
200-800 µS/cm |
- |
|
Turbidity |
1 |
5 |
|
TDS |
500 |
2000 |
|
BOD |
<2 |
5 |
|
COD |
250 |
20 |
|
Chloride |
250 mg l-1 |
- |
|
Nitrate |
45 mg l-1 |
- |
|
Arsenic |
0.01 |
0.05 |
|
Cadmium |
0.003 |
No relaxation |
|
Chromium |
0.05 |
No relaxation |
|
Copper |
0.05 |
1.5 |
|
Lead |
0.01 |
No relaxation |
|
Nickel |
0.02 |
No relaxation |
The water quality parameters obtained in study area was compared with water standards prescribed by Bureau to Indian Standard (BIS, 2015) and Central Pollution Control Board (CPCB) and were used to discuss the results on effects of road activities on water quality.
Statistical Analysis
The data obtained from the analysis of water samples was subjected to statistical analysis using two-way and three-way Analysis of Variance (ANOVA) for the Factorial Randomized Block Design and tested at 5 per cent level of significance in the experiment as per the procedure suggested by Gomez and Gomez.7
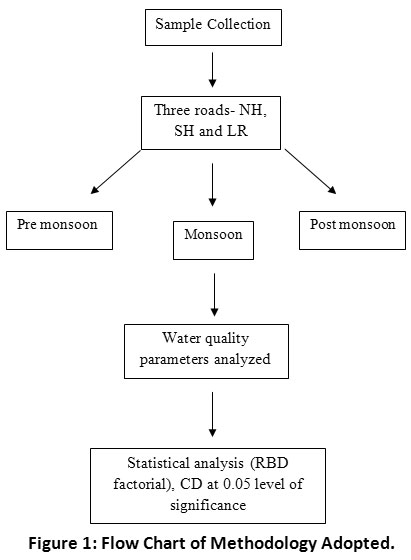 |
Figure 1: Flow Chart of Methodology Adopted. Click here to view Figure |
Results and Discussion
pH
The perusal of data presented in Table 2 revealed significant spatial and seasonal variations in water pH due to road activities. The pH was ranged from 6.94 to 7.31, which is within the permissible limits as prescribed by BIS and CPCB. The water pH followed a decreasing trend, with maximum pH at pre-monsoon followed by post-monsoon and minimum at monsoon season with respective values of 7.23, 7.16 and 7.07 and these values are statistically different from each other. The results are in corroboration with the findings of worker8 who also recorded higher pH in pre-monsoon season and low in post-monsoon season. Similar trend was also observed by the worker9 in his study along NH in north western Himalayas. The lower value of pH during the monsoon season may be due to dilution effect from rainwater. Results are in conformity with workers10 who recorded a fall in pH value in the monsoon season. Along the highways maximum pH was observed at NH (7.23) which is statistically different from SH (7.18) and LR (7.05). Further the season × highway interaction showed significantly highest pH of 7.31 recorded in pre-monsoon season at NH, whereas significantly lowest pH of 6.94 was recorded at LR in monsoon season. The results are in line with the finding of workers11 who also described that the decrease in water pH in the sources situated near the construction activity might be due to high salt containing runoff water.
Table 2: Spatial and Seasonal Variation in pH of Surface Water Along the Roads of Shivalik Foothills.
|
Season |
Pre-monsoon |
Monsoon |
Post-monsoon |
Mean |
|
National Highway |
7.31 |
7.14 |
7.23 |
7.23 |
|
State Highway |
7.25 |
7.12 |
7.16 |
7.18 |
|
Link Road |
7.14 |
6.94 |
7.09 |
7.05 |
|
Mean |
7.23 |
7.07 |
7.16 |
7.15 |
|
CD0.05 Season (0.02) Highway (0.03) Season x Highway (0.05) |
||||


(Permissible limit of pH: 6.5-8.5)
Table 3: Spatial and Seasonal Variation in EC (dS m-1) of Surface Water along the Roads of Shivalik Foothills.
|
Season |
Pre-monsoon |
Monsoon |
Post-monsoon |
Mean |
|
National Highway |
0.29 |
0.23 |
0.25 |
0.25 |
|
State Highway |
0.26 |
0.21 |
0.24 |
0.23 |
|
Link Road |
0.22 |
0.18 |
0.20 |
0.20 |
|
Mean |
0.26 |
0.20 |
0.23 |
0.23 |
|
CD0.05 Season (0.02) Highway (NS) Season x Highway (0.03) |
||||
(Permissible limit of pH: 200-800 µS/cm)
Electrical Conductivity (EC)
The data presented in Table 3, revealed significant spatial and seasonal variation in water EC due to road activities and ranged from 0.18 to 0.29 dS m-1, which was within the permissible limits as prescribed by BIS and CPCB. The water EC along the road indicated that the EC followed a decreasing trend with maximum at pre-monsoon followed by post-monsoon and minimum at monsoon season with respective values of 0.26, 0.23 and 0.20 dS m-1 and these values are statistically different from each other. The results are in line with the conclusions of authors12 who verified that higher EC in the surface water during monsoon possibly will be due to higher exposure of surface water sources to road activities, which directly lead to increase nitrate, sulphate, chloride, iron, aluminium ions, as conductivity mainly depends upon concentration of these ions in solution. The spatial variation showed that highest EC of 0.25 dS m-1 was recorded in the surface water bodies at NH, followed by 0.23 dS m-1 at SH, whereas lowest (0.20 dS m-1) EC was recorded at LR. Further the season × highway interaction showed significantly highest EC of 0.29 dS m-1 recorded in pre-monsoon season at NH, whereas significantly lowest EC of 0.18 dS m-1 was recorded at LR in monsoon season. The results are in conformity with the findings of workers.11,13
Table 4: Spatial and Seasonal Variation in TDS (mg l-1) of Surface Water along the Roads of Shivalik Foothills.
|
Season |
Pre-monsoon |
Monsoon |
Post-monsoon |
Mean |
|
National Highway |
174.14 |
158.17 |
142.39 |
158.23 |
|
State Highway |
172.08 |
156.29 |
140.94 |
156.43 |
|
Link Road |
170.21 |
152.42 |
140.29 |
154.30 |
|
Mean |
172.14 |
155.62 |
141.20 |
156.32 |
|
CD0.05 Season (3.56) Highway (4.04) Season x Highway (6.23) |
||||
(Permissible limit of TDS: 1000 mg l-1)
Total Dissolved Solids (TDS)
The data presented in Table 4, revealed significant spatial and seasonal variation in water TDS due to road activities and ranged from 140.29 to 174.14 mg l-1, which was within the permissible limits as prescribed by BIS and CPCB. TDS along the roads followed a declining trend, with maximum TDS during pre-monsoon (172.14 mg l-1) which is statistically different from monsoon (155.62 mg l-1) and post-monsoon (141.20 mg l-1) season. Higher TDS in water bodies adjacent to roads, may be due to road dirt, dissolved minerals and suspended matters, which washed away and get accumulated in water bodies. The results are in accordance with the findings of workers14. Similar findings were concluded by previous workers15 who also confirmed that higher content of TDS in water bodies nearby roads was due to surface runoff from road activities. Spatial observations showed that significantly highest TDS of 158.23 mg l-1 was observed at NH and it is statistically at par with SH (156.43 mg l-1) and LR (154.30 mg l-1). Season and highway interaction showed significantly highest TDS of 174.14 mg l-1 observed in pre-monsoon season at NH which is significantly at par with SH (172.08 mg l-1) and LR (170.21 mg l-1) in pre-monsoon whereas lowest TDS (140.29 mg l-1) was observed at LR in post-monsoon season.
Table 5: Spatial and Seasonal Variation in Turbidity (NTU) of Surface Water along the Roads of Shivalik Foothills.
|
Season |
Pre-monsoon |
Monsoon |
Post-monsoon |
Mean |
|
National Highway |
3.66 |
3.36 |
3.38 |
3.46 |
|
State Highway |
3.37 |
3.23 |
2.95 |
3.18 |
|
Link Road |
2.75 |
2.79 |
2.79 |
2.77 |
|
Mean |
3.26 |
3.12 |
3.04 |
3.14 |
|
CD0.05 Season (0.25) Highway(0.20) Season x Highway (0.43) |
||||
(Permissible limit of Turbidity: 10 NTU)
Water Turbidity
The perusal of data presented in Table 5, revealed significant spatial and seasonal variation in water turbidity due to road activities and ranged from 2.75 to 3.66 NTU, which was within the permissible limits as prescribed by BIS and CPCB. The water turbidity along the roads followed a declining trend, with maximum turbidity during pre-monsoon (3.26 NTU) followed by monsoon (3.12 NTU) and minimum during post-monsoon (3.04 NTU) seasons, turbidity at all three seasons were statistically at par with each other. The results are in accordance with the findings of workers16 who also confirmed that due to more clay and silt immersed from road activities turbidity of water bodies increases. Spatial observations showed that significantly highest turbidity of 3.46 NTU was observed at NH and it is significantly different from SH (3.18 NTU) and LR (2.77 NTU). Season and highway interaction showed significantly highest turbidity of 3.66 NTU in pre-monsoon season at NH which is significantly at par with NH (3.36 NTU during monsoon, 3.38 NTU during post-monsoon) and also with SH (3.37 NTU during pre-monsoon, 3.23 NTU during monsoon), whereas lowest turbidity (2.75 NTU) was observed at LR in pre-monsoon season.
Table 6: Spatial and Seasonal Variation in BOD (mg l-1) of Surface Water along the Roads of Shivalik Foothills.
|
Season |
Pre-monsoon |
Monsoon |
Post-monsoon |
Mean |
|
National Highway |
2.86 |
2.78 |
2.67 |
2.77 |
|
State Highway |
2.78 |
2.67 |
2.62 |
2.69 |
|
Link Road |
2.44 |
2.40 |
2.30 |
2.38 |
|
Mean |
2.69 |
2.61 |
2.53 |
2.61 |
|
CD0.05 Season (0.05) Highway (0.03) Season x Highway (0.07) |
||||
(Permissible limit of BOD: 5 mg l-1)
Table 7: Spatial and Seasonal Variation in COD (mg l-1) of Surface Water along the Roads of Shivalik Foothills.
|
Season |
Pre-monsoon |
Monsoon |
Post-monsoon |
Mean |
|
National Highway |
19.63 |
17.04 |
15.89 |
17.52 |
|
State Highway |
17.44 |
15.95 |
15.31 |
16.23 |
|
Link Road |
15.50 |
15.23 |
13.97 |
14.90 |
|
Mean |
17.52 |
16.07 |
15.06 |
16.22 |
|
CD0.05 Season (0.58) Highway (0.49) Season x Highway (1.02) |
||||
(Permissible limit of COD: 20 mg l-1)
Biological Oxygen Demand (BOD)
The data given in Table 6, revealed significant spatial and seasonal variation in water BOD due to road activities and ranged from 2.30 to 2.86 mg l-1 which was within the permissible limits as prescribed by BIS and CPCB.The water BOD along the roads followed a declining trend, with maximum BOD during pre-monsoon (2.69 mg l-1) followed by monsoon (2.61 mg l-1) and minimum during post-monsoon (2.53 mg l-1) seasons, BOD at pre monsoon season were statistically different from other. More BOD value in water bodies adjacent to roads may be due to exposure to chemical effluents from road activities that may cause nutrient enrichment in water. The results are in accordance with the findings of workers14. The spatial observations showed that significantly highest BOD of 2.77 mg l-1 observed at NH which is significantly different from SH (2.69 mg l-1) and LR (2.38 mg l-1). Spatial observations showed that significantly highest BOD of 2.77 mg l-1 was observed at NH and it is significantly different from SH (2.69 mg l-1) and LR (2.38 mg l-1). Season and highway interaction showed significantly highest BOD of 2.86 mg l-1 observed in pre-monsoon season at NH which is significantly different from SH (2.78 mg l-1) in pre-monsoon whereas lowest BOD (2.30 mg l-1) was observed at LR in post-monsoon season. The results are in line with the findings of a worker17 who also confirmed that more BOD in pre-monsoon season is due to occurrence of organic matter and rapid exploitation of oxygen at higher temperature.
Chemical Oxygen Demand (COD)
The data presented in Table 7, revealed significant spatial and seasonal variation in water COD due to road activities and ranged from 13.97 to 19.63 mg l-1 which was within the permissible limits as prescribed by CPCB. The COD along the roads followed a declining trend, with maximum during pre-monsoon (17.52 mg l-1) followed by monsoon (16.07 mg l-1) and minimum during post-monsoon (15.06 mg l-1) seasons. COD at pre monsoon season were statistically at par with monsoon and post monsoon. The results are in accordance with previous workers11,12. The spatial observations showed that significantly highest COD of 17.52 mg l-1 observed at NH is significantly different from SH (16.23 mg l-1) and LR (14.90 mg l-1). Season and highway interaction showed significantly highest COD of 19.63 mg l-1 observed in pre-monsoon season at NH which is significantly different from SH (17.44 mg l-1) in pre-monsoon whereas lowest COD (13.97 mg l-1) was observed at LR in post-monsoon season.
Table 8: Seasonal and Spatial Variation in Chloride Concentration (mg l-1) in Surface Water along the Roads of Shivalik Foothills.
|
Season |
Pre-monsoon |
Monsoon |
Post-monsoon |
Mean |
|
National Highway |
29.94 |
22.66 |
18.89 |
23.83 |
|
State Highway |
27.87 |
22.06 |
16.89 |
22.27 |
|
Link Road |
24.79 |
19.29 |
15.01 |
19.70 |
|
Mean |
27.53 |
21.34 |
16.93 |
21.93 |
|
CD0.05 Season (1.56) Highway (1.34) Season x Highway (1.67) |
||||
(Permissible limit of Cl-: 250 mg l-1)
Table 9: Seasonal and Spatial Variation in Nitrate Concentration (mg l-1) in Surface Water along the Roads of Shivalik Foothills.
|
Season Sites |
Pre-monsoon |
Monsoon |
Post-monsoon |
Mean |
|
National Highway |
4.14 |
4.67 |
4.22 |
4.34 |
|
State Highway |
3.69 |
4.17 |
4.21 |
4.02 |
|
Link Road |
3.38 |
3.99 |
4.19 |
3.85 |
|
Mean |
3.73 |
4.28 |
4.21 |
4.07 |
|
CD0.05 Season (0.11) Highway (0.17) Season x Highway (0.26) |
||||
(Permissible limit of NO3-: 45 mg l-1)
Chloride Concentration in the Surface Water Bodies
The data presented in Table 8, revealed significant spatial and seasonal variation in chloride concentration due road activities and ranged from 15.01 to 29.94 mg l-1, which was within the permissible limits as prescribed by BIS and CPCB. The water chloride concentration along the roads followed a declining trend, with maximum during pre-monsoon (27.53 mg l-1) followed by monsoon (21.34 mg l-1) and minimum at post-monsoon (16.93 mg l-1) seasons. Water chloride concentration at pre monsoon season were statistically different from monsoon and post monsoon. The results are in accordance with previous workers11,13. The spatial observations showed that significantly highest chloride concentration of 23.83 mg l-1 observed at NH is significantly different from SH (22.27 mg l-1) and LR (19.70 mg l-1). Season and highway interaction showed significantly highest chloride concentration of 29.94 mg l-1 observed in pre-monsoon season at NH which is significantly different from SH (27.87 mg l-1) in pre-monsoon whereas lowest chloride concentration (15.01 mg l-1) was observed at LR in post-monsoon season.
Nitrate Concentration in the Surface Water Bodies
The data presented in Table 9, revealed significant spatial and seasonal variation in nitrate concentration due to road activities and ranged from 3.38 to 4.67 mg l-1, which was within the permissible limits as prescribed by BIS and CPCB. The water nitrate concentration along the roads followed a declining trend with maximum during monsoon (4.28 mg l-1) followed by post-monsoon (4.21 mg l-1) and minimum during pre-monsoon (3.73 mg l-1) seasons. Water nitrate concentration at monsoon season was statistically at par with monsoon and different than post monsoon. Results are in accordance with the conclusions of worker18 who also reported higher values of nitrate in monsoon season as compared to other seasons. The spatial observations showed that significantly highest nitrate concentration of 4.34 mg l-1 observed at NH which is significantly different from SH (4.02 mg l-1) and LR (3.85 mg l-1). Season and highway interaction showed significantly highest nitrate concentration of 4.67 mg l-1 observed in monsoon season at NH which is significantly different from SH (4.17 mg l-1) in monsoon season whereas lowest nitrate concentration (3.38 mg l-1) was observed at LR in pre-monsoon season.
Concentration of Different Heavy Metals in Surface Water Bodies
The concentration of heavy metal in water obtained from statistical analysis given in the table 10. Mean values of concentration of Cd, Cr, Pb, As, Cu and Ni at NH, SH and LR showed spatial variation. Concentration for all heavy metals, found within permissible limit of BIS. Comparatively more concentration of heavy metal was observed at water bodies along NH followed by SH and lowest was at LR.
The concentrations of heavy metals Cd, Cr, Pb and Fe were studied in water bodies alongside NH-22 in Himachal Pradesh and it was observed that values of these metals were within range 0.005-0.018 mg l-1, 0.021-0.049 mg l-1, 0.012-0.032 mg l-1 and 0.153-0.328 mg l-1 respectively.19 Heavy metals (Cd, Al, Co, Cu, Cr, Fe, Mn, Pb, Ni, and Zn) were measured as dissolved and particulate in the runoff from a major urban highway during the winter and summer seasons.20 The concentration for all the metals was suggestively high over the summer except for Co and Al, which exhibited a higher mass concentration during wintertime. Analysis of pollutant in runoff water from highway of Gdansk beltway in Poland was conducted and outcomes revealed that road runoff carried away cations and anions from the road to water bodies located at the horizontal distance (<200 m) from road, which ultimately degraded the water quality.14
Table 10: Spatial Variation in Different Heavy Metal Concentrations (mg l-1) in Surface Water along the Roads of Shivalik Foothills.
|
Heavy Metals |
Mean |
Min. |
Max. |
S.D.* |
C.V.* |
|
Cadmium |
|
||||
|
NH |
0.016 |
0.008 |
0.021 |
0.0092 |
0.4377 |
|
SH |
0.012 |
0.006 |
0.017 |
0.0078 |
0.4575 |
|
LR |
0.009 |
0.004 |
0.015 |
0.0078 |
0.5185 |
|
CD0.05 Season (0.001) Highway (0.001) Season x Highway (0.002) |
|||||
|
Chromium |
|
||||
|
NH |
0.038 |
0.025 |
0.048 |
0.0163 |
0.3388 |
|
SH |
0.032 |
0.021 |
0.041 |
0.0141 |
0.3449 |
|
LR |
0.024 |
0.019 |
0.031 |
0.0085 |
0.2737 |
|
CD0.05 Season (0.001) Highway (0.001) Season x Highway (0.002) |
|||||
|
Lead |
|
||||
|
NH |
0.045 |
0.041 |
0.049 |
0.0057 |
0.1154 |
|
SH |
0.036 |
0.031 |
0.041 |
0.0071 |
0.1725 |
|
LR |
0.023 |
0.021 |
0.024 |
0.0021 |
0.0884 |
|
CD0.05 Season (0.001) Highway (0.001) Season x Highway (0.002) |
|||||
|
Arsenic |
|
||||
|
NH |
0.047 |
0.031 |
0.056 |
0.0177 |
0.3157 |
|
SH |
0.040 |
0.025 |
0.051 |
0.0184 |
0.3605 |
|
LR |
0.032 |
0.018 |
0.043 |
0.0177 |
0.4111 |
|
CD0.05 Season (0.002) Highway (0.001) Season x Highway (0.002) |
|||||
|
Copper |
|
||||
|
NH |
0.046 |
0.033 |
0.054 |
0.0148 |
0.2750 |
|
SH |
0.038 |
0.026 |
0.046 |
0.0141 |
0.3074 |
|
LR |
0.030 |
0.021 |
0.035 |
0.0099 |
0.2828 |
|
CD0.05 Season (0.001) Highway (0.001) Season x Highway (0.002) |
|||||
|
Nickel |
|
||||
|
NH |
0.025 |
0.018 |
0.029 |
0.0078 |
0.2682 |
|
SH |
0.022 |
0.016 |
0.026 |
0.0071 |
0.2720 |
|
LR |
0.016 |
0.014 |
0.018 |
0.0028 |
0.1571 |
|
CD0.05 Season (0.001) Highway (0.001) Season x Highway (0.001) |
|||||
*S.D.- Standard Deviation, *C.V.- Coefficient of variation
Conclusion
On the basis of regional and seasonal distribution, this study looked at the effect of road activities (vehicular emissions) on water quality parameters of water bodies running beside highways. According to the findings, such activities are responsible for bringing contaminants into local water bodies, affecting water quality, and eventually leading to water pollution. Although all of the water quality metrics were within permissible limits of standard water quality, the current study show that, given the existing circumstances, water quality may deteriorate over time due to factors such as population growth, which places an undue strain on natural resources. The consequences of traffic emissions around roadside water bodies were highest in NH, followed by SH, and lowest in LR. The pre-monsoon season had the highest values of water quality metrics, followed by the monsoon, and finally the post-monsoon. As a result, in the wake of harmful activities produced by various road activities, constant monitoring and surveillance for quality evaluation of water sources is required.
Acknowledgements
The support for conducting research, received from the Department of Environmental Science, Dr. YSP UHF, Nauni during the study period is thankfully acknowledged.
Funding Source
There is no funding or financial support for this research work.
Conflict of Interest
Authors have no conflict of interest.
References
- Guiamel, I.A. and Lee, H.S. Watershed Modelling of the Mindanao River basin in the Philippines using the SWAT for water resource management. Civ Eng J. 2020; 6(4):626-648. https://doi.org/10.28991/cej-2020-03091496.
CrossRef - Flajsig, G.C., Vuckovic I. and Karleusa, B. An Innovative Holistic Approach to an E-flow Assessment Model. Civ Eng J. 2020; 6(11): 2188-2202. https://doi.org/10.28991/cej-2020-03091611.
CrossRef - Abewickrema, A W., Amanthika, R.W., Abeysinghe, A.L., Tennakoon, R.K., Tennakoon, A.H. and Caldera, H.M. Assessment of water quality impacts of highway and road construction projects. In: Proceedings of South Asian Institute of Technology and Medicine Research Symposium on Engineering Advancements, (SAITM), Sri Lanka. 2013;136-143.
- Supriya, K., Aggarwal, R. K. and Bhardwaj S. K. Impact of Land uses on Air and Water Quality- A Review. Curr World Environ. 2018;13 (Special-issue 5-2018). http://dx.doi.org/10.12944/CWE.13.Special-Issue1.03.
CrossRef - Obianyo, J.I. Effect of Salinity on Evaporation and the Water Cycle. Emerg Sci J. 2019; 3(4): 255-262. https://doi.org/10.28991/esj-2019-01188.
CrossRef - Arismendi, I., Groom, J.D., Reiter, M., Johnson, S.L., Dent, L. and Meleason, M. Suspended sediment and turbidity after road construction/improvement and forest harvest in streams of the Trask River Watershed Study, Oregon. Water Resours Res. 2017; 53:6763-6783. https://doi.org/10.1002/2016wr020198.
CrossRef - Gomez, K.A. and Gomez, A.A. Statistical procedures for agricultural research. II (ed) New York, USA: John Wiley and Sons; 1984.
- Patil, A.M. Analysis of water quality aspects of Wainganga River, Maharashtra, India. Water week. Water, Energy and Food Security: Call for Solution. New Delhi. 2012: 1-12.
- Handa, S. Environmental Impact Assessment of Expansion Activities on National Highway-88 in Himachal Pradesh. Ph.D. Thesis. Department of Environmental Sciences, Dr. Y.S. Parmar University of Horticulture and Forestry, Nauni, Solan, (HP), India. 2018. 170p.
- Shardendu, N. and Ambasht, R.S. Limnological studies of a rural pond and urban tropical aquatic ecosystem: oxygen enforms and ionic strength. Trop Ecol. 1998; 2:98-109.
- Fronczyk, J., Radziemska, M., Dynowski, P., Mazur, Z. and Bazydlo, M. 2016. Quality of water in the road drainage systems in the Warsaw agglomeration, Poland. Water. 2016; 8(429):1-12. https://doi.org/10.3390/w8100429.
CrossRef - Doamekpor, L.K., Darko, R., Klake, R.K., Samlafo, V.B. and Bobobee, L.H. Assessment of the contribution of road runoff to surface water pollution in the New Juaben Municipality, Ghana. J Geosci Environ Prot. 2016; 4:173-190. https://doi.org/10.4236/gep.2016.41018.
CrossRef - Harun, S., Abdullah, M.H., Mohamed, M., Fikri, A.H. and Jimmy, E.O. Water quality study for four streams within Maliau basin conservation area, Sabah, Malaysia. J Trop Bio Conserv. 2010; 6:109-113.
- Polkowska, Z., Skarzynska, K., Dubiella-Jackowska, A., Staszek, W. and Namiesnik, J. Evaluation of pollutant loading in the runoff waters from a major urban highway (Gdansk Beltway, Poland). Global Nest J. 2007; 9(3): 269-275. https://doi.org/10.30955/gnj.000447.
CrossRef - Kayhanian, M., Fruchtman, B.D., Gulliver, J.S., Montanaro, C., Ranieri, E. and Wuertz, S. Review of highway runoff characteristics: comparative analysis and universal implications. Water Res. 2012; 46:6609-6624. https://doi.org/10.1016/j.watres.2012.07.026.
CrossRef - Singh, T.A., Meetei, N.S. and Meitei, L.B. Seasonal variation of some physico-chemical characteristics of three major rivers in Imphal, Manipur: A comparative evaluation. Curr World Environ. 2013; 8(1):93-102. https://doi.org/10.12944/cwe.8.1.10.
CrossRef - Ahipathy, M.V. and Puttaiah, E.T. Ecological characteristics of Vrishabhavathy river in Bangalore (India). Environ Geol. 2006; 49:1217-1222. https://doi.org/10.1007/s00254-005-0166-0.
CrossRef - Manjare, S.A., Vhanalakar, S.A. and Muley, D.V. Analysis of water quality using physico-chemical parameters at Tamdalge tank in Kolhapur district, Maharashtra. Intern J Adv Biotech Res. 2010; 1:115-119.
- Walia, K. Environmental impact assessment studies on expansion of National Highway-22 in Himachal Pradesh. Ph.D. Thesis. Department of Environmental Sciences, Dr. Y.S.Parmar University of Horticulture and Forestry, Nauni, Solan, (HP), India. 2018. 161p
- Hallberg M. and Renman G. Removal of heavy metals from road runoff by filtration in granular slag columns. In: 11th international Conference on Urban Drainage, Edinburg, Scotland, UK. 2008; 1-11.


