Distribution Trends and Source Diagnosis of Polycyclic Aromatic Hydrocarbons (PAHs) in Sediments of Imiringi River
Ayobami Omozemoje Aigberua1
*
 and Enetimi Idah Seiyaboh2
http://dx.doi.org/10.12944/CWE.16.2.25
Copy the following to cite this article:
Aigberua A. O, Seiyaboh E. I. Distribution Trends and Source Diagnosis of Polycyclic Aromatic Hydrocarbons (PAHs) in Sediments of Imiringi River. Curr World Environ 2021;16(2). DOI:http://dx.doi.org/10.12944/CWE.16.2.25
Copy the following to cite this URL:
Aigberua A. O, Seiyaboh E. I. Distribution Trends and Source Diagnosis of Polycyclic Aromatic Hydrocarbons (PAHs) in Sediments of Imiringi River. Curr World Environ 2021;16(2). Available From : https://bit.ly/3yi2UFx
Download article (pdf) Citation Manager Publish History

Introduction
With around 240,000 barrels of crude oil being spilled across the Niger Delta on annual basis1, the water bodies of coastal communities within most of Nigeria’s offshore oil and gas installations are often faced with a myriad of environmental and infrastructure-damaging occurrences stemming from associated activities such as crude oil transport and spillage via corroded surface or under-water pipelines, boating emissions, oil bunkering, refuse dumping, industrial effluent discharges, and run-offs from coastal or riverine farmlands, amongst others. These scenarios tend to elevate the levels of micro-pollutants in the aquatic ecosystem, thereby negatively impacting the overall quality of the habitat2-8, with the sediment acting as reservoir for organic and inorganic contaminants deposition. The presence of polycyclic aromatic hydrocarbons (PAHs) in aquatic ecosystems often exposes aquatic flora and fauna to the risk of toxicants bioaccumulation. High concentration of PAHs within water bodies mainly exacerbates toxic effects within the environment. Consequently, the overall water quality is adversely affected. Generally, the exploration of crude oil in the region has continued to pose significant socio-economic burden on the wellbeing of local inhabitants of host communities, thereby leading to the degradation of agricultural lands and fishing zones, thus causing food shortage, as well as leading to communal agitations or unrest9.
Polycyclic aromatic hydrocarbons (PAHs) belong to a class of ubiquitous organic pollutants that are hydrophobic in nature, posing significant health and ecological risks10. PAHs have also been grouped as mutagenic, toxic and carcinogenic compounds11-12. They naturally occur from bush burning, volcanic eruptions or during physical and chemical fluxes which accompany sedimentary rock formation13. Anthropogenic releases emanate from combustion of liquid petroleum fuels14-15, biomass16, coal, coal tar and crude oil17-19. Also, they are major constituents of crude oil, hence their presence in oil-impacted environments2-3. Other natural occurrences like flooding can potentially contribute to the redistribution and spike in concentration of PAHs in the environment.
The prevalence of certain PAH constituents in the environment are determined by their ability to become soluble within a given matrix. Generally, PAHs contain between 2 to 6 fused ring structures, with the 2 to 4-ringed low molecular weight PAHs (LPAHs) assuming increased solubility in water as compared to the high molecular weight PAHs (HPAHs) (4 to 6-ringed types) of poor water-solubility. Again, LPAHs tend to degrade faster in the environment. This is because of its relatively higher rate of evaporation. On the other hand, HPAHs become adsorbed to particles within the environmental matrix due to its increasing lipophilicity10, 20. As such, increasing PAH rings reflect reduced solubility and aggravate environmental persistence, while fewer fused-rings are more soluble, thereby portending elevated risk of bioavailabilty. In addition, LPAHs displays synergy in relation to other organic micro-pollutants, while HPAHs are well-known carcinogens 21-22, hence, depicting toxic tendencies to human health, causing deformities, mutation and interference with hormonal glands23-25. Known carcinogens like benzo(a)pyrene are major constituents of spilled crude oil which are easily bioaccumulated in food crops, often causing childhood undernourishment, hematoxic and hepatotoxic effects, infertility and cancer in humans and animals1.
PAHs can often become degraded, thereby altering its emission profile or environmental destination. Because of this, the ratio of just two compounds of similar molecular weights and physicochemical attributes is calculated, since the isomeric ratios of both compounds remains unchanged from point of release to sampling12,26. Low temperature processes like wood incineration have been reported to release LPAHs, while HPAHs are usually formed from the engine-combustion of fuels27.
PAH levels were evaluated in surface water, suspended particles and sediments of Upper Iguassu watershed in Parana, Brazil by dos Santos et al.28. The application of diagnostic ratios revealed the predominance of 3 to 4 aromatic ringed compounds in surface waters, but the prevalence of 4 to 6 ringed PAHs were observed in suspended particulate matter and sediment. According to Adeniji et al.29, PAHs extensively ranged between 0.0003 - 42,350 µg/L and 0 – 1.266 × 10⁹ µg/kg (dry weight) in water and sediments respectively. Results further showed increasing concentrations in regions of enormous crude oil production, boating, commercial and manufacturing ventures. Furthermore, Adeniji et al.30 reported PAH concentrations in surface water, bottom-profile water and sediment bed samples of Algoa Bay, South Africa, with ranges of <0.01 - 24.66 µg/L, <0.01 – 22.81 µg/L and <0.01 – 5.23 mg/kg respectively. Concentration of PAHs in sediment was significantly greater than the levels found in surface waters of Woji creek in the oil-rich Niger Delta region of Nigeria. In addition, water sample matrices reflected the prevalence of 2 – 3 ringed LPAHs, with sediments showing about 30% and 70% composition for LPAHs and HPAHs respectively. Overall, most of the PAHs revealed petroleum and combustion sources31.
The present study is aimed at reporting PAH concentrations and diagnosing its prevalent contributing sources or identifying the various anthropogenic influences that are impacting sediments of the Imiringi River.
Materials and Methods
Study Area Description and Sample Collection
The study area cuts across the entire Imiringi community. Mainly, the Imiringi River section of the tributary which traverses across the sub-localities of Oswan (OS), Olem (OL), Obodo (OB) and Agothoman (AG), while the direction of water flow comes from Otuasega and Oruma colonies, with the water breaking off at the Emeyal 1 and 2 settlements. Each of the sediment sampling points were geo-referenced with a hand-held Garmin Etrex model GPS. The recorded geographical latitudes and longitudes were (OSSD1 – N4.912, E6.412; OSSD2 – N4.917, E6.406; OSSD3 – N4.917, E6.399; OSSD4 – N4.919, E6.392; OLSD1 – N4.898, E6.374; OLSD2 – N4.887, E6.372; OBSD1 – N4.833, E6.332; OBSD2 – N4.887, E6.372; AGSD1 – N4.822, E6.339; AGSD2 – N4.812, E6.390) (Figure 1). The study area is characterized by two seasons; rainy and dry season. The river is negatively influenced by several anthropogenic inputs such as spilled crude oil from illegal oil bunkering, fuelling of boats and worn-out or failed oil equipment. Also, leachates from farmlands, municipal waste dumps and storm water channels from riverine communities often infiltrate the waterway, thereby contributing to the level of residual contaminants32. As a result, field sampling was conducted in the rainy season month of August 2019. This season was chosen in order to capture contaminants deposition on sediments during the most vulnerable period of the year, which is usually characterized by rising water levels and flooding.
Ten (10) sediments were collected with the use of an Eckmann grab. Samples were transferred into 250 mL glass vials before been transferred into a cooling box packed with ice chips (4 ± 2oC). At the laboratory, sediment samples were immediately air-dried at room temperature (28 ± 2oC) to eliminate moisture. Afterwards, samples were pulverized (crushed and sieved through a 2 mm mesh sieve) before sub-sampling for PAH extraction.
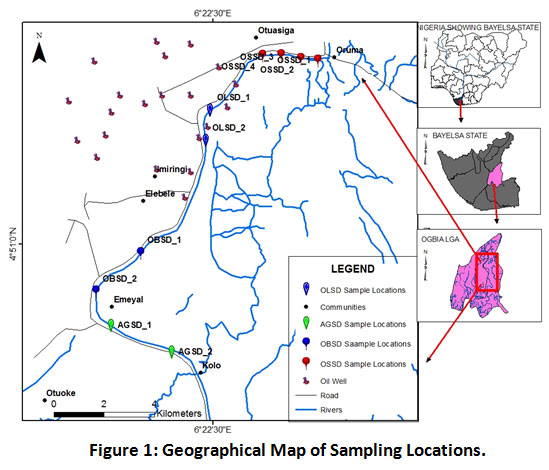 |
Figure 1: Geographical Map of Sampling Locations. Click here to view Figure |
Sample Preparation and Analysis
The extraction method previously applied by Zhao et al.33 was adopted for this study. Sediments were air-dried at room temperature, crushed and sieved through a 2 mm mesh sieve. 5 grams of adequately homogenized sample was weighed and transferred into 50 mL glass vials with Teflon crimp caps, mixed with 2 grams of anhydrous sodium sulphate and vigorously agitated with 15 mL n-hexane/acetone (2:1 v/v) for 10 minutes, before leaving it further submersed in the mixed solvent for an hour. The supernatant was transferred into glass vials; then the residue (sediment) was re-extracted with 15 mL n-hexane/DCM (3:1 v/v). The recovered supernatants were combined into another 50 mL glass vial. Thereafter, the organic partition was rid of moisture by straining through anhydrous sodium sulphate. The organic phase of filtered extract was rinsed by eluting viz; 10 mm I.D (internal diameter) x 250 mm long chromatographic column packed with glass wool, slurry of silica gel and anhydrous sodium sulphate. The cleaned up extract was reconstituted to about 10 mL before being concentrated to about 1.0 mL using a thermally regulated water bath at temperatures between 35oC and 40oC. Results were expressed in concentration units of µg/kg.
Another 5 grams portion of sediment was ceded into a 50 mL glass vial with Teflon crimp caps. The sediment was spiked with pre-deuterated PAH internal standards mix (naphthalene-d8, phenanthrene-d10, chrysene-d12 and perylene-d12). Thereafter, sample mixture was extracted33 and analyzed. The recovery percentage of the internal standard mix was used to ascertain the extraction efficiency (88.0% - 103.0%) (Table 2).
With the use of hypodermic syringe, exactly 1 µL portion of the reconstituted extract was introduced into the injection port of the gas chromatograph - flame ionization detector (GC-FID). PAH components were eluted through the capillary column based on their individual boiling points (BP) and molecular weights (MW). Hence, PAH species of lower BP and MW are known to elute faster. Results were recorded in µg/kg units. The pre-set instrument conditions of the HP 6890 Plus GC-FID are: initial oven temperature (65ºC), final oven temperature (320ºC), injector temperature (275ºC), inlet pressure (14.8 psi), detector temperature (310ºC), inlet condition (split-less), nitrogen flow amount (30 mL/min), hydrogen flow amount (35 mL/min), and air flow rate (250 mL/min). The total analysis run time lasted 30.7 minutes.
Statistical Analysis
Statistical Package for Social Science (SPSS) was used for the descriptive and inferential statistics. By applying hierarchical cluster analysis (HCA), the different PAH compounds were grouped in such manner as to reflect those in the same group, showing similarities to each other (cluster). In addition, the Pearson correlation coefficient matrix (PCCM) and principal component analysis (PCA) were used to perform statistical validation.
Results
PAH Source Identification Ratios
Ratios that were applied for the delineation of PAH sources in the environment included Phe/Ant, Flu/Pyr, Fla/Pyr and LPAH/HPAH (PI) (Table 1).
Table 1: Source Diagnostic Ratios of PAHs in Imiringi Sediment.
|
PAH diagnostic ratios |
PAH source delineation |
||
|
Pyrogenic |
Petrogenic |
Combustion |
|
|
Phe/Ant |
<5 |
>5 |
- |
|
Flu/Pyr |
+1 |
<1 |
- |
|
Fla/Pyr |
<1 |
>1 |
- |
|
LPAH/HPAH (PI) |
- |
- |
<1 |
|
TI |
- |
<4 |
>4 |
Source: Neff et al.34; Motelay-Massei et al.35; Zhang et al.36; Magi et al.37.
Measurement of Equipment Response/Quality Condition
Standard solutions of the different PAH species tested were introduced into samples as spikes, and the recovery rate was determined as a means of ensuring optimum performance of the gas chromatograph – flame ionization detector (GC-FID) instrument. Table 2 depicts the percentage recovery values, as well as the limits of detection and quantification.
Table 2: Quality Assurance and Control Considerations for PAH Analysis.
|
PAH compounds |
Concentration of spike, µg/mL |
Detected concentration, µg/mL |
Percentage recovered, % |
LOD, µg/mL |
LOQ, µg/mL |
|
Nap |
2 |
1.76 |
88.0 |
0.020 |
0.070 |
|
Acy |
2 |
1.80 |
90.0 |
0.030 |
0.100 |
|
Ace |
2 |
1.83 |
91.5 |
0.020 |
0.070 |
|
Flu |
2 |
1.79 |
89.5 |
0.004 |
0.020 |
|
Phe |
2 |
1.99 |
99.5 |
0.010 |
0.040 |
|
Ant |
2 |
1.82 |
91.0 |
0.010 |
0.040 |
|
Fla |
2 |
2.06 |
103.0 |
0.004 |
0.020 |
|
Pyr |
2 |
1.90 |
95.0 |
0.005 |
0.025 |
|
BaA |
2 |
1.86 |
93.0 |
0.004 |
0.020 |
|
Chr |
2 |
1.78 |
89.0 |
0.003 |
0.015 |
|
BbF |
2 |
1.98 |
99.0 |
0.005 |
0.025 |
|
BkF |
2 |
1.85 |
92.5 |
0.004 |
0.020 |
|
InP |
2 |
1.88 |
94.0 |
0.001 |
0.004 |
|
DaA |
2 |
1.81 |
90.5 |
0.008 |
0.030 |
Nap = Naphthalene, Acy = Acenaphthylene, Flu = Fluorene, Phe = Phenanthrene, Ant = Anthracene, Fla = Fluoranthene, Pyr = Pyrene, BaA = Benzo(a)anthracene, Chr = Chrysene, BbF = Benzo(b)fluoranthene, BkF = Benzo(k)fluoranthene, InP = Indeno(1,2,3-cd)pyrene, DaA = Dibenz(a,h)anthracene.
Trends in PAH Species Distribution
Sediment PAHs ranged between <0.01 and 3,965.4 µg.kg-1 across the selected sediment sampling locations of the Imiringi river. The low molecular weight PAHs (LPAHs) consisting of Nap, Acy, Ace, Flu, Phe and Ant, showed a 5.72% distribution, while the high molecular weight PAHs (HPAHs) comprising Fla, Pyr, BaA, Chr, BbF, BkF, InP and DaA accounted for 94.28% of the total PAH mass concentration. Concentrations obtained from this study were lower than the levels of 489 to 5,616 µg.kg-1 recorded by Parra et al.38 for soils and sediments in Southwest Nigeria. Similarly, the range of 44 to 39,000 ng/g reported by Nieuwoudt et al.39 for soils and sediments of Central South Africa mostly exceeded concentrations reported for this study. Contrary to the reported prevalence of 2-, 3- and 4-ring PAHs in the riverine wetland sediments of Chaohu, China, by Wu et al.40, PAHs in the current study environment were dominated by the 5-6 ring PAHs (74.06%), followed by the 4-ring PAHs (20.23%). The least important fractions were the 2-3 ring PAHs (5.71%) (Figure 2). Also, Wu et al.40 reported the uniform distribution of 2-, 3- and 4-ring PAHs in sediments, whilst revealing the predominant concentration of 5 and 6-ring PAHs in surface soil, while Iwegbue et al.41 had reported the PAH-rings distribution order (4 > 6 > 5 > 3 > 2) for household dusts around urban zones in the Niger Delta province, Nigeria. Results of this study compared with Yang et al.42. The author’s had reported the total concentration of 16 PAHs within the range of 3.55 to 3,200 µg.kg-1 with the 4-6 ring HPAHs dominating the PAH profiles at about 83.3% of the total PAH mass.
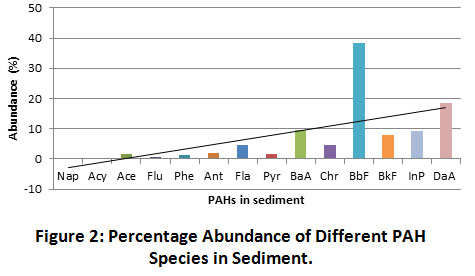 |
Figure 2: Percentage Abundance of Different PAH Species in Sediment. Click here to view Figure |
Trends in Spatial Composition of PAH Compounds
The highest spatial distribution of PAH was observed at the midstream and downstream locations of OLSD1 (45.95%) and OBSD2 (25.56%) respectively (Figure 3). The high tidal movement of water and increased dumping of municipal wastes (trash or garbage) by the riverine communities located towards the mid and downstream sections of the river may have contributed to the increased redistribution of organic pollutants and relative spike in residual PAHs.
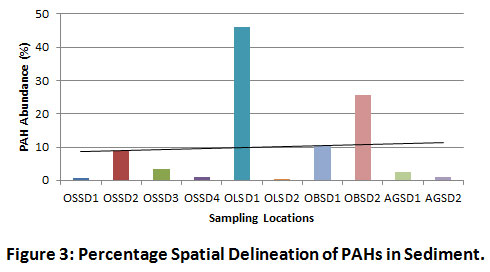 |
Figure 3: Percentage Spatial Delineation of PAHs in Sediment. Click here to view Figure |
Apart from Nap and Acy which showed PAH concentrations below stipulated environmental regulations, the other LPAHs revealed levels exceeding the interim standard quality guidelines (ISQG) and probable effect levels (PEL) of the Canadian Council of Ministers of the Environment (CCME) (Table 3). Furthermore, the total cumulative PAHs mostly exceeded sediment target values (STV), but remained within sediment intervention values (SIV) recommended by the department of petroleum resources (DPR) in Nigeria.
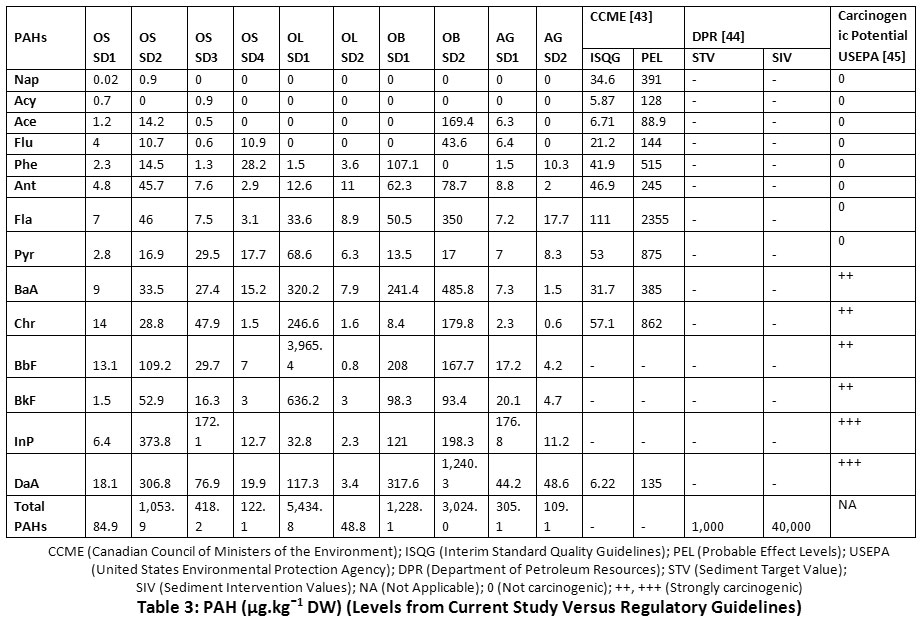 |
Table 3: PAH (µg.kgˉ1 DW) (Levels from Current Study Versus Regulatory Guidelines) Click here to view Table |
Discussion
Correlating Relationships among PAH Species in Sediment
Figure 3 reveals the spatial distribution of PAHs in sediment. The most contaminated sections of the river were OLSD1 midstream (45.95%), OBSD2 downstream (25.56%), OBSD1 downstream (10.38%) and OSSD2 upstream (8.91%). The reasonable level of HPAHs in the midstream section can be attributed to the high tidal movement of organic pollutants from the oil installations located upstream, coupled with the effect of bush burning from nearby farmlands, as well as leachates from waste dumps along river banks. In addition, the influx of storm water draining via community flood channels may have elevated the pyrogenic inputs of the river. Pearson’s correlation coefficient results mostly indicated weak and strong negative correlations among the LPAHs. Some of the identified positive LPAH inter-correlations included Nap/Flu (r = 0.079, p < 0.05), Nap/Ant (r = 0.273, p < 0.05), Ace/Flu (r = 0.960, p < 0.01), Ace/Ant (r = 0.714, p < 0.05), Flu/Ant (r = 0.663, p < 0.05) and Phe/Ant (r = 0.424, p < 0.05). Amongst the LPAHs being studied, Acy and Phe were the most negatively correlating. Overall, HPAHs showed comparatively higher positive inter-correlations with LPAHs. The most significant positive LPAH-to-HPAH inter-correlations are Nap/InP (r = 0.754, p < 0.05), Fla/Ace (r = 0.982, p < 0.01), BaA/Ace (r = 0.740, p < 0.05), DaA/Ace (r = 0.910, p < 0.01), BaA/Ant (r = 0.742, p < 0.05) and DaA/Ant (r = 0.869, p < 0.01). The strongest positive correlation between Fla and Ace is evidence of the similarity of sources (petrogenic), probably due to their closely similar molecular masses (LPAHs). The HPAHs were apparently more positively correlating. Strong positive HPAH inter-correlations were exhibited by BaA/Fla (r = 0.829, p < 0.01), Chr/Fla (r = 0.552, p < 0.05), DaA/Fla (r = 0.966, p < 0.01), Chr/Pyr (r = 0.808, p < 0.01), BbF/Pyr (r = 0.920, p < 0.01), BkF/Pyr (r = 0.919, p < 0.01), BbF/Chr (r = 0.799, p < 0.01), BkF/Chr (r = 0.836, p < 0.01), DaA/Chr (r = 0.511, p < 0.05) and BkF/BbF (r = 0.991, p < 0.01) (Table 4). The strongest HPAH-to-HPAH correlation was between the two isomeric PAH compounds (BkF and BbF). As such, both pyrogenic species are likely being released from a similar source.
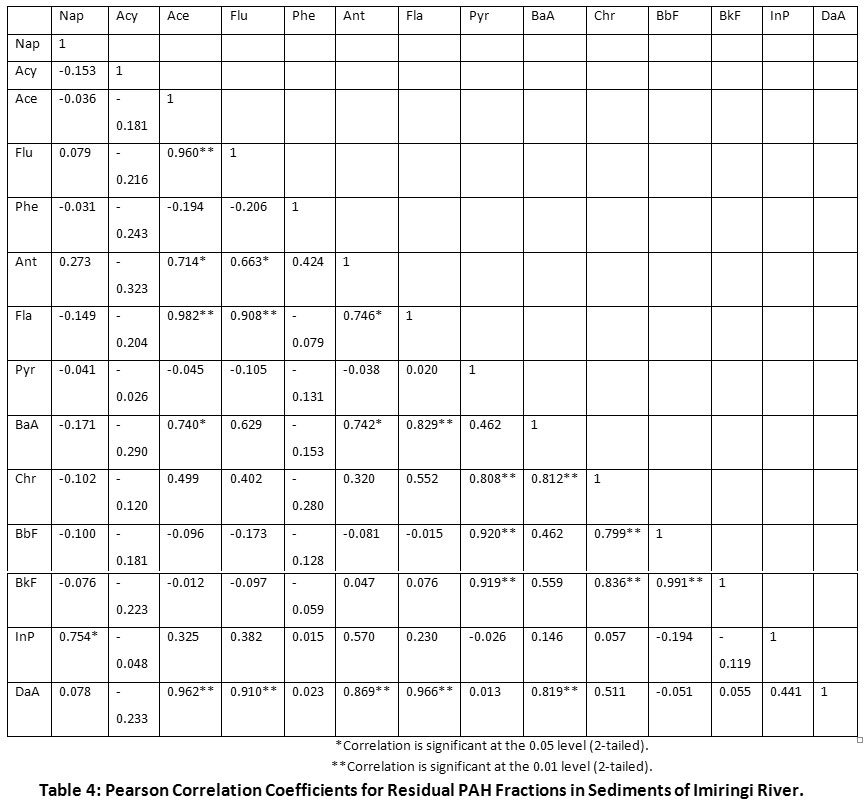 |
Table 4: Pearson Correlation Coefficients for Residual PAH Fractions in Sediments of Imiringi River. Click here to view Table |
Application of PAH Isomeric Ratios and Observed Trends
Figure 3 reveals the spatial distribution of PAHs in sediment. The most contaminated sections of the river were OLSD1 midstream (45.95%), OBSD2 downstream (25.56%), OBSD1 downstream (10.38%) and OSSD2 upstream (8.91%). The reasonable level of HPAHs in the midstream section can be attributed to the high tidal movement of organic pollutants from the upstream oil installations, coupled with the effect of bush burning from nearby farmlands and leachates from waste dumps along river banks. In addition, the influx of storm water from communities, draining via flood channels may have elevated the pyrogenic inputs of the river.
Apart from the upstream (OSSD4) and downstream (AGSD2) locations which revealed petrogenic inputs, the Phe/Ant ratios were mostly less than 5 (< 5), an indication that PAHs are mainly derived from pyrogenic sources (Figure 4). Similarly, the author’s of Gereslassie et al.25 indicated that 14 of the 18 soil sampling stations from Wuhan, Central China had Phe/Ant values less than 5 (< 5), hence PAH sources were sparsely petrogenic. This trend portends that the Imiringi river system is mostly impacted by pyrogenic PAHs emanating from bush burning activities, as well as waste dump leachates, and agricultural run-offs.
Figure 5 shows the distribution trend for Flu/Pyr ratio across the different sampling locations. This ratio was not applicable across all ten sampling stations due to the absence or non-detection of Flu in sediments of OLSD1, OLSD2, OBSD1 and AGSD2 (Table 4). This may be due to evaporation effect [10]. However, two stations (OSSD1 and OBSD2) and 4 stations (OSSD2, OSSD3, OSSD4 and AGSD1) reflected pyrogenic and petrogenic PAH sources respectively. As a result, PAH in the environment can be predominantly attributed to petrogenic inputs. Applying the same ratio, Gereslassie et al. [25] reported the predominance of petrogenic PAHs in soils from Wuhan, China. Similarly, sediments of the Adriatic Sea were sampled by Magi et al.37. The Chioggia section of the coastal environment depicted Flu/Pyr ratios ranging between 0 and 0.12, thereby signifying petrogenic inputs, while the Ancona section depicted a range between 0 and 1.27. Only one sampling point showed a value greater than 1 (> 1), hence, increasing the suspicion that most of the LPAHs may have emanated from either the nearby oil installations or makeshift/artisanal refineries.
The Fla/Pyr ratio reflected superseding pyrogenic influences in the sediment (Figure 6). The sampling stations were dominated by pyrogenic PAHs with values mostly greater than 1 (> 1). Most notably, the downstream location at OBSD2 recorded a ratio of 20.59, showing a considerable spike in pyrogenic inputs in that section of the river. The spike in pyrogenic inputs at the downstream area of the river may have resulted from increased water movement and contaminant deposition, which is typical of the rainy season. Magi et al.37 had reported values ranging from 1.03 and 2.00 for Chioggia and 1.07 to 2.17 for the Ancona section of the Adriatic Sea. The author’s had attributed the presence of PAHs to pyrolytic sources.
Figure 7 shows the pyrogenic index (PI) or LPAH/HPAH ratio. PI values for all sampling locations are less than 1 (< 1), thereby depicting combustion sources. Result of this study was concurrent with those reported in other works25,37. Similarly, values of total index (TI) ratio were greater than 4 (Figure 8), hence, depicting combustion sources as well. A similar report was published by Gereslassie et al.25. The author’s had observed the primary source of residual PAHs in soils form Wuhan, China, to be of combustion origin. Also, Han et al.46 had reported open biomass combustion emissions to be mostly responsible for the prevailing distribution of pyrogenic HPAHs found in air around urban areas of China.
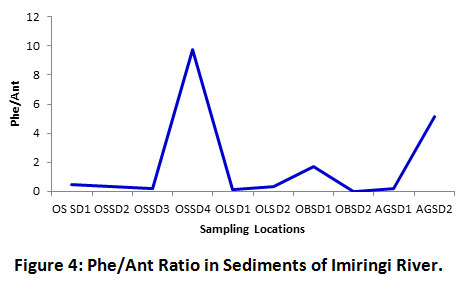 |
Figure 4: Phe/Ant Ratio in Sediments of Imiringi River. Click here to view Figure |
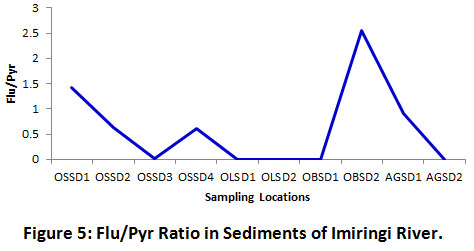 |
Figure 5: Flu/Pyr Ratio in Sediments of Imiringi River. Click here to view Figure |
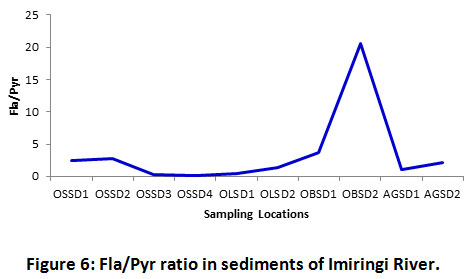 |
Figure 6: Fla/Pyr Ratio in Sediments of Imiringi River. Click here to view Figure |
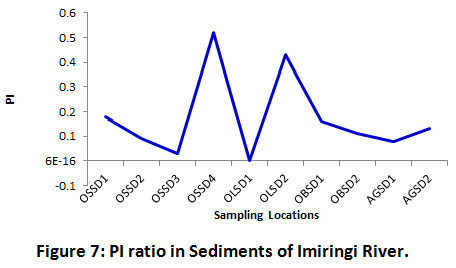 |
Figure 7: PI Ratio in Sediments of Imiringi River. Click here to view Figure |
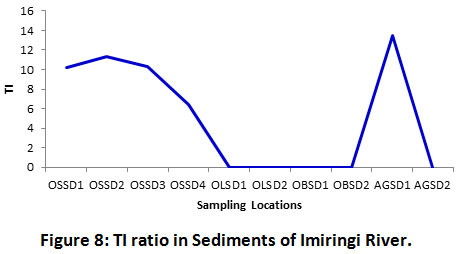 |
Figure 8: TI Ratio in Sediments of Imiringi River. Click here to view Figure |
The dendogram of hierarchical cluster analysis (HCA) of PAH distribution (Figure 9) showed the relationship existing among the different PAH compounds in Imiringi sediment. Results showed strong similarities among the LPAH compounds (2 – 3 membered rings). BkF and BaA revealed strongest dissimilarity with Nap. This may have been due to the undetected levels of Nap in the environment, owing probably to its comparatively higher evaporation or degradation rate10,20. Correlation statistics of different spatial locations of the river (Figure 10) showed strong dissimilarities between the upstream location (OSSD1) and midstream location (OLSD1). This may have resulted from the prevalence of pyrogenic HPAHs in the midstream location. Also, the slight differences observed among other sampling locations can be attributed to variations in petrogenic and pyrogenic inputs. Ilechukwu et al.22 had shown distinct spatial dissimilarities for soils containing reasonable HPAHs within asphalt production plants in Port Harcourt, Nigeria.
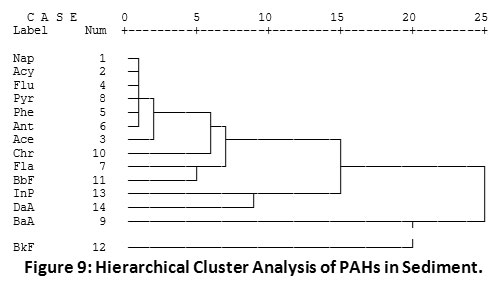 |
Figure 9: Hierarchical Cluster Analysis of PAHs in Sediment. Click here to view Figure |
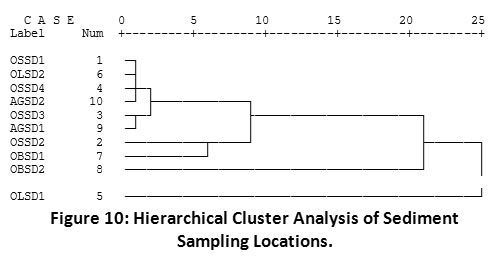 |
Figure 10: Hierarchical Cluster Analysis of Sediment Sampling Locations. Click here to view Figure |
Identification of Principal PAH Species in Sediments of Imiringi River
PCA revealed twelve (12) of all fourteen (14) PAH fractional species examined to be discretely distributed within the cluster: (Nap, Acy, Ace, Flu, Phe, Ant, Fla, Pyr BaA, Chr, BbF, and BkF). On the other hand, two (2) PAH species (InP and DaA) showed the strongest dissimilarity across the field locations (Figure 11). This difference can be attributed to the relatively higher concentrations of “InP” and “DaA”, the principal PAH components found in the sediments. Also, the outlier concentrations of InP and DaA are responsible for the spatial delineation in the PCA plot. Evidently, both PAHs are high molecular weight pyrogenic species. The PCA result compares with the PAH source identification ratios which revealed the predominance of pyrogenic PAHs within the sediment environment (Table 1, Figures 4 - 8). Similarly, hierarchical cluster analysis showed close association between InP and DaA (Figure 9). In addition, InP and DaA showed positive correlation (r = 0.441, p < 0.05) (Table 4).
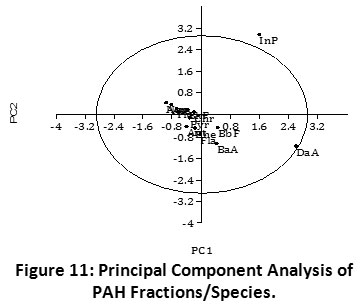 |
Figure 11: Principal Component Analysis of PAH Fractions/Species. Click here to view Figure |
Conclusion
Whilst the results of this study shows petrogenic PAHs to have emanated from spilled crude oil from illegal make-shift refineries and neighbouring oil production facilities, and pyrogenic PAHs to have resulted from agricultural run-offs, deposition of fly-ash from seasonal bush incineration and the leaching of municipal waste or garbage along creek and coast lines. The most significant source of PAHs was biomass and bush incineration. Based on the foregoing, anthropogenic activities within the study area appear to be impacting negatively on the overall quality of the aquatic environment. In order to mitigate the rising PAH levels in the environment, it is pertinent to ensure improved sanitary conditions, as well as discourage bush and biomass combustion within proximity of the Imiringi River.
Acknowledgment
The authors wish to thank Analytical Concept Ltd, Port Harcourt, Nigeria, for providing the laboratory facilities to carry out this research.
Funding Source
The authors received no financial support for the research, authorship, and/or publication of this article.
Conflict of Interest
The authors do not have any conflict of interest.
References
- Ordinioha B, Brisibe S. The human health implications of crude oil spills in the Niger Delta, Nigeria: an interpretation of published studies. Nigerian medical journal: journal of the Nigeria Medical Association 2013; 54(1)10. doi: 10.4103/0300-1652.108887.
CrossRef - Inengite A. K, Oforka N. C, Osuji L. C. Source identification of polycyclic aromatic hydrocarbons in sediments of a creek around a flow station. Int J. Environ. Sci. Technol 2013; 10:519-532. DOI: 10.1007/s13762-013-0177-4.
CrossRef - Aigberua A. O, Ekubo A. T, Inengite A. K, Izah S. C. Evaluation of total hydrocarbon content and polycyclic aromatic hydrocarbon in an oil spill contaminated soil in Rumuolukwu community in Niger Delta. J. Environ. Treat. Tech 2016; 4(4)130-142.
- Aigberua A, Tarawou T, Abasi C. Spatial and seasonal assessment of heavy metals in surface waters of the Middleton River in the Niger Delta, Nigeria. International Journal of Natural Resource Ecology and Management 2017; 2(5)94-98. DOI: 10.11648/j.ijnrem.20170205.12.
CrossRef - Moslen M, Aigberua A. Heavy metals and hydrocarbon contamination of surface water in Azuabie creek within Bonny estuary, Nigeria. J. Appl. Sci. Environ. Manage 2018; 22(7)1083-88. https://dx.doi.org/10.4314/jasem.v22i7.15.
CrossRef - Aigberua A. O. Quantitative oil source fingerprinting and diagnostic ratios: application for identification of soil residual hydrocarbon (SRH) in waste dump areas within oil well clusters. J. Environ. Treat. Tech 2019; 7(2)220-228.
- Kokah D. R, Silas A. D, Akeme-Esuotei, O. N. Rapid assessment of petroleum hydrocarbon contamination in soils: spectroscopy approach. Eng. Appl. Sci 2019; 4(3)66-73.
CrossRef - Bashkaran P. E, Chennippan M, Subramaniam T. Future prediction and estimation of fault occurrences in oil pipelines by using data clustering with time series forecasting. Journal of Loss Prevention in the Process Industries 2020; 66:104203.
CrossRef - Elum Z. A, Mopipi K, Henri-Ukoha A. Oil exploration and its socioeconomic effects on the Niger Delta region of Nigeria. Environmental Science and Pollution Research 2016; 23(13)12880-12889.
CrossRef - Itodo A. U, Akeju T. T, Itodo H. U. Polycyclic aromatic hydrocarbons (PAHs) in crude oil contaminated water from Ese-Odo offshore, Nigeria. Annals of Ecology and Environmental Science 2020; 3(1)12-19.
- Bellas J, Saco-Alvarez L, Nieto O, Beiras R. Ecotoxicological evaluation of polycyclic aromatic hydrocarbons using marine invertebrate embryo-larval bioassays. Marine Pollution Bulletin 2008; 57:493-502.
CrossRef - Tobiszewski M. Application of diagnostic ratios of PAHs to characterize the pollution emission sources. 5th International Conference on Environmental Science and Technology, IPCBEE, 2014; vol.69, IACSIT Press, Singapore. DOI: 10.7763/IPCBEE.2014.v69.9.
- Geptner A. R, Richter B, Pikovskii Y. I, Chernyansky S. S, Alexeeva T. A. Polycyclic aromatic hydrocarbons as evidence of hydrocarbon migration in marine and lagoon sediments of a recent rift zone (Skjalfandi and Oxarfjorour), Iceland. Chemie der Erde – Geochemistry 2006; 66:213-225.
CrossRef - Rhead M. M, Hardy S. A. The sources of polycyclic aromatic compounds in diesel engine emissions. Fuel 2003; 82:285-393.
CrossRef - daSilva D. A. M, Bicego M. C. Polycyclic aromatic hydrocarbons and petroleum biomarkers in Sao Sebastiao channel, Brazil: assessment of petroleum contamination. Marine Environmental Research 2010; 69:277-286.
CrossRef - Atkins A, Bignal K. L, Zhou J. L, Cazier F. Profiles of polycyclic aromatic hydrocarbons and polychlorinated biphenyls from the combustion of biomass pellets. Chemosphere 2010; 78:1385-1392.
CrossRef - Maliszewska-Kordybach B. Sources, concentrations, fate and effects of polycyclic aromatic hydrocarbons (PAHs) in the environment – Part A: PAHs in Air. Pol. J. Environ. Stud 1999; 8:131-136.
- Ostapczuk A, Licki J, Chmielewski A. G. Polycyclic aromatic hydrocarbons in coal combustion flue gas under electron beam irradiation. Radiation Physics and Chemistry 2008; 77:490-496.
CrossRef - Liu X, Bai Z, Yu Q, Cao Y, Zhou W. Polycyclic aromatic hydrocarbons in the soil profiles (0-100cm) from the industrial district of a large open-pit coal mine, China. RSC Adv 2017; 7:28029-28037. http://dx.doi.org/10.1039/C7RA02484C.
CrossRef - Lasson M. Chemical and bioanalytical characteristics of PAH-contaminated soil. Orebro Studies in Chemistry 2013; 13:60. Orebro University.
- Bostrom C. E, Gerde P, Henberg A, Jernstrom B, Johansson C, Kyrklund T, Rannug A, Tornqvist M, Victorin K, Westerholm R. Cancer risk assessment, indicators and guidelines for polycyclic aromatic hydrocarbons in the ambient air. Environmental Health Perspectives Supplement 2002; 110:451-488.
CrossRef - Ilechukwu I, Osuji L. C, Onyema M. O. Source apportionment of polycyclic aromatic hydrocarbons (PAHs) in soils within hot mix asphalt (HMA) plant vicinities. J. Chem. Soc. Nigeria 2016; 41(2)10-16.
- Nekhavhambe T. J, Van Ree T, Fatoki O. S. Determination and distribution of polycyclic aromatic hydrocarbons in rivers, surface runoff and sediments in and around Thohoyandou, Limpopo Province, South Africa. Water SA 2014; 40(3)415-424. DOI: 10.4314/wsa.v40i3.4.
CrossRef - Zhu Y, Yang Y, Liu M, Zhang M, Wang J. Concentration, distribution, source, and risk assessment of PAHs and heavy metals in surface water from the three gorges reservoir, China. Hum. Ecol. Risk Assess 2015; 21:1593-1607. http://dx.doi.org/10.1080/10807039.2014.962315.
CrossRef - Gereslassie T, Workineh A, Liu X, Yan X, Wang J. Occurrence and ecological and human health risk assessment of polycyclic aromatic hydrocarbons in soils from Wuhan, Central China. Int. J. Environ. Res. Public Health 2018; 15:2751. DOI: 10.3390/ijerph15122751.
CrossRef - Yunker M. B, Macdonald R. W, Vingarzan R, Mitchell R. H, Goyette D, Sylvestre S. PAHs in the Fraser River basin: a critical appraisal of PAH ratios as indicators of PAH source and composition. Organic Geochemistry 2002; 33:489-515. http://dx.doi.org/10.1016/S0146-6380(02)00002-5.
CrossRef - Mostert M. M. R, Ayoko G. A, Kokot S. Application of chemometrics to analysis of soil pollutants. Trends in Analytical Chemistry 2010; 29:430-435.
CrossRef - dos Santos M. M, de Almeida Brehm F, Fillippe T. C, Reichert G, de Azevedo J. C. R. PAHs diagnostic ratios for the distinction of petrogenic and pirogenic sources: applicability in the upper Iguassu watershed – Parana, Brazil. Brazilian Journal of Water Resources 2017; v.22,e9. http://dx.doi.org/10.1590/2318-0331.011716084.
CrossRef - Adeniji A. O, Okoh O. O, Okoh A. I. Analytical methods for polycyclic aromatic hydrocarbons and their global trend of distribution in water and sediment: A Review. Intech Open 2018; 19:393-428. http://dx.doi.org/10.5772/intechopen.71163.
CrossRef - Adeniji A. O, Okoh O. O, Okoh A. I. Distribution pattern and health risk assessment of polycyclic aromatic hydrocarbons in the water and sediment of Algoa Bay, South Africa. Environ Geochem Health 2019; 41:1303-1320. https://doi.org/10.1007/s10653-018-0213-x
CrossRef - Ihunwo O. C, Shahabinia A. R, Udo K. S, Bonnail E, Onyema M. O, Dibofori-Orji A. N, Mmom P. C. Distribution of polycyclic aromatic hydrocarbons in Woji creek, in the Niger Delta. Environ. Res. Commun 2019; 1:125001. https://doi.org/10.1088/2515-7620/ab50f2.
CrossRef - Aigberua A, Tarawou T, Erepamowei Y. Environmental assessment of Imiringi River in South-South Nigeria: the water quality index approach. Curr. World Environ 2020; 15(1)59-67. http://dx.doi.org/10.12944/CWE.15.1.09.
CrossRef - Zhao Z, Qin Z, Cao J, Xia L. Source and ecological risk characteristics of PAHs in sediments from Qinhuai River and Xuanwu Lake, Nanjing, China. Hindawi Journal of Chemistry 2017; Article ID3510796. https://doi.org/10.1155/2017/3510796.
CrossRef - Neff J. M, Strout S. A, Gunster D. G. Ecological risk assessment of polycyclic aromatic hydrocarbons in sediments: identifying sources and ecological hazard. Integr Environ Assess Manag 2005; 1:22-33. https://doi.org/10.1897/IEAM_2004a-016.1.
CrossRef - Motelay-Massei A, Ollivon D, Garban B, Tiphagne-Larcher K, Zimmerlin I, Chevreuil M. PAHs in the bulk atmospheric deposition of the Seine river basin: source identification and apportionment by ratios, multivariate statistical techniques and scanning electron microscopy. Chemosphere 2006; 67:312-321. DOI: 10.1016/j.chemosphere.2006.09074.
CrossRef - Zhang X. L, Tao S, Liu W. X, Yang Y, Zuo Q, Liu S. Z. Source diagnostics of polycyclic aromatic hydrocarbons based on species ratios: a multimedia approach. Environmental Science and Technology 2005; 39:9109-9114. https://doi.org/10.1021/es0513741.
CrossRef - Magi E, Bianco R, Ianni C, Di Carro M. Distribution of polycyclic aromatic hydrocarbons in the sediments of the Adriatic sea. Environ. Pollut 2002; 119:91-98. http://dx.doi.org/10.1016/S0269-7491(01)00321-9.
CrossRef - Parra Y. J, Oloyede O. O, Pereira G. M, de Almeida Lima P. H. A, da Silva Caumo S. E, Morenikeji O. A. Polycyclic aromatic hydrocarbons in soils and sediments in Southwest Nigeria. Environmental Pollution 2020; 259:ArticleID113732. https://doi.org/10.1016/j.envpol.2019.113732.
CrossRef - Nieuwoudt C, Pieters R, Quinn L. P, Kylin H, Borgen A. R, Bouwman H. Polycyclic aromatic hydrocarbons (PAHs) in soil and sediment from industrial, residential, and agricultural areas in Central South Africa: an initial assessment. Soil and Sediment Contamination 2011; 20:188-204. http://dx.doi.org/10.1080/15320383.2011.546443.
CrossRef - Wu H, Sun B, Li J. Polycyclic aromatic hydrocarbons in sediments/soils of the rapidly urbanized lower reaches of the River Chaohu, China. Int. J. Environ. Res. Public Health 2019; 16:2302. DOI: 10.3390/ijerph16132302.
CrossRef - Iwegbue C. M, Iteku-Atata E. O. C, Odali E. W, Egobueze F. E, Tesi G. O, Nwajei G. E, Martincigh B. S. Distribution, sources and health risks of polycyclic aromatic hydrocarbons (PAHs) in household dusts from rural, semi-urban and urban areas in the Niger Delta, Nigeria. Exposure and health 2019; 11(3)209-225. https://doi.org/10.1007/s12403-018-0276-z
CrossRef - Yang Y, Woodward L. A, Li Q. X, Wang J. Concentrations, source and risk assessment of polycyclic aromatic hydrocarbons in soils from midway Atoll, North Pacific Ocean. PLoS ONE 2014; 9(1)e86441. DOI: 10.371/journal.pone.0086441.
CrossRef - Canadian Council of Ministers of the Environment (CCME). Canadian sediment quality guidelines for the protection of aquatic life: polycyclic aromatic hydrocarbons (PAHs). In: Canadian environmental quality guidelines, Canadian Council of Ministers of the Environment, Winnipeg, MB, Canada, 1999;pp 2.
- Department of Petroleum Resources (DPR). Environmental guidelines and standards for the petroleum industry in Nigeria. In: Department of Petroleum Resources Handbook, Lagos State, Nigeria. 2018; Rev Ed.pp184.
- United States Environmental Protection Agency (USEPA). Evaluation of the inhalation carcinogenicity of ethylene oxide (in support of summary information on the integrated risk information system (IRIS)). US Environmental Protection Agency, Washington DC, USA. 2016; EPA/635/R-16/350Fc. https://cfpub.epa.gov/si/si_public_record_report.cfm?Lab=NCEA&direntryid=329730
- Han F, Guo H, Hu J, Zhang J, Ying Q, Zhang H. Sources and health risks of ambient polycyclic aromatic hydrocarbons in China. Science of the Total Environment 2020; 698:134229. https://doi.org/10.1016/j.scitotenv.2019.134229.
CrossRef


