Impacts of Urban Floods on Road Connectivity - A Review and Systematic Bibliometric Analysis
Ashok Kadaverugu1,2
*
 , Kasi Viswanadh Gorthi2
and Nageshwar Rao Chintala3
, Kasi Viswanadh Gorthi2
and Nageshwar Rao Chintala3
http://dx.doi.org/10.12944/CWE.16.2.22
Copy the following to cite this article:
Ashok K, Gorthi K. V, Chintala N. R. Impacts of Urban Floods on Road Connectivity - A Review and Systematic Bibliometric Analysis. Curr World Environ 2021;16(2). DOI:http://dx.doi.org/10.12944/CWE.16.2.22
Copy the following to cite this URL:
Ashok K, Gorthi K. V, Chintala N. R. Impacts of Urban Floods on Road Connectivity - A Review and Systematic Bibliometric Analysis. Curr World Environ 2021;16(2). Available From : https://bit.ly/3frqyHX
Download article (pdf) Citation Manager Publish History

Introduction
Floods occur in urban areas even due to low-intensity rainfall due to low infiltration capacity and high run-off generation in the cities.1 The changes in land use due to increased urbanization have modified the hydrological behavior of the cities, thereby generating a quick run-off with less peak flow time. 2-4 Due to insufficient stormwater conveyance and lack of adequate green and blue infrastructure in the urban centers, the cities have become highly vulnerable to floods, 1,5 Especially in developing countries, poor implementation of building bylaws and municipal solid waste management regulations have further impeded the free flow of stormwater through the drains. 1 That causes large-scale inundation of highly dense built-up and road networks inflicting insurmountable loss to human life and property.
The economy of a city is dependent on road connectivity and vice versa. Road transport networks form an essential nexus between the safety and wealth of communities, ensuring uninterrupted economic activity by allowing the movement of goods, services, and people. 6,7 Reliability of any road network is gauged on quality of roads, traffic movement, time of travel, and, more importantly, safety and level of service (according to highway capacity manual). 4,8 Climate change-induced extreme weather events, haphazard urbanization, improper zoning, and uneven traffic trip generation pressure the road infrastructure. Further, several studies indicate the growing concerns on-road transportation due to rapid land-use changes and various socio-economic anthropogenic drivers, and climate change intensification.4,9,10
Road connectivity and mobility become the weakest link in flood mitigation measures. Road connectivity is the key to adequate public infrastructure facilities like community flood relief centers, primary health care centers, emergency managers, and disaster response forces during floods. The adaptive capacity of the cities and the flood-affected neighborhoods are further challenged due to the poor mobility caused by the inundated roads. Due to the disruption of road network connectivity, the city experiences standstill conditions that cause substantial economic losses and traumatic psychological stress to the stranded people on the roads or the buildings. The impacts on roads due to floods are mainly classified as direct impacts such as physical damage to property and transport facilities and indirect effects such as disruption to travel, loss of business, and pollution to slow traffic movement. 11,12 These effects are more significant on the middle and lower-middle income groups in the developing countries.
Hydrological models that simulate the flood inundation are becoming more useful in predicting the extent of flood damage. Remote sensing and GIS methods are complementing the hydrological models in flood vulnerability estimation. The effect of land use land cover on the run-off potential is an important aspect in hydrological models operating on a large spatial extents. Even at the urban scale, the effect of built-up area and urban green spaces affect the flood behavior, according to the storm water infrastructure design and capacity. Besides, the unstructured data in the form of pictures, videos, and text are also being processed using machine learning tools for damage estimation due to natural disasters, especially there are several instances of its application in flood damage estimation.
Although the effect of adverse weather and floods on urban roads and traffic congestion is widely experienced, the non-linear relationship between them is not widely understood and quantified. 4,13,14 At present, there are not many studies to our knowledge addressing the impacts of urban floods on road connectivity. There is a dire need to understand the impacts of floods on road connectivity for effective mitigation policies that alleviate the short-term and long-term damages. In this study, we have consolidated the contemporary scientific knowledge to understand the major themes in the scientific literature related to flood vulnerability and its impacts on road connectivity. Further, the thematic structure in the literature and network analysis of the keywords have been performed using the systematic bibliometric analysis to provide recent developments on the topic to the policymakers and researchers. With this background, we have oriented the present study to address the objectives viz. (a) to review the contemporary scientific knowledge on flood vulnerability and road connectivity, (b) to perform a systematic bibliometric analysis on the literature for deriving thematic structures and evolution patterns in the research.
This paper is organized into four sections. Section 2 of the paper provides the review of literature on urban floods and road network vulnerability studies. Section 3 describes the need and methodology followed for the bibliometric analysis, respectively. The significance of the results based on the various tools utilized in the bibliometric analysis that describe the research structure and themes are also discussed. Lastly, in Section 4, we summarized the conclusion and highlighted the gaps in the research, and provide suggestions for improving the applicability of hydrological models and remote sensing methods for assessing road connectivity in the event of flood situations.
Urban Floods and Road Connectivity
According to the Intergovernmental Panel on Climate Change (IPCC) framework, the vulnerability due to the floods can be quantified by calculating the sub-indices viz. exposure, sensitivity, and adaptive capacity of the communities. The exposure aspect represents the degree and frequency of hazards like floods that disrupt the road network. The sensitivity aspect in this context represents the susceptibility of road connectivity and vehicles to flood inundation and stormwater flow. While the adaptive capacity aspect represents the system's resilience, how fast the communities bounce back to normalcy after being affected by the floods. The entire arena of flood vulnerability can be studied through flood inundation and its impact on road connectivity, viz. (a) the hydrological models and remote sensing methods for estimation of the spatial extent of floods and inundation depth, and (b) studying the road network vulnerability due to the floods and associated damages, both direct and indirect. Ultimately, identification of flood vulnerable zones and affected roads is the outcome that is essential for flood mitigation. The excerpt from the literature review suggests that apart from traditional methods of using hydrological models and remote sensing data for flood extent estimation, the recent applications of crowd-sourced data and social media analysis are on the rise with verified utility. Applications of machine learning (ML), artificial intelligence, and advanced GIS analysis are emerging when analyzing real-time crowd-sourced unstructured information for flood damage estimation (Fig. 1).
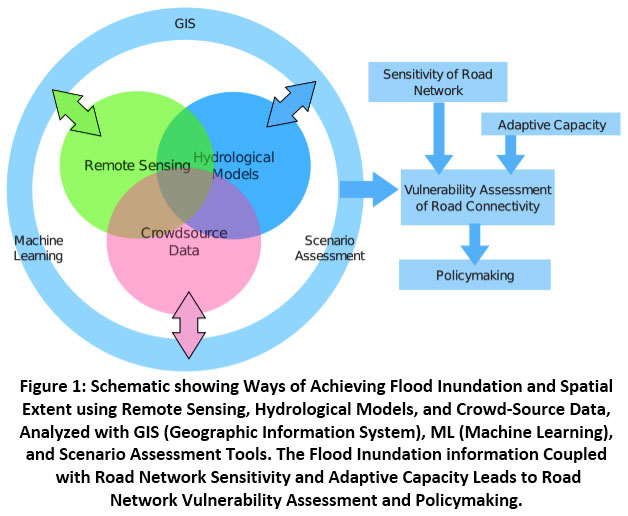 |
Figure 1: Schematic showing Ways of Achieving Flood Inundation and Spatial Extent using Remote Sensing, Hydrological Models, and Crowd-Source Data, Analyzed with GIS (Geographic Information System), ML (Machine Learning), and Scenario Assessment Tools. Click here to view Figure |
Remote Sensing Analysis
Assessment of damage to the built property and road network is imperative for prioritizing disaster response and mitigation measures, which can be studied using remote sensing and GIS tools. 1,15,16 Over the last two decades, the flood extent has been objectively quantified using the remote sensing methods, 17,18 which also helps especially in assessing the vast and inaccessible flooded areas. Recent literature review suggests the applications of both optical (LANDSAT, MODIS, AVHRR, IRS) and Radar (Radarsat, SIR-C, ASAR, AMR-E) satellite systems are vital for flood assessment. Especially optical remote sensing technics offer benefits in post-flood damage assessment. Simultaneously, Radar images aid in assessing the flooding intensity due to its cloud penetration capability. Several advanced imaging sensors using active sensing methods such as Radar provide ground imaging even with high cloud cover. Gao et al. have spatially extrapolated the flood inundation based on multi-source RS data, gauged depth at limited locations, and using GIS techniques. 19 Multi-criteria decision-making using analytical hierarchical process (AHP) to map flood vulnerable zones using RS and GIS methods helps prioritize the mitigation zones. 1,20 Satellite observations combined with ground-truthing and unmanned aerial vehicles (UAV) provide a rapid assessment of the flood extent and inundation in high resolution.21-23 The advantage of UAV is that they can fly below the clouds to capture the unobstructed bird's eye view of the flood extent with multiple sensors. 17
Deep learning and other machine learning tools have also been used to classify the geo-tagged aerial images to identify the damaged infrastructural features due to the floods. The robust training of the models is imperative. 24 However, the availability of large sets of labeled data for unsupervised training has been a significant challenges where significant human engagement is necessary. Mojaddadi et al. have applied ensemble machine learning methods trained with geo-tagged flooding occurrence with the predictor variables like topographical and hydrological variables. 25 The trained model can extrapolate the probability of flood over any location, which is subsequently utilized for spatial vulnerability and hazard mapping. However, the accuracy of modeling is affected by the spatial resolution of the data.
Hydrological Models
Hydrological models use the water balance equation or conservation of mass and momentum for deriving the flood inundation in 1-D, 2-D, or 3-D over a spatial domain. Hydrological processes such as infiltration, evapotranspiration, and surface run-off are solved in a control volume of the discretized mesh of a study area. 26These models adopt different simplifications and assumptions of the Navier-Stokes equation as per the need of the study. Some widely applied hydrological models include but are not limited to MIKE, HEC-HMS (Hydrologic Engineering Center – Hydrologic Modeling System), SWMM (Storm Water Management Model), SWAT (Soil and Water Assessment Tool), OpenFOAM (Open Field Operation and Manipulation), ANUGA (developed by Australian National University and Geoscience Australia), and COMSOL Multiphysics. The accuracy of the models depends on the precipitation data, detail of the solid geometry, surface elevation, and assignment of land use properties in the study domain.
MIKE (www.mikepoweredbydhi.com) is a suite of physics-based deterministic models that account for the physical phenomenon of the hydrological cycle and soil moisture movement between saturated and unsaturated zones. The model simulates the surface and groundwater flow, contaminant transport, sediment transport directly related to watershed management. Due to the requirements of large data sets of high quality for the MIKE, it is preferably applied for small-scale hydrological studies. 27 MIKE-FLOOD model is applied for modeling urban floods, including the effect of stormwater drainage networks. 14 HEC-HMS is a software developed by US Army Corps for simulating complete hydrological processes of a watershed. The model captures the effects of evapotranspiration, infiltration, and other hydrological processes, to simulate and forecast the stream flow. The model also has capabilities to include the sediment transport and water quality simulation, along with the uncertainty assessment.
SWMM is a software developed by the USEPA, which helps understand the capacity of a stormwater network, impact of land use, and influence of climate variability on stormwater design. The model can simulate the run-off for ongoing as well as varying rainfall events. Yang et al., Arjenaki et al., and Vemula et al. have studied the urban flood vulnerability using the SWMM model due to various land-use changes and future precipitation scenarios. 28-30
SWAT is an important and widely used model for simulating the hydrological processes on scales ranging from a small watershed to a river basin-scale. The model can simulate the quantity and quality of surface as well as ground water in the study area. The environmental impacts of land use and land management practices, and climate change on the hydrology can be studied with this model. See Dash et al. and Rajib et al. for more information about the SWAT model.31,32
ANUGA (https://anuga.anu.edu.au/) is a free and open-source hydrological model that solves shallow water wave equations for simulating the inundation due to hydrological events like tsunamis, storm surges, and riverine or urban floods. Recent developments in ANUGA include integrating with the SWMM model to capture the storm drainage in the urban flows. OpenFOAM has been known for multi-phase computational fluid dynamics (CFD) modeling applications at multiple spatial scales, 33,34. However, it's complete potential applications in the field of urban floods are yet to be explored. Unlike the other hydrological models, OpenFOAM is a multi-physics model that fully resolves the 3-D dynamic Navier-Stokes equation of fluids both in single-phase or multi-phase for simulating the flow fields through the complex urban geometry. These high-resolution modeling results are very accurate in flood inundation simulation. However, the prorogation of errors is also very concerning due to the uncertainty in the initial and boundary conditions, making the application of these models very limited on space and time.
Apart from the process-based deterministic flood models, empirical models are based on the experimental relationship between the hydrological response (in terms of run-off generation) as a function of precipitation, land use, and soil characteristics. 1 Manning's roughness and Curve Number data representative of sub-watersheds are main features for empirical models. 35-37 The sub-watershed data on elevation variation, shape variables like perimeter and area, and order of the streams, provide information on the peak discharge time, useful in watershed flood management plans. The role of conceptual model in hydrology is also important, as they help in comprehend the higher level concepts involved in watershed with the help of concept diagram or causal loop diagrams. The role of interconnectedness aspects of various sub-systems involved in a watershed can be visualized with the feedbacks through the concept diagrams. For instance, the network of dams and reservoirs on a river, the elements like recharge by rain, run-off, infiltration, evapotranspiration, drainage, and water supply and distribution points, etc can be visualized through this approach. Few studies have also modeled flood vulnerability using advanced ensemble machine learning algorithms. 38 The inundation maps produced by the hydrological models are overlaid on building footprint to capture the flood-affected zones. 1,30 Similarly, the flood extent maps are overlaid with road networks using GIS to identify vulnerable road networks. The summary about different categories of hydrological models is provided in Table 1.
It is also essential to study the conveyance capacity of the stormwater network in discharging the run-off. The robustness or sufficiency of the stormwater network should be studied for 5-year, 10-year, or higher return period precipitation in that region. Further, the scenario projections concerning climate variability add value in robust planning of city-scale mitigation strategies. 39 For instance, a study by Vemula et al. on Hyderabad City, India, 30 shows that the present stormwater design falls short for future climate change scenarios. The combined information on flooding extent (by accounting for the stormwater drainage conveyance capacity) and potential vulnerability to the road network should culminate into the flood warning system.
Mathematical modeling using deterministic equations, machine learning, and big data analytics of remote sensing data will further enhance flood prediction and vulnerability mapping. Especially for flood inundation mapping, the availability of high-resolution topographic layers is vital, which has remained a challenge in developing countries. Moreover, the flood inundation and vulnerability modeling in the urban centers requires additional data on the building geometry, road networks, and drainage network, which have been a challenge due to the sparsity of the data availability. Information on narrow lanes, tertiary roads, and building blocks are essential input layers in any hydrological model and often not captured in coarser DEM data. 4Efforts should be made to harmonize the urban infrastructure information systems for effective decision making.
Table 1: Summary of different Category of Hydrological Models.
|
Category of Hydrological Models |
Model Name |
|
Process-based models |
MIKE, SWAT, SWMM, HEC-HMS, ANUGA, OpenFOAM, COMSOL and others |
|
Empirical models / data driven models |
Unit hydrograph method, Manning’s roughness equation, Soil Conservation Service-Curve Number method, |
|
Conceptual models |
HBV (Hydrologiska Byrans Vattenavdelning model) and TOPMODEL and others |
Road Network Vulnerability and Vehicle Damage
The road transportation network becomes a preferential path for stormwater due to elevated dividers and kerbside structures. Typically the vulnerable road zones are mapped using the variables like distance from the flood source (streams, rivers, drains, coastline, etc.) and elevation.17 Versini et al. have developed a real-time prototype for a road inundation warning system due to flash floods in the Gard region, France, that worked by identifying the intersections between stream network and roads. 40 Dawod et al. have ranked the sub-watersheds of Makkah city according to the flood volume, then intercepted the road network enveloped within the sub-watersheds and classified the roads respectively according to vulnerability to flooding inundation. 37 For instance, we have classified the sub-watersheds of Hyderabad City, India, into different flood vulnerable zones (Fig. 2) and then overlaid the road network to assess the length of the roads that are prone to flooding. The vulnerability maps are also developed for different return periods of extreme precipitation for disaster preparedness towards extreme events. 26 The accuracy of the warning systems in terms of true positive and false negative rates was evaluated by computing the contingency table between computed risk and reported risk. 40 The non-linearity in the affected road length is a property of road network (number of nodes and order of roads) that becomes inundated, is studied by the Yin et al. over Shanghai City. 26
The decrease in vehicular speed due to flood inundation is often considered a measure to study the performance of any road network. Pregnolato et al. have measured the speed versus flood water depth over Europe and Australia. 7 The information was adapted by Singh et al. in estimating the road vulnerability over Bangalore City, India, by overlaying the flood inundation model output from the MIKE model. 4 Speed reduction is considered to be a measure of road vulnerability due to floods, and the percentage of road length affected due to floods has been estimated for various scenarios. 4
The damage to the vehicles and road network is estimated using the damage-depth curves developed based on localized studies. The ‘road-worthiness’ of the vehicles during the flooded conditions is mainly dependent on vehicular design aspects including the height of air vents and stability (to avoid aquaplaning, tilting, floating, and tipping). 41 During the latest floods in Hyderabad City in October 2020, recorded multiple incidents of vehicles floating aloft in the streets due to the stormwater gush. Several of them have tipped over others and drifted away. It was estimated that thousands of two and four-wheeler vehicles had been damaged due to the stormwater surge. 42 The functional behavior of traffic is also quantified by Pregnalato et al., which they developed a relationship between vehicular speed and depth of water on roads based on video analysis. 7
Recent studies on road network vulnerability have transcended from a purely observational approach to the incorporation of the effects of precipitation on traffic flow, speed, damage to vehicles, and safety. 43-45 Stability of parked vehicles assessed using the threshold flood flow and depth, the orientation of the vehicles, ground gradient, and buoyancy of vehicles are some of the factors in studying damage to parked vehicles. 46 The interaction between flood flow and parked vehicles (blockages to the flow, free-floating vehicles damaging the property, etc.) has been extensively studied and reviewed.47,48 Damages to running vehicles due to hydrological forces, hydroplaning, drag, skidding, and reduced stability are major concerns in assessing the damages to vehicles and the safety of passengers. However, significant studies are not available on quantifying the flood flow alteration due to moving vehicles and vice-versa. GIS network modeling tools and traffic simulation tools are also of help in early warning alert dissemination. The application of hydrodynamic models is widespread in traffic vulnerability models for estimation of inundation depth and calculating the affected road network in terms of loss of connectivity.
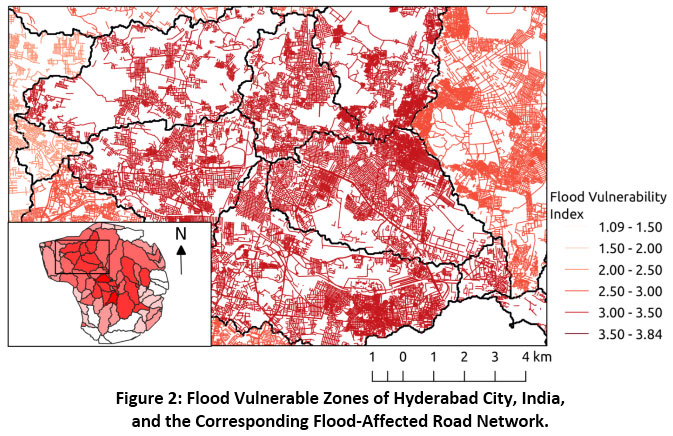 |
Figure 2: Flood Vulnerable Zones of Hyderabad City, India, and the Corresponding Flood-Affected Road Network. Click here to view Figure |
Adequate literature is not available on the post-flood maintenance of the roads and its maintenance strategy. The existing road deterioration (RD) models do not account for the urban flash floods. 49 The framework proposed by Khan et al. accounts for the roughness and rutting-based RD models that estimate the deterioration for a selected extreme flood event and provides the budgetary estimates for road maintenance for the fund-constrained and unconstrained scenarios. 47
Flood Damage Assessment Using Unstructured Data
Several unstructured and non-authoritative data from crowd-sourced flood information through social media posts (e.g., Tweets, Facebook posts), pictures, videos, newspaper articles, and volunteered geographic information (VGI) have been used to augment the flood vulnerability simulations. 17,50 The data obtained from the public dubbed as "wisdom of crowds" provide rapid and real-time information that can be channelized using advanced machine learning and artificial intelligence algorithms for drawing prioritization plans during disasters. 51,52 Analysis of YouTube videos captured by the journalists, citizens, and data provided in Google Maps, Wikipedia, Open Street Maps, etc., provide valuable information for the flood analysis after pre-processing and expert analysis. The flood depth interpreted from the non-authoritative data (from the pictures, videos) can be extracted using the expert opinion that can be geo-tagged on a city map for spatial interpolation using Kriging and other spatial technique. Albuquerque et al. have shown that the tone of tweets reported from the flood-affected area is significantly different from other areas; hence the social media posts from the affected zones are surrogate means for hazard probability identification. 53 A few studies have reviewed and demonstrated a rapid flood inundation model by analyzing the social media posts using Bayesian statistics. 54,55 Schnebele et al. have identified the vulnerable road network due to coastal storm surge using the integration of non-authoritative flood information with the flood warning data and hydrological models. 17
Bibliometric Analysis
Bibliometric analysis has the potential to introduce a transparent and reproducible review process for summarizing the scientific literature. The bibliometric analysis is an objective method to identify the intellectual structure of the research with several metrics that identify the influential works, sources, and other research trends. 56,57 Several advanced methods, including citation analysis, keywords co-occurrence analysis, cluster analysis, etc., explore the research arena's underlying thematic structures. Our work aims to bring awareness about urban floods and their damages to road connectivity. Municipal officials, urban policymakers, funding agencies, and environmental activists can draw significant conclusions from this review for improved decision-making. We have also identified the key research challenges, gaps that remained largely unaddressed.
This study aims to synthesize the contemporary scientific literature reported in the peer-reviewed web of science database characterizing the urban floods and their impact on road connectivity. We used bibliometric analysis tools for understanding the research structure. The analysis included published articles from 1977 to 2020. Several advanced techniques available with the bibliometrix library (www.bibliometrix.org) of R programming language were used in the study, utilizing the articles' metadata on authors, citations, country, and keywords. The structure of existing research, evolution of trends, and dimensionality reduction techniques captures the evolution of the scientific literature in the last decades and highlight what needs to be done in the future.
Data Retrieval
The bibliometric analysis began with downloading the articles having the words "flood" and "road" in the titles hosted by the Web of Science (WoS) database. The articles indexed by the WoS are regarded as highly credible, having undergone rigorous peer review. Although several other scholarly sources like Scopus and Google scholar are available, we have utilized the WoS database. The search criteria threw up 115 articles published between 1977 and 2020 (summarized in Table 2). We extracted the articles' metadata in terms of author keywords, keywords-plus, words in the titles, journals, and global and local citations. The keywords-plus words are different from author keywords. They are produced from the specialized text mining algorithm specific to the WoS. The keywords-plus captures the deep context of the documents from the text and titles of cited references, which may not be reflected in author keywords.56
Table 2: Summary of Research Papers used in Bibliometric Analysis.
|
Description |
Results |
|
Documents |
115 |
|
Sources |
79 |
|
Keywords-plus |
248 |
|
Author keywords |
347 |
|
Average citations per document |
11.4 |
|
Authors per document |
3.3 |
|
Co-Authors per document |
3.81 |
|
Collaboration index |
3.52 |
|
Study period |
1977-2020 |
Research Trends
The body of literature grew tremendously after 2010, having an annual average growth rate of 13.39% (1977-2019), which recorded 14 and 15 papers per year in 2018 and 2019, respectively (Fig. 3). Countries (frequency of authors) of the authors that appeared in the database are in the order of viz. the USA (96), China (56), United Kingdom (30), Australia (23), and France (21). The most relevant sources are being – Journal of Hydrology, Natural Hazards, Natural Hazards and Earth System Sciences, Sustainability, Environmental Earth Sciences, and International Journal of Disaster Risk Reduction. These sources ranked in the top few journals list. They classified as zone-1 according to Bradford's law, which has maximum information available in these top few sources (includes 39 documents out of 115) having the average citation per document as 20.54. The source dynamics show that the cumulative articles published per year have been increasing in these journals than the rest (figure not shown). Most locally cited sources from the reference list of the 115 documents include Journal of Hydrology (128 citations), Natural Hazards (77), Natural Hazards and Earth Systems (47), Water Resource Research (44), and Transport Research Record (39). Most globally cited articles and their keywords are summarized in Table 3. Total global citations of a document are referred to the number of instances the document has been cited in the WoS database. In contrast, the total local citations of a document are the number of times the document is cited within the 115 articles used for the bibliometric analysis. The title and author keywords of the most globally cited works reflect the utility of remote sensing methods, hydrological models, geomorphological or topographical data for achieving urban floods or pluvial flood inundation estimation for road network vulnerability assessment. The recent trends in the utilization of crowd-sourced data, machine learning, and mobile applications are more reflected in the latest papers published after 2018 (based on author keywords, Fig. 4).
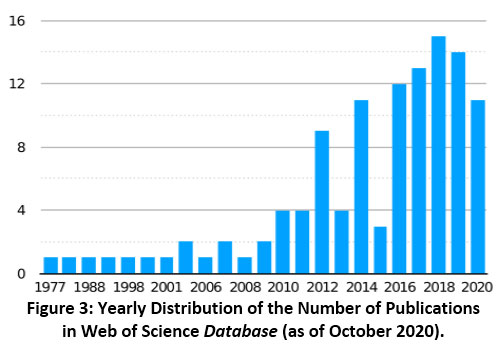 |
Figure 3: Yearly Distribution of the Number of Publications in Web of Science Database (as of October 2020). Click here to view Figure |
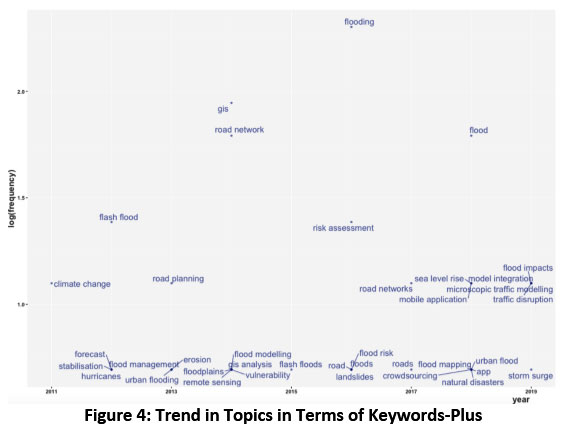 |
Figure 4: Trend in Topics in Terms of Keywords-Plus. Click here to view Figure |
Table 3: Top Five Globally Cited Articles and its Keywords (as of October 2020).
|
Authors |
Title |
Author Keywords |
Keywords-plus |
Total global citations |
Total |
|
57 |
Flash flood risk estimation along the St. Katherine road, Southern Sinai, Egypt using GIS-based morphometry and satellite imagery |
Flash foods, Risk, LANDSAT-ETM, SRTM, GIS, Egypt, Geomorphology, Morphometry, Remote Sensing |
Channel networks, Model, Radar, Watersheds, Management, Regions |
154 |
2 |
|
58 |
Vulnerability of Hampton Roads, Virginia to storm surge flooding and sea-level rise |
Storm-surge flooding, Hurricanes, Sea-level rise, Climate change, Coastal Hazards, Coastal development, Vulnerability |
County |
123 |
3 |
|
59 |
Effects of forest roads on flood flow in the Deschutes River, Washington |
Forest road drainage, Hydrologic modeling, Hydrologic effects of logging, Peak streamflow |
Terrain, Model |
94 |
0 |
|
26 |
Evaluation of the impact and risk of pluvial flash flood on intra-urban road network: A case study in the city center of Shanghai, China |
Pluvial flash flood, Intra-urban, Road network, Risk assessment, Shanghai |
Diffusion-wave treatment, Climate-change, Model, Urbanization, Disaster, System, Damage |
89 |
9 |
|
7 |
The impact of flooding on road transport: A depth-disruption function |
Flooding, Transport, Network, Impact |
Climate-change, Damage, Risk, Network, Weather, Precipitation, Resilience, Velocity, Vehicles |
67 |
0 |
Research Structure
A Three-field plot drawn among the high-frequency words appeared in the titles of the manuscripts, author-keywords, and the journal sources reflect the research connections. The top 10-11 instances are plotted for simplicity in representation (Fig. 5). The pattern indicates that the manuscript titles have the words — floods or flooding, road or roads, and network-leading to the author keywords viz. urban, GIS, risk assessment, traffic modeling, and traffic disruption. Frequency analysis of the author keywords also indicates that the terms related to floods, GIS modeling, road networks, flash floods, risk assessment, and climate change have appeared the most compared to others (word Tree-Map is shown in Fig. 6, the size of the box is correlated with word frequency). At the same time, the frequency of keywords-plus in the descending order is viz. Model, Impact, Climate change, Impacts, Risk, Vulnerability, Network, Resilience, Damage, and Management. Micro-management of traffic networks in flash floods using mobile applications with crowd-sourcing information is on the rise but reflected with relatively more minor frequency as they are yet to be streamlined.
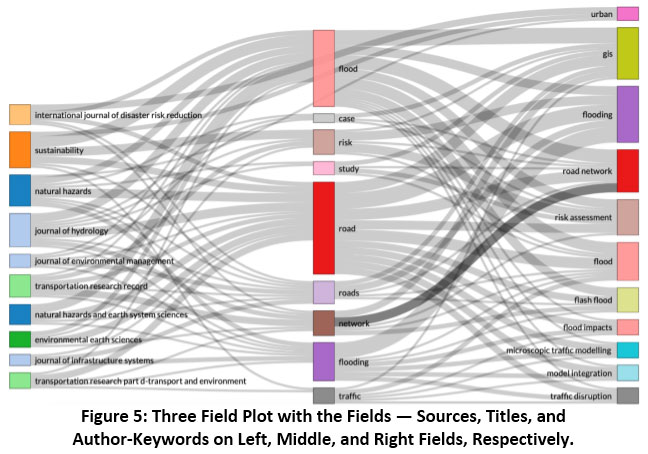 |
Figure 5: Three Field Plot with the Fields - Sources, Titles, and Author-Keywords on Left, Middle, and Right Fields, Respectively. Click here to view Figure |
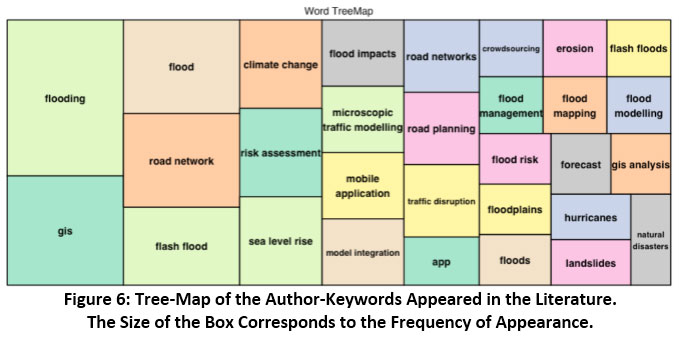 |
Figure 6: Tree-Map of the Author-Keywords Appeared in the Literature. The Size of the Box Corresponds to the Frequency of Appearance. Click here to view Figure |
Co-occurrences of the Keywords-plus developed using the Louvain clustering algorithm, and Kamada & Kawai layout (shown in Fig. 7) delineates the co-occurring keywords-plus according to different color schemes. Jaccard network normalization scheme was utilized to remove the biases due to fewer keywords-plus for a particular document. We considered only 30 nodes and removed the isolated nodes for improved legibility. The words appearing at the center of a cluster are high-frequency words. They are most connected with others, whereas the words appearing at the edges are less frequent and least connected. There are four central clusters/themes arrived out of the co-occurrence analysis of keywords-plus viz. (a) identification of vulnerability (fatalities using hydrological models), (b) risk (impacts of flash floods on road network), (c) application of the models (to estimate the damage to the urban infrastructure considering the resilience of urban systems), and (d) resilience and mitigation related to floods (including the effects of climate change and urbanization).
Further co-occurrence analysis on author keywords arrives at five clusters, which broadly overlap with the keywords-plus analysis, except with an additional cluster highlighting the theme on applications of crowd-sourced data and mobile applications. The list of words that appeared in different clusters or themes is provided in Table 4. The research structure observed using the bibliometric analysis agrees with the literature review provided in Section 2.
Table 4: Appearance of Keywords-Plus and Author Keywords According to the Co-Occurrence Network Analysis.
|
Keywords-plus |
|
|
|
|
|
Cluster-1 |
Cluster-2 |
Cluster-3 |
Cluster-4 |
|
|
Climate-change |
impacts |
system |
Vulnerability |
|
|
Risk |
city |
Framework |
Fatalities |
|
|
Network |
Transportation |
Model |
Gard region |
|
|
Transport |
performance |
inundation |
September 2002 |
|
|
Impact |
Resilience |
Least-square-regression |
Water |
|
|
Damage |
Infrastructure |
|
Ecosystems |
|
|
Weather |
precipitation |
|
|
|
|
Management |
Flash-flood
|
|
|
|
|
Urbanization |
Climate |
|
|
|
|
|
design |
|
|
|
|
|
Events |
|
|
|
|
Author keywords |
|
|
|
|
|
Cluster-1 |
Cluster-2 |
Cluster-3 |
Cluster-4 |
Cluster-5 |
|
Floods impacts |
Floods |
Flooding |
Vulnerability |
Road network |
|
Microscopic traffic modeling |
Sea level rise |
Risk assessment |
Hurricanes |
Flash floods |
|
Model integration |
Mobile application |
Roads |
GIS analysis |
Natural disasters |
|
Traffic disruption |
App |
Flood risk |
Climate change |
GIS |
|
Road networks |
Crowd-sourcing |
Erosion |
|
Flood mapping |
|
Flood modeling |
|
Road planning |
|
Remote sensing |
|
|
|
Landslides |
|
|
Another co-occurrence analysis on keywords-plus using multiple corresponding analysis (MCA) spreads the words on two dominating dimensions (in Euclidean space) after the dimensionality reduction (Fig. 8). The figure is plotted by considering 30 keywords-plus words and clustered into four groups for better comprehension. The words which are positioned together share a common theme because a large number of articles have treated them together. In contrast, the words are placed apart if a relatively less number of articles discusses these keywords together. 62 Results show that the words related to floods, inundation, transportation, damage, and climate change are closely used in more papers, representing modeling the floods as a central theme in the literature. Further, the clusters representing vulnerabilities, damages to ecosystems, and urbanization are not well connected with the central theme, or these concepts have started evolving recently.
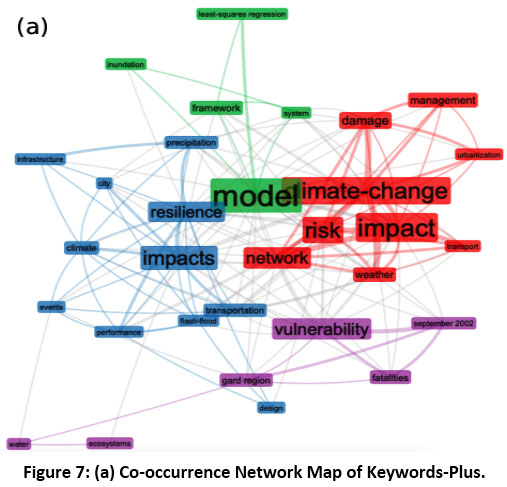 |
Figure 7(a): Co-occurrence Network Map of Keywords-Plus. Click here to view Figure |
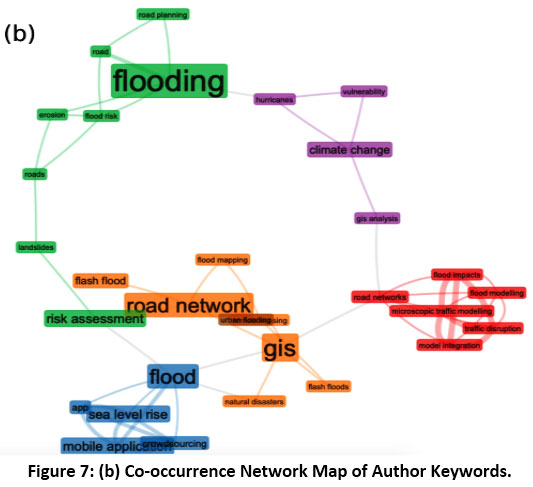 |
Figure 7(b): Co-occurrence Network Map of Author Keywords. Click here to view Figure |
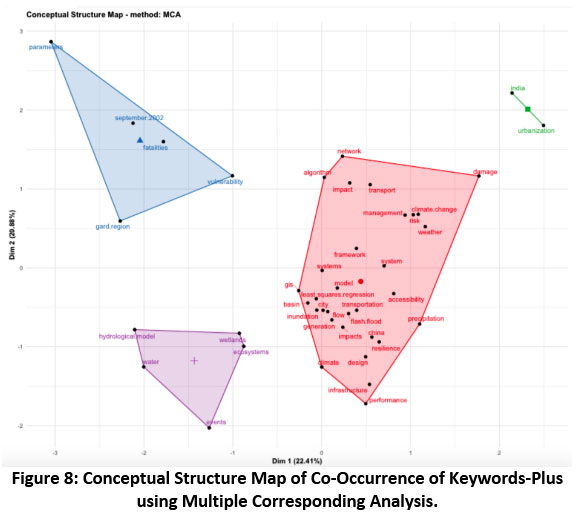 |
Figure 8: Conceptual Structure Map of Co-Occurrence of Keywords-Plus using Multiple Corresponding Analysis. Click here to view Figure |
Thematic analysis of the existing research divides the research into four different quadrants on axes representing centrality (on the vertical axis) and density (on the horizontal axis). 63 The density corresponds to the maturity of a theme based on the strength of ties among the keywords. At the same time, the centrality corresponds to the importance of a theme based on its ties with other themes, which reflects the overall contribution made to the research. Thematic maps are drawn from the centrality and density of the significant clusters obtained from the co-occurrence analysis of keywords-plus words (Fig. 9). The topics have been segregated into four quadrants representing the motor themes, basic themes, evolving or diminishing themes, and highly developed themes. The figure shows that the topics (and sub-topics) in the motor theme quadrant are resilience (flash floods, china, performance) and events (hydrological models, wetlands, ecosystems). The topics (and sub-topics) in the primary research quadrant are mainly impacts (city, urbanization, transportation network, climate change, risk, algorithm, accessibility) and Vulnerability (fatalities, parameters, Gard region). Evolving themes are GIS-based research, which appeared in the quadrant reflecting evolving or diminishing themes. Lastly, inundation, climate (precipitation, infrastructure), and model (framework, systems, basins, least-square-regression) are reflected in the leading themes quadrant.
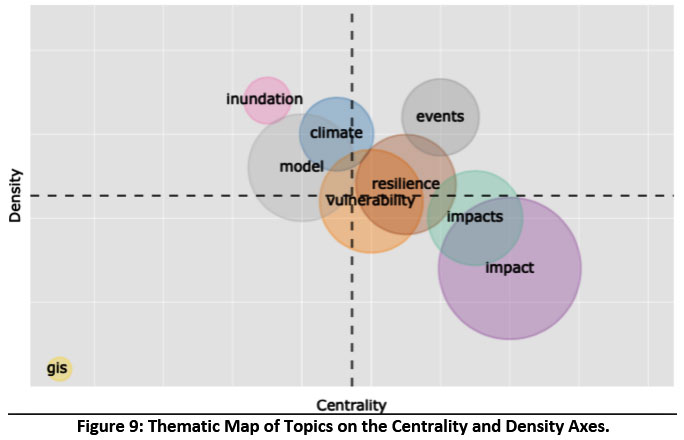 |
Figure 9: Thematic Map of Topics on the Centrality and Density Axes. Click here to view Figure |
Limitations of the Study
In the present study, the bibliometric analysis is limited to the research papers indexed in the Web of Science database. The scope of the present study can be expanded by considering the research papers indexed in other databases such as Scopus or Google Scholar and others. Nevertheless, it is believed that the qualitative structure derived from these databases will primarily portray a similar thematic structure. The scope of the bibliometric study can be further increased by considering the keywords that appeared in the abstract and titles of the papers. Further, moderation of keywords before the co-occurrence analysis would enhance the thematic or structural analysis of the research.
Conclusions
The study is aimed to present a systematic literature review from the articles having the words "flood" and "road" in their titles indexed in the Web of Science database from 1977-2020. The analysis provides a structured methodology to consolidate a considerable volume of research. The temporal evolution of research themes, shifts in disciplines, and the "big picture" of the research landscape can be extracted. We observed an increase in the interest in the studies on flood vulnerability and road networks since 2010. A wide range of applications including but not limited to remote sensing, GIS, hydrological models, volunteered geographical information (social media posts, pictures, videos), crowd-sourced data collection using mobile applications have been tested for mapping the flood vulnerability of road networks. Results indicate a shift in the approach of flood modeling at urban scales from conventional hydrological modeling to the utilization of crowd-sourced data and mobile applications for near real-time flood risk assessment. The importance has been increased towards the identification of vulnerabilities and the development of mitigation strategies. Further, experimental studies related to vehicle damage are also on the rise, which provides ground data for estimating the overall direct damage to the vehicles.
In the light of the climate-induced increase in the frequency of extreme weather events like shifts in rainfall intensity and frequency, the focus should be more drawn towards making human systems more resilient. Identification of flood vulnerable zones is vital in designing localized resilience strategies. There is a need to mainstream the science-based adaptation strategies with the indigenous and local knowledge by including all the stakeholders on board while framing the flood mitigation policies. Applying nature-based solutions in flood mitigation is a win-win solution that provides employment opportunities to the locals, secures the catchment from flooding, and reduces economic damage. The role of socio-cultural and traditional knowledge is to be given equal importance along with the science-based approaches in devising the flood mitigation policies, which increases people's participation and connectedness with their localities and increases their awareness of the importance of natural systems and their services. A fusion of benefits from optical sensors, Radar, Lidar, crowd-sourced data, and high-resolution land use data (such as building information, land use classification, etc.), along with advanced GIS techniques (along with deep learning, machine learning, and big data analytics) and monitoring vehicles (unmanned aerial vehicles, drones, flow flight surveys, etc) will have to blend to achieve flood assessment. Further, there should be a framework for harmonizing the multi-scale data from variegated sources to bring uniformity in flood vulnerability research to prepare an improved roadmap for making human settlements resilient towards natural calamities.
Funding Source
The research did not receive any specific grant from funding agencies in the public, commercial or not-for-profit sectors.
Conflict of Interest
The authors declare that they have no conflict of interest.
Acknowledgments
The authors sincerely thank the support extended by the Commissioner of Technical Education, Telangana State and Director of Jawaharlal Nehru Technological University, Hyderabad.
References
- Kadaverugu A, Nageshwar Rao C, Viswanadh GK. Quantification of flood mitigation services by urban green spaces using InVEST model: a case study of Hyderabad city, India. Model Earth Syst Environ. 2021;7(1):589-602. doi:10.1007/s40808-020-00937-0.
CrossRef - Huong HTL, Pathirana A. Urbanization and climate change impacts on future urban flooding in Can Tho city, Vietnam. Hydrol Earth Syst Sci. 2013;17(1):379-394. doi:https://doi.org/10.5194/hess-17-379-2013.
CrossRef - Miller JD, Kim H, Kjeldsen TR, Packman J, Grebby S, Dearden R. Assessing the impact of urbanization on storm runoff in a peri-urban catchment using historical change in impervious cover. J Hydrol. 2014;515:59-70. doi:10.1016/j.jhydrol.2014.04.011.
CrossRef - Singh P, Sinha VSP, Vijhani A, Pahuja N. Vulnerability assessment of urban road network from urban flood. Int J Disaster Risk Reduct. 2018;28:237-250. doi:10.1016/j.ijdrr.2018.03.017.
CrossRef - Avinash S. FLOOD RELATED DISASTERS: CONCERNED TO URBAN FLOODING IN BANGALORE, INDIA. Int J Res Eng Technol. 2014;03(28):76-83. doi:10.15623/ijret.2014.0328013.
CrossRef - Rodrigue J-P, Notteboom T. 3.1 – Transportation and Economic Development. In: The Geography of Transport Systems. ; 2013. https://transportgeography.org/?page_id=5260.
- Pregnolato M, Ford A, Wilkinson SM, Dawson RJ. The impact of flooding on road transport: A depth-disruption function. Transp Res Part Transp Environ. 2017;55(Supplement C):67-81. doi:10.1016/j.trd.2017.06.020.
CrossRef - Koetse MJ, Rietveld P. The impact of climate change and weather on transport: An overview of empirical findings. Transp Res Part Transp Environ. 2009;14(3):205-221. doi:10.1016/j.trd.2008.12.004.
CrossRef - Goswami BN, Venugopal V, Sengupta D, Madhusoodanan MS, Xavier PK. Increasing Trend of Extreme Rain Events Over India in a Warming Environment. Science. 2006;314(5804):1442-1445. doi:10.1126/science.1132027.
CrossRef - Ramesh Kumar MR, Krishnan R, Sankar S, Unnikrishnan AS, Pai DS. Increasing Trend of “Break-Monsoon” Conditions Over India—Role of Ocean–Atmosphere Processes in the Indian Ocean. IEEE Geosci Remote Sens Lett. 2009;6(2):332-336. doi:10.1109/LGRS.2009.2013366.
CrossRef - Brown S, Dawson R. Building network-level resilience to resource disruption from flooding: Case studies from the Shetland Islands and Hurricane Sandy. Lang M, Klijn F, Samuels P, eds. E3S Web Conf. 2016;7:04008. doi:10.1051/e3sconf/20160704008.
CrossRef - Hammond M j., Chen A s., Djordjevi? S, Butler D, Mark O. Urban flood impact assessment: A state-of-the-art review. Urban Water J. 2015;12(1):14-29. doi:10.1080/1573062X.2013.857421.
CrossRef - Hooper E, Chapman L, Quinn A. Investigating the impact of precipitation on vehicle speeds on UK motorways: Investigating the impact of precipitation on vehicle speeds. Meteorol Appl. 2014;21(2):194-201. doi:10.1002/met.1348.
CrossRef - Pyatkova K, Chen AS, Djordjevi? S, et al. Flood Impacts on Road Transportation Using Microscopic Traffic Modelling Techniques. In: Behrisch M, Weber M, eds. Simulating Urban Traffic Scenarios. Lecture Notes in Mobility. Springer International Publishing; 2019:115-126. doi:10.1007/978-3-319-33616-9_8.
CrossRef - Ehrlich D, Guo HD, Molch K, Ma JW, Pesaresi M. Identifying damage caused by the 2008 Wenchuan earthquake from VHR remote sensing data. Int J Digit Earth. 2009;2(4):309-326. doi:10.1080/17538940902767401.
CrossRef - Frey D, Butenuth M. Trafficability analysis after flooding in urban areas using probabilistic graphical models. In: 2011 Joint Urban Remote Sensing Event. IEEE; 2011:345-348. doi:10.1109/JURSE.2011.5764790.
CrossRef - Schnebele E, Cervone G, Waters N. Road assessment after flood events using non-authoritative data. Nat Hazards Earth Syst Sci. 2014;14(4):1007-1015. doi:10.5194/nhess-14-1007-2014.
CrossRef - Malinowski R, Groom GB, Heckrath G, Schwanghart W. Do Remote Sensing Mapping Practices Adequately Address Localized Flooding? A Critical Overview. Springer Sci Rev. 2017;5(1-2):1-17. doi:10.1007/s40362-017-0043-8.
CrossRef - Gao W, Shen Q, Zhou Y, Li X. Analysis of flood inundation in ungauged basins based on multi-source remote sensing data. Environ Monit Assess. 2018;190(3):129. doi:10.1007/s10661-018-6499-4.
CrossRef - Franci F, Bitelli G, Mandanici E, Hadjimitsis D, Agapiou A. Satellite remote sensing and GIS-based multi-criteria analysis for flood hazard mapping. Nat Hazards. 2016;83(S1):31-51. doi:10.1007/s11069-016-2504-9.
CrossRef - Wang Y, Colby JD, Mulcahy KA. An efficient method for mapping flood extent in a coastal floodplain using Landsat TM and DEM data. Int J Remote Sens. 2002;23(18):3681-3696. doi:10.1080/01431160110114484.
CrossRef - Brivio PA, Colombo R, Maggi M, Tomasoni R. Integration of remote sensing data and GIS for accurate mapping of flooded areas. Int J Remote Sens. 2002;23(3):429-441. doi:10.1080/01431160010014729.
CrossRef - Karamuz E, Romanowicz RJ, Doroszkiewicz J. The use of unmanned aerial vehicles in flood hazard assessment. J Flood Risk Manag. 2020;13(4):e12622. doi:https://doi.org/10.1111/jfr3.12622.
CrossRef - Yang L, Cervone G. Analysis of remote sensing imagery for disaster assessment using deep learning: a case study of flooding event. Soft Comput. 2019;23(24):13393-13408. doi:10.1007/s00500-019-03878-8.
CrossRef - Mojaddadi H, Pradhan B, Nampak H, Ahmad N, Ghazali AH bin. Ensemble machine-learning-based geospatial approach for flood risk assessment using multi-sensor remote-sensing data and GIS. Geomat Nat Hazards Risk. 2017;8(2):1080-1102. doi:10.1080/19475705.2017.1294113.
CrossRef - Yin J, Yu D, Yin Z, Liu M, He Q. Evaluating the impact and risk of pluvial flash flood on intra-urban road network: A case study in the city center of Shanghai, China. J Hydrol. 2016;537:138-145. doi:10.1016/j.jhydrol.2016.03.037.
CrossRef - Devi GK, Ganasri BP, Dwarakish GS. A Review on Hydrological Models. Aquat Procedia. 2015;4:1001-1007. doi:10.1016/j.aqpro.2015.02.126.
CrossRef - Yang Q, Zhang S, Dai Q, Yao R. Improved Framework for Assessing Vulnerability to Different Types of Urban Floods. Sustainability. 2020;12(18):7668. doi:10.3390/su12187668.
CrossRef - Arjenaki MO, Sanayei HRZ, Heidarzadeh H, Mahabadi NA. Modeling and investigating the effect of the LID methods on collection network of urban runoff using the SWMM model (case study: Shahrekord City). Model Earth Syst Environ. Published online June 30, 2020. doi:10.1007/s40808-020-00870-2.
CrossRef - Vemula S, Raju KS, Veena SS, Kumar AS. Urban floods in Hyderabad, India, under present and future rainfall scenarios: a case study. Nat Hazards. 2019;95(3):637-655. doi:10.1007/s11069-018-3511-9.
CrossRef - Dash SS, Sahoo B, Raghuwanshi NS. A novel embedded pothole module for Soil and Water Assessment Tool (SWAT) improving streamflow estimation in paddy-dominated catchments. J Hydrol. 2020;588:125103. doi:10.1016/j.jhydrol.2020.125103.
CrossRef - Rajib A, Liu Z, Merwade V, Tavakoly AA, Follum ML. Towards a large-scale locally relevant flood inundation modeling framework using SWAT and LISFLOOD-FP. J Hydrol. 2020;581:124406. doi:10.1016/j.jhydrol.2019.124406.
CrossRef - Kadaverugu R. Modeling of subsurface horizontal flow constructed wetlands using OpenFOAM®. Model Earth Syst Environ. 2016;2(2):55. doi:10.1007/s40808-016-0111-0.
CrossRef - Kadaverugu R, Sharma A, Matli C, Biniwale R. High Resolution Urban Air Quality Modeling by Coupling CFD and Mesoscale Models: a Review. Asia-Pac J Atmospheric Sci. 2019;55(4):539-556. doi:10.1007/s13143-019-00110-3.
CrossRef - Zaghloul NA. Sensitivity analysis of the SWMM runoff-transport parameters and the effects of catchment discretisation. Adv Water Resour. 1983;6(4):214-223.
CrossRef - Naulin J-P, Payrastre O, Gaume E. Spatially distributed flood forecasting in flash flood prone areas: Application to road network supervision in Southern France. J Hydrol. 2013;486:88-99. doi:10.1016/j.jhydrol.2013.01.044.
CrossRef - Dawod GM, Mirza MN, Al-Ghamdi KA. GIS-based estimation of flood hazard impacts on road network in Makkah city, Saudi Arabia. Environ Earth Sci. 2012;67(8):2205-2215. doi:10.1007/s12665-012-1660-9.
CrossRef - Towfiqul Islam ARM, Talukdar S, Mahato S, et al. Flood susceptibility modelling using advanced ensemble machine learning models. Geosci Front. 2021;12(3):101075. doi:10.1016/j.gsf.2020.09.006.
CrossRef - Kadaverugu R, Gurav C, Rai A, Sharma A, Matli C, Biniwale R. Quantification of heat mitigation by urban green spaces using InVEST model—a scenario analysis of Nagpur City, India. Arab J Geosci. 2021;14(2):82. doi:10.1007/s12517-020-06380-w.
CrossRef - Versini P-A, Gaume E, Andrieu H. Assessment of the susceptibility of roads to flooding based on geographical information – test in a flash flood prone area (the Gard region, France). Nat Hazards Earth Syst Sci. 2010;10(4):793-803. doi:10.5194/nhess-10-793-2010.
CrossRef - Kramer M, Terheiden K, Wieprecht S. Safety criteria for the trafficability of inundated roads in urban floodings. Int J Disaster Risk Reduct. 2016;17:77-84. doi:10.1016/j.ijdrr.2016.04.003.
CrossRef - Sudhir U. Watch: Cars Float, Swept Away As Hyderabad Faces Deluge. NDTV.com. Published 2020. Accessed December 2, 2020. https://www.ndtv.com/hyderabad-news/hyderabad-rain-cars-float-swept-away-as-hyderabad-faces-deluge-2309779.
- Xia J, Teo FY, Lin B, Falconer RA. Formula of incipient velocity for flooded vehicles. Nat Hazards. 2011;58(1):1-14. doi:10.1007/s11069-010-9639-x.
CrossRef - Xia J, Falconer RA, Xiao X, Wang Y. Criterion of vehicle stability in floodwaters based on theoretical and experimental studies. Nat Hazards. 2014;70(2):1619-1630. doi:10.1007/s11069-013-0889-2.
CrossRef - Arrighi C, Alcèrreca-Huerta JC, Oumeraci H, Castelli F. Drag and lift contribution to the incipient motion of partly submerged flooded vehicles. J Fluids Struct. 2015;57:170-184. doi:10.1016/j.jfluidstructs.2015.06.010.
CrossRef - Martínez-Gomariz E, Gómez M, Russo B, Djordjevi? S. A new experiments-based methodology to define the stability threshold for any vehicle exposed to flooding. Urban Water J. 2017;14(9):930-939. doi:10.1080/1573062X.2017.1301501.
CrossRef - Xia J, Teo FY, Falconer RA, Chen Q, Deng S. Hydrodynamic experiments on the impacts of vehicle blockages at bridges: Impacts of vehicle blockages at bridges. J Flood Risk Manag. 2018;11:S395-S402. doi:10.1111/jfr3.12228.
CrossRef - Martínez-Gomariz E, Gómez M, Russo B, Djordjevi? S. Stability criteria for flooded vehicles: a state-of-the-art review: Stability criteria for flooded vehicles. J Flood Risk Manag. 2018;11:S817-S826. doi:10.1111/jfr3.12262.
CrossRef - Khan MU, Mesbah M, Ferreira L, Williams DJ. Development of a post-flood road maintenance strategy: case study Queensland, Australia. Int J Pavement Eng. 2017;18(8):702-713. doi:10.1080/10298436.2015.1121781.
CrossRef - Kumar S, Morstatter F, Marshall G, Liu H, Nambiar U. Navigating information facets on twitter (NIF-T). In: Proceedings of the 18th ACM SIGKDD International Conference on Knowledge Discovery and Data Mining - KDD ’12. ACM Press; 2012:1548. doi:10.1145/2339530.2339777.
CrossRef - Surowiecki J. The Wisdom of Crowds: Why the Many Are Smarter Than the Few. Abacus; 2005. https://books.google.co.in/books?id=_EqBQgAACAAJ.
- Poser K, Dransch D. Volunteered Geographic Information for Disaster Management with Application to Rapid Flood Damage Estimation. GEOMATICA. 2010;64(1):89-98. doi:10.5623/geomat-2010-0008.
- de Albuquerque JP, Herfort B, Brenning A, Zipf A. A geographic approach for combining social media and authoritative data towards identifying useful information for disaster management. Int J Geogr Inf Sci. 2015;29(4):667-689. doi:10.1080/13658816.2014.996567.
CrossRef - See L. A Review of Citizen Science and Crowdsourcing in Applications of Pluvial Flooding. Front Earth Sci. 2019;7:44. doi:10.3389/feart.2019.00044.
CrossRef - Rosser JF, Leibovici DG, Jackson MJ. Rapid flood inundation mapping using social media, remote sensing and topographic data. Nat Hazards. 2017;87(1):103-120. doi:10.1007/s11069-017-2755-0.
CrossRef - Garfield E. Is citation analysis a legitimate evaluation tool? Scientometrics. 1979;1(4):359-375. doi:10.1007/BF02019306.
CrossRef - Phulwani PR, Kumar D, Goyal P. A Systematic Literature Review and Bibliometric Analysis of Recycling Behavior. J Glob Mark. 2020;33(5):354-376. doi:10.1080/08911762.2020.1765444.
CrossRef - Della Corte V, Del Gaudio G, Sepe F, Sciarelli F. Sustainable Tourism in the Open Innovation Realm: A Bibliometric Analysis. Sustainability. 2019;11(21):6114. doi:10.3390/su11216114.
CrossRef - Youssef AM, Pradhan B, Hassan AM. Flash flood risk estimation along the St. Katherine road, southern Sinai, Egypt using GIS based morphometry and satellite imagery. Environ Earth Sci. 2011;62(3):611-623. doi:10.1007/s12665-010-0551-1.
CrossRef - Kleinosky LR, Yarnal B, Fisher A. Vulnerability of Hampton Roads, Virginia to Storm-Surge Flooding and Sea-Level Rise. Nat Hazards. 2007;40(1):43-70. doi:10.1007/s11069-006-0004-z.
CrossRef - La Marche JL, Lettenmaier DP. Effects of forest roads on flood flows in the Deschutes River, Washington. Earth Surf Process Landf. 2001;26(2):115-134. doi:https://doi.org/10.1002/1096-9837(200102)26:2<115::AID-ESP166>3.0.CO;2-O.
CrossRef - Cuccurullo C, Aria M, Sarto F. Foundations and trends in performance management. A twenty-five years bibliometric analysis in business and public administration domains. Scientometrics. 2016;108(2):595-611. doi:10.1007/s11192-016-1948-8.
CrossRef - Cobo MJ, López-Herrera AG, Herrera-Viedma E, Herrera F. An approach for detecting, quantifying, and visualizing the evolution of a research field: A practical application to the Fuzzy Sets Theory field. J Informetr. 2011;5(1):146-166. doi:10.1016/j.joi.2010.10.002.
CrossRef


