Linkages Between Sinuosity Index and Flood Sustainability: A Study of Morna River (Maharashtra), India
Nilesh K. Susware1
, Jagdish B. Sapkale2
*
 , Vinaya N. Susware3
and Shubham K. Gavhane2
, Vinaya N. Susware3
and Shubham K. Gavhane2
http://dx.doi.org/10.12944/CWE.16.2.28
Copy the following to cite this article:
Susware N. K, Sapkale J. B, Susware V. N, Gavhane S. K. Linkages Between Sinuosity Index and Flood Sustainability: A Study of Morna River (Maharashtra), India. Curr World Environ 2021;16(2). DOI:http://dx.doi.org/10.12944/CWE.16.2.28
Copy the following to cite this URL:
Susware N. K, Sapkale J. B, Susware V. N, Gavhane S. K. Linkages Between Sinuosity Index and Flood Sustainability: A Study of Morna River (Maharashtra), India. Curr World Environ 2021;16(2). Available From: https://bit.ly/3mCWFsz
Download article (pdf) Citation Manager Publish History

Introduction
Flooding is an imperative problem in Kolhapur region of Maharashtra. Most of the river basins and low-lying areas have facing unpredictable flood events due to heavy rainfall and human intervention. Heavy rainfall during the monsoon season in this region results in huge runoff and seasonal tributaries of the rivers. Rainfall-runoff is the primary mechanism of floods at the foothills and lower elevations1. The settlement and agricultural areas are highly damaged due to river action with heavy discharge resulting for the variation in the sinuosity index of a channel. Classification of river channels as straight, sinuous, and meandering is identified based on the sinuosity index of the river channel. The river sinuosity index (SI) can be calculated by comparing the straight distance between two points to the length of the river between those points. Channel dynamics are strongly influenced by this parameter, which affects channel stability2.
It helps to understand the changes that occurred in the river path3. Previous studies typically used satellite images to calculate the sinuosity index. Rivers can be classified differently based on their sinuosity and width/depth ratio. They have also categorized based on their sinuosity as low, moderate, or high and very high sinuous rivers4. Therefore, dynamic nature of river channel can be understood by studying the sinuosity index of the river channel. The straight river channel of a river remains straight until the river banks and gradient of river bed is adjusted to water and sediment load; otherwise, there is changes in river shape5. The channel patterns of the river remain straight till the slope is low and the discharge in the channel exceeds the limit; as well as slope increases, the river tends to become meandering in shape 6.The meandering of river is not considered as meandering channel till the sinuosity of the channel becomes more than a value3 of 1.3. The meandering of a river is a natural phenomenon that generally happens in a mature stage of a river where it has a sufficient amount of sediment load to deposit in a river bed. Sediment characteristics have also impact channel sinuosity, the rivers that transport larger size bed material in large volume tends to increase their sinuosity index of the channel, besides smaller bedload deposition increases its sinuosity at a slower rate7.
When rivers are confined more with large meanders and sinuous channels, the region becomes more susceptible to floods. The study of river patterns and its shape has been carried out by many authors in order to benefit river management. In view of this, the rivers in terms of their hydraulic characteristics, deposition, width-depth ratio, morphology, and planform are representatively important. Meandering patterns may form by human activities such as constructions of dams, agricultural activities, and settlement. The sinuosity of a river depends on the structure and geomorphology of the area and riparian vegetation of the same region8. Sinuosity gives the point where river turns to meander in shape from the straight channel. The straight channel of a river has a constant flow direction, but meandering channel of river shows displacement from the valley axis; sinuosity of the river has a directly proportional relationship with the direction variance of the river channel9. Flood problem becomes disastrous in our country as the flood events occur with the socio-economic disturbances and also influenced by hydro-climatological factors10. Ghosh and Mistri, in 2012, studied11 the sinuosity index of Damodar River for pre-dam and post-dam analysis of sinuosity of the river. Higher sediment supply leads to the formation of bars and islands in the river channel. Authors have also concluded that flood risk has increased the instability of rivers caused by various human activities such as embankments, bank side intensive agriculture, sand quarrying along the river and use of bars and islands for agricultural and settlement11. The sinuosity index values of the Dhansiri river of Assam is ranging from 1.22 to 4.91 and could be termed as a highly meandering river. This river flows through alluvial sediments and high sediment discharge of the river leads to the constant shifting of the channel. Bank erosion, shifting of river course, loss of agricultural land, and settlement are common phenomena in the Dhansiri river basin12. Similarly, an attempt has been made by Biswas et. al. to examine the effects of fluvial landform changes on morphodynamics along the Madhumati River. Their study suggests that erosion, accretion, and historical migration areas have all increased during the flood events, and collectively they are responsible for the increase in the sinuosity index from 0.98 (year 1973) to 1.11 (year 2020)13. Intervention by humans, such as bridge construction and dredging activities, has also affected hydromorphological characteristics of the river and altered its sinuosity rates13. Such interferences by humans and their effects on river sinuosity have also observed in the present study area.
Therefore, it is acceptable that changes in the river path may affect the human settlement near the bank of a river and therefore, sustainable protection measures should be considered at probable risk sites14.
Generally, sustainable development is more or less related to the management of renewable natural resources, so that a resource like water may be used with an equilibrium condition15.There is a need to protect the agricultural lands, settlements, infrastructures, etc., along the rivers with a sustainable approach in flood-prone areas. Potential flood risk at the confluence of the rivers is more because of the contribution of multiple river streams16. Heavy rainfall and runoff with increasing bedload joins the tributaries in the upstream basin area and brings to the downstream parts of the river, also affects the river morphology. According to Kundzewicz15, it is essential to be alive with the awareness of the possibility of floods15. Besides this, structural flood control measures are required with the participatory approach in context with flood sustainability. This sustainability concept is also used to frame hydraulics models and in water resource management. The Non-Structural strategies like Green roofs, Vegetated swale (vegetated runoff channel with native grasses), the usage of large wooden debris in a stream etc for flood management practices are better option as a sustainable approach. The large wooden debris serves as a flood mitigation mechanism 17. As a result of increasing population , rapid and uncontrolled changes in land use patterns contribute to flooding and deterioration of urban runoff processes. In addition, the surface inundation area and the number of structures affected by flooding were reduced when green infrastructure (ground surface that is covered by green vegetation and grasses) was implemented 18.
In the study area, river basin characteristic has influenced on the morphological and fluvial processes of the river channel; hence sinuosity index of the river channels have estimated to understand the river channel changes and bank erosion.
Study Area
The Morna river is a tributary of the Warna river. The river is originated in Western Ghat that lies parallel to the west coast of India at the height of 820 metres near Dhamavade village. Seasonal rainfall is higher in the northern part of Western Ghat19.The Basin area of Morna river is 172.2 km2 (Fig.1). The basin is located on a Deccan trap and composed with basaltic hard rock20. Shirala Tahsil is included in this study area as a part of Sangli District. Shirala Tahsil has 96 villages, among which 30 are located in the Morna river basin. They have a total population of around 68 thousand people. Kondahiwadi, Wakunde Budruk, Antri Khurd, Padali, Shirala, Dhumalwadi, Shingatewadi, Sawantmala, Nandoli, and Mangle villages are located along the Morna river. In the study area, the two largest villages are Shirala and Mangle. The population of these two villages is around 28 thousand. For the present study, Morna river basin is divided into five sub-basins/watersheds. A, B, and C sub-watersheds are on the Left bank side of the river, while D and E sub-watersheds are at the Right bank of the river. The location map of the study area shows the boundaries of the sub-basins/watersheds. Basically, selection for the watersheds is based on river length. The watersheds were selected based on their river lengths, i.e., the watersheds with a river length of more than 2.75 km have been considered. Overall, 449 streams are part of the Morna river basin21.
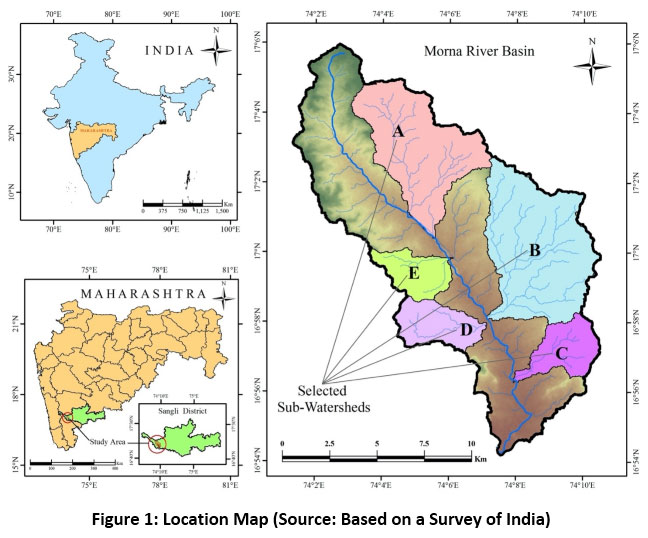 |
Figure 1: Location Map (Source: Based on a Survey of India) Click here to view Figure |
Methodology
The Survey of India toposheet numbers 47-L1 and 47-K4 (1980) at a scale of 1:50000 were used for geo-referencing, base map preparation, and to measure the length of river channels (Fig. 2 and 3). A maximum of three equal parts of the Morna river and its sub-basin tributaries were taken into account when computing river lengths. First, the upper part was demarcated followed by the middle part and then the lower part. With the help of ArcGIS software, digitization of river channels and river lengths has been carried out to analyze the sinuosity pattern of rivers. The sinuosity index is estimated by taking the ratio of the length of channel to the length of meander axis. Commonly, the channel pattern or map view of a river is considered straight, sinuous, meandering, or braided22.
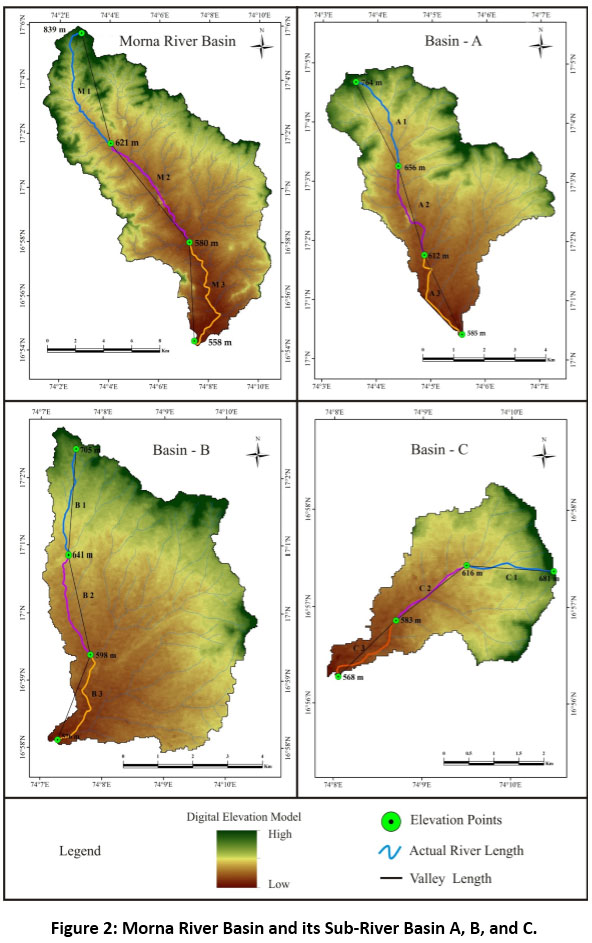 |
Figure 2: Morna River Basin and its Sub-River Basin A, B, and C. Click here to view Figure |
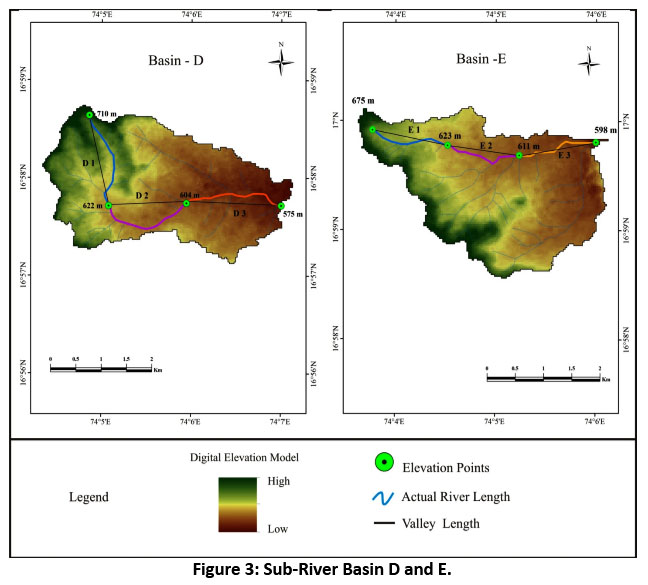 |
Figure 3: Sub-River Basin D and E. Click here to view Figure |
According to Leopold and Wolman23 the sinuosity of a river is the ratio of thalweg (river bed) length to valley length. That means the sinuosity index may be computed as the proportion of channel length to length of valley axis. As per Brice24, if sinuosity index of channel segment is 1.3 or greater, the channel is considered as meandering; a straight reach has a sinuosity index of 1 and reaches having sinuosity indices between 1.05 to 1.3 are defined as sinuous. The sinuosity of the river channel depends on the structural control, river discharge, erodibility of river banks and the channel bed, sediment load carried by river flow and groundwater seepage23, 25, 26.With these factors, some studies also illustrated that the tectonics and the riparian vegetation also influence on the sinuosity of the river channel27.A sinuous river turns to meandering river after increasing erosional and depositional processes within the river channel. Due to the centrifugal force act on the riverbanks with the high velocity, it erodes the outer curves of the bend and at the same time because of low flow intensity at the inner curve of river, it deposits the sediments carried in its flow28. There is a widening of the channel due to bank erosion29. Geospatial techniques with remote sensing is more helpful to handle most of the disastrous events on the earth's surface. In view of this, river characteristics can be carried out by estimating different morphometric aspects of the basin and sinuosity indexes for the river planform.
Besides this , a number of factors contributing to river changes and flood risk include land use planning also, therefore a Land Use Land Cover (LULC) map of Morna River basin have prepared (Fig. 4). A LULC map provides a picture of the population pressure, settlement types and patterns, distance of settlements and agricultural land from the river, and low leveled landscapes of the basin areas. Landsat 8 multispectral images were downloaded from USGS for land use land cover classification. This image was taken on 7 March 2021 at a resolution of 30 metres, with Path 147 and Row 48. Afterward, the image was imported into the ERDAS Imagine 20 software to perform further analysis. A supervised classification was conducted using a non- parametric rule parallelepiped and a parametric rule maximum likelihood classifier. Based on kappa statistics, the accuracy was 89 %. The figure 4 shows a land use land cover classification for the study area which may provide an indication of its relationship to flood events also. In total, there were five classes, including agricultural land, fallow land, settlements, water bodies, and other classes. Other land classes included hill slopes, barren land, open land, and some reserve forest. Agricultural and fallow lands account for 50% of the study area, while other classes account for 45%. A total of 3.36 % of the land area is covered by settlements, and 1.45 % is covered by water-bodies (Fig. 4).
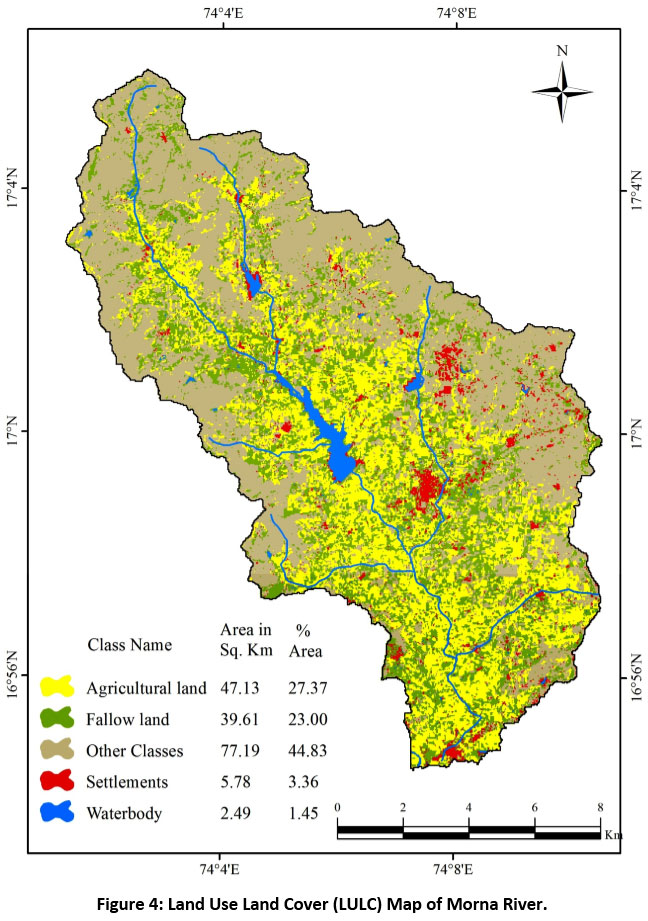 |
Figure 4: Land Use Land Cover (LULC) Map of Morna River. Click here to view Figure |
Result and Discussion
Floods are a natural hazard that can cause economic harm to infrastructures and natural ecosystems. A substantial degradation of vegetation caused by mining activities, improper land-use changes, soil erosion, and increased areas for settlements and industry may be indirect causes of floods, as reported by Osei30. Such type of LULC changes in upstream basin area resulting erosion which led to within channel sedimentation in the downstream part causing variation in river channel. It has also observed that, waterlogging and overtopping will lead to a flood in the saucer-shaped area. This is mainly caused by the area's morphology, which makes it susceptible to flooding. These incidents have mostly occurred in such vast areas encompassing agricultural areas and villages. Using Remote Sensing and Geographic Information Systems, strategic locations regarding morphological changes may be identified along the rivers 31. In the present study, field surveys indicate that the flood had a significant impact on the channel width, and the main effect was high bank erosion in meandering reaches as shown with sinuosity index. In addition, it may also contribute to the planning of sustainable flood management at these sites during upcoming flooding events by helping to predict where river banks will erode. The research work also estimated the planform of the Morna river and its tributaries.
Morna River Basin
For the sinuosity index, each river segment of the basins has divided into 3 equal parts (M1, M2, and M3) of the same length, i.e., for the Morna river the length is 9.5 km /segment (Fig 2). The parts M1, M2, and M3 have represented the upper, middle, and lower stretch of the river, respectively. The upper part of the Morna river basin is very narrow, the sinuosity index of this M1 stretch of the Morna channel is 1.22. Near Wakurde Budruk village, Morna river shows a large meandering pattern. The middle part of the river comes with a sinuosity index of 1.09. The river channel is more or less of a straight pattern with narrow segment. Near Shirala village, river has a small meandering pattern. The last part is the lower part, i.e., from Shirala village to Mangale village. The sinuosity of the lower part is 1.44., The sinuosity index of the Morna river ranges from 1.09 to 1.44. The average sinuosity index is 1.25.
The sinuosity of the Morna River is showing a remarkable change from the upper part to the lower part. The sinuosity of the Morna river in the upper part is considered as sinuous (1.22), and there are 218 meters of height difference between start and endpoint (From Upper part to Middle part). Here the velocity of the river flow can be high and may change the morphometry of the river. But it shows a decrease in the sinuosity index value (1.09) of the river (Middle part), although there is a decrease in the slope of the valley. Here it has been observed that the river channel is getting nearly straight in alignment because the value is only 0.04. This reduces the bank erosion and lateral movement of the river channel. There is 621 metres of height at the Middle part of Morna river and 580 metres height at the end. Only 41 metres of height difference is there in the middle and hence the slope in this portion is low. According to Petrovszki et al., 2014, a downward slope and less sediment supply causes a straight channel of a river32. Similarly, in this case, Morna river has a lake and a dam constructed in the upper part of the basin reduces the sediment discharge to the lower basin turns to stable morphometric characteristics of river in the middle part. Dam construction in the upstream region affects the sediment transportation in the channel controlled by the geology of the river basin and generates new processes in the downstream channel, and influences the downstream hydrology33, 34.Towards the lower part of the basin, sinuosity index shows an increasing trend (1.44). Here the river channel is become meandering in nature (SI>1.3). This change in the Sinuosity Index values of Morna river channel from the upper part to the lower part of the basin is shifted its pattern from sinuous (1.22) to nearly straight (1.09) to meandering (1.44). The bank erosion in this lower part of the basin will be more and proportionally bar formation in the river channel. There are alternate bars formed in Morna river channel near the Mangle village. Here in this part, discharge of the Morna river increased,i.e., in the lower part of the basin, promotes more flood risk.
Similarly, 5 sub-watersheds are generated for understanding the sinuosity index in the study area. The sub-basins/watersheds are A, B, C, D and E. Same methodology has been adopted for calculating sinuosity index for these watersheds.
River Basin No. A:
Watershed A occupies a large part of the Morna basin on the left bank side of the Morna River (Fig 2). The major tributary is flowing through the hilly area and joint Mankarwadi Lake and Morna Dam. The streams in this sub-basin are eroding the surface material from the rugged topography. The eroded sediment load is getting deposited in the Mankarwadi lake and Morna dam. Mankarwadi dam is situated in the middle part of basin A. This dam receives the sediment supply from the upper part of the basin. Therefore, the sinuosity of the tributary in its lower part is not much increased (SI=1.17). The lower part of the tributary passes through the plain area of the basin. The average sinuosity of this tributary is 1.13, which shows the sinuous pattern of the river-channel.
River Basin No. B:
The upper and middle stretches of tributary in this part passes through Durendewadi village and deposited its bedload in Aundhi lake (Fig 2). The lower part of the tributary flows through the Shirala village. This segment of tributary occupied most of the catchment area of agricultural field on both sides. The Sinuosity Index value for this tributary is increased as it goes downwards. The tributary was almost straight in alignment (SI=1.05 in upper part) in its initial stage and turns into sinuous (SI=1.10) after it covers 3.06 km of distance. In the lower part this sub watershed tributary shows maximum sinuosity (SI=1.21), especially near Shirala town. The sinuosity of this lower part is 1.21. Human interference has affected this part of a tributary. The average sinuosity of this tributary is 1.12.
Table 1: Sinuosity Index of the Morna River and its Tributaries.
|
Sub-Basins/ |
Part of the River |
Actual River Length (km) |
Valley Length (km) |
Sinuosity Index |
Upper Point |
Lower Point |
Fall (m) |
River Slope (m/km) |
|
A |
Upper Part |
3.25 |
2.95 |
1.10 |
764 |
656 |
108 |
33.23 |
|
|
Middle Part |
3.25 |
2.9 |
1.12 |
656 |
612 |
44 |
13.54 |
|
|
Lower Part |
3.25 |
2.78 |
1.17 |
612 |
585 |
27 |
8.31 |
|
|
Average |
|
|
1.13 |
|
|
|
|
|
B |
Upper Part |
3.06 |
2.91 |
1.05 |
705 |
641 |
64 |
20.92 |
|
|
Middle Part |
3.06 |
2.79 |
1.10 |
641 |
598 |
43 |
14.05 |
|
|
Lower Part |
3.06 |
2.52 |
1.21 |
598 |
576 |
22 |
7.19 |
|
|
Average |
|
|
1.12 |
|
|
|
|
|
C |
Upper Part |
1.8 |
1.74 |
1.03 |
681 |
616 |
65 |
36.11 |
|
|
Middle Part |
1.8 |
1.77 |
1.02 |
616 |
583 |
33 |
18.33 |
|
|
Lower Part |
1.8 |
1.56 |
1.15 |
583 |
568 |
15 |
8.33 |
|
|
Average |
|
|
1.07 |
|
|
|
|
|
D |
Upper Part |
1.94 |
1.76 |
1.10 |
710 |
622 |
88 |
45.36 |
|
|
Middle Part |
1.94 |
1.56 |
1.24 |
622 |
604 |
18 |
9.28 |
|
|
Lower Part |
1.94 |
1.82 |
1.07 |
604 |
575 |
29 |
14.95 |
|
|
Average |
|
|
1.14 |
|
|
|
|
|
E |
Upper Part |
1.41 |
1.32 |
1.07 |
675 |
623 |
52 |
36.88 |
|
|
Middle Part |
1.41 |
1.29 |
1.09 |
623 |
611 |
12 |
8.51 |
|
|
Lower Part |
1.41 |
1.33 |
1.06 |
611 |
598 |
13 |
9.22 |
|
|
Average |
|
|
1.07 |
|
|
|
|
|
Morna River |
Upper Part |
9.5 |
7.79 |
1.22 |
839 |
621 |
218 |
22.95 |
|
|
Middle Part |
9.5 |
8.73 |
1.09 |
621 |
580 |
41 |
4.32 |
|
|
Lower Part |
9.5 |
6.61 |
1.44 |
580 |
558 |
22 |
2.32 |
|
|
Average |
|
|
1.25 |
|
|
|
|
River Basin No. C:
This basin is smaller than A and B, the length of the tributary is very less. The upstream basin area of this watershed is circular, and the area with the C3 segment is very narrow (Fig 2). The main stream is originated in the eastern part of Ingrul village. Major change in this portion has not been observed in the sinuosity of this tributary between the upper part (SI=1.03) and the lower part (SI=1.02) of Basin C. Therefore, the upper and middle part of this tributary shows a straight pattern. The lower part is found with increasing sinuous shape and covers major part of agriculture fields. This lower part near Fakirvadi village tributary changed its pattern, and sinuosity for the lower part of this stretch becomes 1.15. The average sinuosity of this tributary is 1.07; this shows that this tributary of Morna river is sinuous in shape. Near Chikhalwadi it meets Morna River.
River Basin No. D and E:
Watershed D covers the area along the right bank of the Morna tributary, which originated in the western part of Uphavale village (Fig 3). The upper part of this tributary flows through the hilly area and the middle part shows a long stretch of a meandering shape, the sinuosity of this part is 1.24.There is a 18 metres of height drop in the middle part, whereas 29 metres of drop has been found in the lower part ofthis sub-watershed. The tributary meets Morna River at Gorakhanath Math village. The average sinuosity of this tributary is 1.14, which shows the sinuous pattern of the channel. Watershed No E occupied the basin area towards the right bank side of Morna river mainstream. The length of the tributary is 4.2 km and also the shortest tributary of Morna river. The is a smaller amount of variation in the sinuosity index values for this tributary from upper part (SI=1.07) to lower part(SI=1.06) of the E sub-watershed. The average sinuosity of this tributary is 1.07.
It has also observed that, Sinuosity Index values have fluctuated with the increasing or decreasing of river slopes. In view of this, a correlation coefficient of -0.43 between Sinuosity Index and River Slope (m/km) indicates a good relationship between the two variables (Fig 5). Moreover, this shows that the values of the Sinuosity Index increased simultaneously with the decreases in the slope, and vice versa (Fig 5).
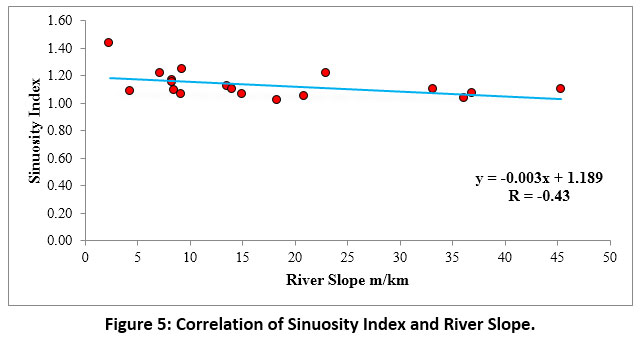 |
Figure 5: Correlation of Sinuosity Index and River Slope. Click here to view Figure |
River Confluence Zone
The confluence of major river Warna and its tributary Morna river shows seasonal flood. Flood risk has been found for the agricultural sector next to the confluence zone. Though Morna river has a reservoir in the upstreams which receives a large supply of sediments. Upper course of the river with the steep slopes and longer lengths generates flash floods, whereas plain areas in the lower course increase the duration period of the flood.35 Heavy rainfall and runoff in upstreams of the Morna river lead to silting in the downstream part. This process produced the alternate bars in the Morna river near Mangle village. Previous work of Graf 198136 proven that the hazardous zones of frequent channel migration and zones of stability can be mapped by using historical data sources36. Heavy discharge and sediment load in the river during the flood situation affect the stability of the river37. Here Morna river, before meet Warna river has sand bar deposition in the channel. Without any significant change in the river morphology, there are enough aggradations in the channel; at lower discharge, river channel can experience the flood at downstreams38.As like such extreme events human intervention is also responsible for change in the river course39. Therefore, Morna river aggradation and transportation of the sediment load to the downstream becomes important to evaluate the flood susceptibility at downstream. There is a scope for further investigation of the Morna river regarding channel instability after the data collection of historical flood events. Narrow channels at downstream and siltation are the factors responsible for the flood situation at the confluence zone of two rivers40. In this case, the tributary of Warna river, i.e., the Morna river and the confluence zone of both rivers, experiences the potential flood risk. Sudden huge discharge in the Warna and Morna rivers can damage the agricultural land near the confluence of both rivers. Flood risk zone mapping is useful for such areas. Flood risk zoning of the region helps the management authorities for planning regarding to set-up of the embankment of the river to minimize the floods41.
It has also been observed that near Mangle village, the Morna river bend is shifted towards the northwest side, form a meandering pattern. Upstream to this bend, i.e., near the bridge, the flow of the river has bifurcated due to within-channel deposition, forming a braiding type appearance. Upstream to the Mangle Bridge, the central and elongated bar deposition have seen that tends to vary the sinuosity index. At the same site, the channel shows the interaction of bedload deposition, channel flow, and hydraulic parameters of the river channel. This also results in the planform of the river due to migration of the deposited bars and erosion of the riverbank. Downstream to the Mangle village area, the river segment of the Morna river formed a large meander. Near the confluence zone of the Morna-Warna river, a very complex landscape has developed due to the sharp turn of the river (Fig 6). Near the confluence zone, the Morna river flows towards the south and southwest direction and then suddenly it turns its direction towards the Northwest and joins the major river Warna. The main flow of Morna river meets at an obtuse angle to the Warna river. Due to this angle of the junction, the heavy discharges of river Warna entered into the river channel of Morna during the monsoon season. It also gives a clear idea of how the migration of river patch in terms of meander influences the channel sinuosity. At the confluence, the river forms a large central bar (Fig 6), at the left bank side of the Morna river, there is an opening of the small stream to bypass the flood water (Fig 7) to the downstream side of the Warna river. There are indirect effects of erosion and accretion along river banks that lead to changes in the morphological characteristics of rivers. The sinuosity indexes are affected when erosion and accretion take place along the river banks42. Changes in LULC patterns have been linked to human intervention. Forest area has been reduced, agricultural land has increased, settlements and infrastructure have increased etc. All of these factors more or less influence river characteristics. In the study area, settlement zones and well-developed agricultural plots (Fig 4) of Mangale village near large meandering bends are more susceptible to the shifting of the river's course as its profile becomes sinuous. The excavation of alluvium, as a human intervention, can also be observed along the river bank near the confluence zone. The river course around this location has been changed by such activities. This site is more vulnerable to flooding. At this site, the use of large wooden debris in a stream at the bottom of the affected river bank may reduces the flood damages. The planting of flood tolerant shrubs, grasses, and trees are also an effective method of preventing riverbank erosion and flooding.
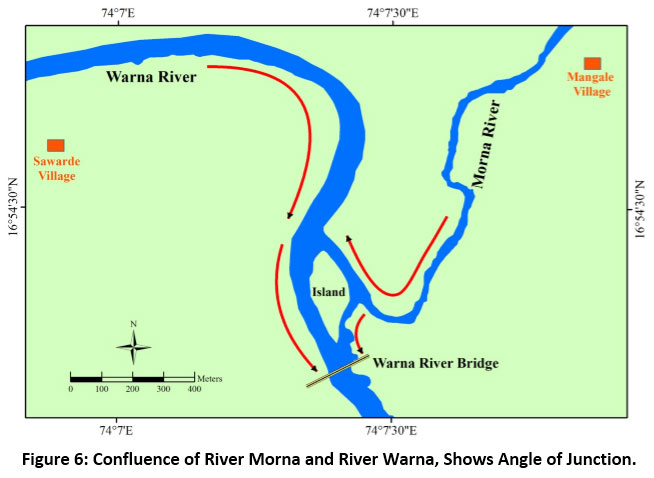 |
Figure 6: Confluence of River Morna and River Warna, Shows Angle of Junction. Click here to view Figure |
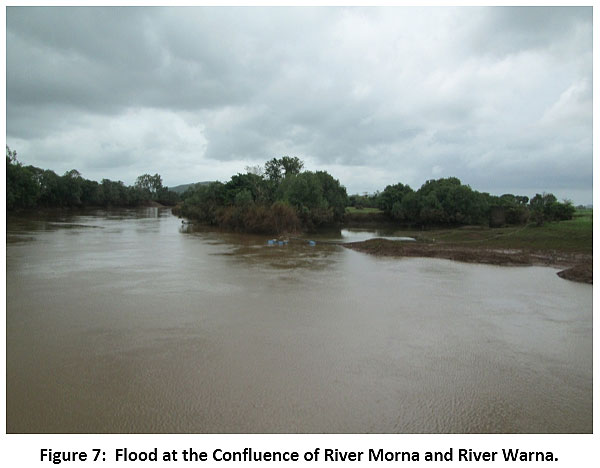 |
Figure 7: Flood at the Confluence of River Morna and River Warna. Click here to view Figure |
Conclusion
Such study with the estimations of sinuosity indices also helps to identify the impact of natural processes and the human interferences on river morphology/riverbanks. At some sites, it has also been concluded that higher values of sinuosity show the meandering and within channel siltation with the depositional features like channel bars. Meandering tracts with high sinuosity also reflect the exchange of bed material in the channel compared to the straight stretches with lower sinuosity values. Morna basin is covered with a composite geological structure. Basin also shows variations in relief/ topography of watershed. The average sinuosity index of Morna river is 1.25. The average sinuosity indexes for the sub-watersheds A,B,C,D and E, are 1.13, 1.12, 1.07, 1.14, and 1.07, respectively. Watershed management and sustainable development of the river basins and river restoration are the priorities in the present time. In order to maintain a sustainable flood management in the area, there needs to be a link between local people, farmers, and the government; the flood-affected villagers should contribute to flood mitigation plans; and flood zones should be mapped along the river banks. Further, sustainable flood planning is more effective by estimating the effects of river shifts and river sinuosity and inundated vulnerable flood affected areas.
Funding Source
There is no funding or financial support for this research work.
Conflict of Interest
There is no conflict of interest between the authors.
Acknowledgments
The authors would like to thank the Department of Geography, Shivaji University , Kolhapur, Maharashtra for providing facilities to use the GIS and Remote Sensing Softwares in the GIS laboratory. The authors are also profoundly grateful to the U.S. Geological Survey (USGS), Denver for providing free downloaded Satellite data.
References
- Pomeroy, J. W., Stewart, R. E. and Whitfield, P. H. The 2013 flood event in the South Saskatchewan and Elk River basins: Causes, assessment and damages. Canadian Water Resources Journal,2015; 41(1-2), 105–117.
CrossRef - Lane, S. The dynamics of dynamic river channels. Geography: Journal of the Geographical Association, 1995; 80 (2), 147-162.
- Kusratmok, E., Wibowo, A. and Kurnia, A. Changes in the Value of Sinuosity Index in Komering River Channel, Province South Sumatera Years 1990 - 2016. IOP Conference Series Earth and Environmental Science, 2019; 338, 012024.
CrossRef - Rosgen, D. L. A classification of natural rivers. Catena, 1994; 22(3), 169-199.
CrossRef - Shen, H. W., Schumm, S. and Doehring, D. O. Stability of stream channel patterns. Transportation Research Record, 1979
- Schumm, S. A. and Khan, H. R. Experimental study of channel patterns. Bull Geol Soc, 1972; Am 83, 1755–1770.
CrossRef - Ahmed, J., Constantine, J. and Dunne, T. The role of sediment supply in the adjustment of channel sinuosity across the Amazon Basin. Geology, 2019; 47(9), 807-810.
CrossRef - Aswathy, M., Vijith, H. and Satheesh, R. Factors influencing the sinuosity of Pannagon River, Kottayam, Kerala, India: An assessment using remote sensing and GIS. Environmental monitoring and assessment, 2008; 138(1-3), 173-80.
CrossRef - Ferguson, R. I. Meander sinuosity and direction variance. Geological Society of America Bulletin, 1977; 88(2), 212.
CrossRef - Mohanty, M. P. and Mudgil S. Karmakar, S. Flood management in India: a focussed review on the current status and future challenges. International Journal of Disaster Risk Reduction, 2020; 101660.
CrossRef - Ghosh, S. and Mistri, B. Hydrogeomorphic Significance of Sinuosity Index in relation to River Instability: A Case Study of Damodar River, West Bengal, India. International Journal of Advances in Earth Sciences, 2012; 1, 49-57.
- Barman, P. and C. Goswami D. Evaluation of Sinuosity Index of Dhansiri (South) River Channel and Bank Erosion, Assam in GIS. International Advanced Research Journal in Science, Engineering and Technology,2015; 2(5), 111-114.
CrossRef - Biswas, R. N., Islam, M. N., Islam, M. N., & Shawon, S. S. Modeling on approximation of fluvial landform change impact on morphodynamics at Madhumati River Basin in Bangladesh. Modeling Earth Systems and Environment, 2021; 7(1): 71-93.
CrossRef - Kumar, M., Denis, D. and Gourav P. Study of meandering of river Ganga near Allahabad (India), using remote sensing and GIS techniques. Asian Journal Of Environmental Science, 2016; 11, 59-63.
CrossRef - Kundzewicz, Z.W. Flood protection—sustainability Issues. Hydrological Sciences Journal, 1999; 44 (4), 559-571.
CrossRef - He, H., Tian, Y.Q., Mu, X., Zhou, J., Li, Z., Cheng, N., Zhang, Q., Keo, S. and Oeurng, C. Confluent flow impacts of flood extremes in the middle Yellow River. Quaternary International,2015; 380-381, 382–390.
CrossRef - Huang, P.H. Sustainable Urban Community Development: A case study of flood design in Snoqualmie, WA, USA (Doctoral dissertation) 2014.
- Ertan, S., & Çelik, R. N. The Assessment of Urbanization Effect and Sustainable Drainage Solutions on Flood Hazard by GIS. Sustainability, 2021; 13 (4), 2293.
CrossRef - Varikoden, H., Revadekar, J.V., Kuttippurath, J., and Babu, C.A. Contrasting trends in southwest monsoon rainfall over the Western Ghats region of India. Clim. Dyn, 2018; 52, 4557–4566.
CrossRef - Gazetteer of India, Maharashtra State Gazetteers, Sangli District, 1983.
- Chougale, S.S. and Sapkale J.B. Morphometric Investigation of Morna River Basin, Maharashtra, India using Geospatial Techniques. Disaster Advances, 2017; 10(08), 31-38.
- Schumm, S. The Fluvial System. Wiley, New York, 1977; pp 338
- Leopold, L.B. and Wolman, M.G. River channel patterns braided, meandering, and straight. U.S. Geol. Survey, 1957; 282-B, 85.
CrossRef - Brice, J.C. Channel Patterns and Terraces of the Loup Rivers in Nebraska; Physiographic and Hydraulic Studies of Rivers, Geological Survey Professional Paper, 1964; 422-D.
CrossRef - Woolderink, H., Cohen, K., Kasse, C., Kleinhans, M. and Van B.R. Patterns in river channel sinuosity of the Meuse, Roer and Rhine rivers in the Lower Rhine Embayment rift-system, are they tectonically forced?. Geomorphology, 2021; 375.
CrossRef - Schumm, S.A. Sinuosity of Alluvial Rivers on the Great Plains. Geological Society of America Bulletin, 1963; 74(9), 1089.
CrossRef - Aswathy, M.V., Vijith, H. and Satheesh, R. Factors influencing the sinuosity of Pannagon River, Kottayam, Kerala, India: An assessment using remote sensing and GIS. Environ Monit Assess, 2008; 138, 173–180.
CrossRef - Ashour, M. A., Saad, S. M. and Kotb, M. M. Evaluation of Alluvial Channels Meandering Phenomenon (Case Study: Bahr Youssef). Annals of Valahia University of Targoviste, Geographical Series, 2017; 17(2), 206-219.
CrossRef - Ghosh, B., Mukhopadhyay, S. Channel planform dynamics, avulsion and bankline migration: a study in the monsoon-dominated Dwarkeswar river, Eastern India. Arabian Journal of Geosciences, 2021; 14 (10), 1-16.
CrossRef - Osei, B. K., Ahenkorah, I., Ewusi, A., & Fiadonu, E. B. Assessment of flood prone zones in the Tarkwa mining area of Ghana using a GIS-based approach. Environmental Challenges, 2021; 3, 100028.
CrossRef - Kar, A. K., Hembram, R., & Mohanty, H. Study of Morphological Changes in Deltaic River of Odisha Using GIS. In Water Management and Water Governance, Springer, Cham, 2021; 35-46.
CrossRef - Petrovszki, J., Timar, G. and Molnar, G. Is sinuosity a function of slope and bankfull discharge? – A case study of the meandering rivers in the Pannonian Basin. Hydrology and Earth System Sciences Discussions, 2014; 11, 12271-12291.
CrossRef - Grant, G.E., Schmidt, J.C. and Lewis, S.L. A Geological Framework for Interpreting Downstream Effects of Dams on Rivers. Water Science and Application, 2013; 203–219.
CrossRef - Graf, W.L. Downstream hydrologic and geomorphic effects of large dams on American rivers. Geomorphology, 2006; 79(3-4), 336–360.
CrossRef - Chan, N. and Parker, D. Response to Dynamic Flood Hazard Factors in Peninsular Malaysia. The Geographical Journal, 1996; 162(3), 313-325.
CrossRef - Graf, W.L. Channel instability in a braided, sand bed river, Water Resour. Res., 1981; 17(4), 1087– 1094.
CrossRef - Gogoi, C. and Goswami, D. A study on channel migration of the Subansiri river in Assam using remote sensing and GIS technology. Current Science, 2014; 106(8), 1113-1120.
- Stover, S.C. and Montgomery, D.R. Channel change and flooding, Skokomish River, Washington. Journal of Hydrology, 2001; 243(3-4), 272–286.
CrossRef - Devkota, L. Crosato, A. and Giri, S. Effect of the barrage and embankments on flooding and channel avulsion case study Koshi River, Nepal. A Journal of Rural Infrastructure Development, Society of Engineers' for Rural Development, Nepal (SERDeN), 2012; 3, 124-132.
- Roy, S. and Mistri B. Flooding in the Confluence Zone of the Ajay and Kunur Rivers, West Bengal: A Hydrgeomorphological Assessment. Journal of Indian Geomorphology. 2016; 4, 73-83.
- Gogoi, C., Goswami, D. and Phukan, S. Flood risk zone mapping of the Subansiri sub-basin in Assam, India. International journal of Geomatics and Geosciences, 2013; 4, 75-88.
- Prasad, S., Saluja, R., Joshi, V., Garg, J. K. Riverine landscape dynamics of the Upper Ganga River (Haridwar-Narora), India. Environmental Monitoring and Assessment, 2021; 193 (2), 1-20.
CrossRef


