Wet Deposition of Mercury and Dissolved Organic Carbon during Pre-Monsoon and Monsoon Periods at Sitapuri Site in Delhi (India)
Sunaina Sunaina
and Dr. Umesh Chandra Kulshrestha
*

http://dx.doi.org/10.12944/CWE.16.2.18
Copy the following to cite this article:
Sunaina S, Kulshrestha U. C. Wet Deposition of Mercury and Dissolved Organic Carbon during Pre-Monsoon and Monsoon Periods at Sitapuri Site in Delhi (India). Curr World Environ 2021;16(2). DOI:http://dx.doi.org/10.12944/CWE.16.2.18
Copy the following to cite this URL:
Sunaina S, Kulshrestha U. C. Wet Deposition of Mercury and Dissolved Organic Carbon during Pre-Monsoon and Monsoon Periods at Sitapuri Site in Delhi (India). Curr World Environ 2021;16(2). Available From : https://bit.ly/37CxJZH
Download article (pdf) Citation Manager Publish History

Introduction
Atmospheric mercury is mainly found in inorganic forms i.e., a) gaseous oxidised mercury (GOM), (b) gaseous elemental mercury, (c) particulate bound mercury. In addition, its organic form as methyl mercury can be bio- accumulated in aquatic biota1. Because of its various states in the atmosphere and its ability to get adsorbed on the surface of any substance, it becomes difficult to gather comprehensive information about the complete cycle of mercury compounds. As mercury forms the bridge between terrestrial and aquatic ecosystem, its transformation and transport in the troposphere have high importance.
In rainwater samples, mercury is found in reactive forms such as reactive gaseous mercury (RGM) and dissolved particulate mercury (HgP). Major sources of mercury include waste incineration, ore roasting, coal-fired power plants. It is also emitted by natural sources e.g., geologically bound mercury release by natural biotic/abiotic processes. Hg aerosol dissolution is affected by the droplets pH, aerosol chemical composition, amount of suspended or organic matter which affect Hg oxidation/reduction reactions2. Meteorological parameters such as temperature, relative humidity, wind speed, mixing height etc. play very important role in the complex reactions of mercury in the atmosphere. It can be transported to far places. To control Hg emissions from power plants, air toxic standards have been defined by the United States Environmental Protection Agency (USEPA) to limit Hg and other pollutants. Surprisingly, the atmospheric mercury is not extensively studied in India. Only few reports on mercury have been documented. In 2014, Kumari and co-workers have reviewed the south Asian scenario of atmospheric mercury3. They have very first time have reported particulate mercury in rain samples which was the first report on atmospheric Hg in India.
The process of wet scavenging of pollutants also helps in the removal of carbon species in the form of dissolved organic carbon from the atmosphere through precipitation. According to report, the organic carbon species range from 104 to105 mg l-1 in rain water4. However, the occurrence of total non-methane organic carbon or dissolved organic carbon (DOC) has not been estimated accurately yet. The total reservoir of DOC was initially demonstrated to be about 16Tg C in the atmosphere, with has enormous spatial and temporal inconsistencies5. The release of reduced biogenic volatile organic compounds (VOCs) such as isoprene and terpenes, have been estimated around 1000 Tg yr-1 which makes these emissions as the most predominant terrestrial sources of DOC in the air6. Significant anthropogenic contributions of DOC include emissions from biomass burning and hydrocarbons7.
After getting released into the ambient air, the organic compounds undergo different chemical transformations such as oxidation reactions, fragmentation or oligomerization or dehydration, or hydration etc. along with physical transformations which may include undergoing condensation to the aerosol phase. Their fate in the atmosphere is determined either through termination by getting converted to CO2 and CO, or through dry and wet deposition to the surface in the form of gases or aerosols8. Organic compounds can also undergo photolysis with oxidants such as the hydroxyl radical (OH*), nitrate radical (NO3), ozone O3* and halogen radicals (e.g Cl*, Br*) at infinitely altered reaction rates through distinct mechanisms in the atmosphere. These compounds get oxidized in the troposphere, yielding an extensive variability of more oxygenated compounds over intervals of hours to weeks9.
Along with other pollutants, N compounds are also scavenged effectively. Major components of total inorganic nitrogen (TIN) in precipitation are ammonium (NH4+) and nitrate ions (NO3-). In 1995, Galloway has reported that agricultural activities are major contributors of NH3 in Asia. Delhi and its neighbouring states such as Punjab, Haryana, and Uttar Pradesh have commonly practiced agrarian occupations which are significant sources of atmospheric NH3. The expeditious urbanization and the transboundary movement of pollutants could be the reason for the increased levels of NOx in Delhi. Singh and Kulshrestha10 have reported that NO3- concentrations increased by more than twice in the urban site rain samples as compared to the rural site. The NOx and NO3- are mostly contributed by automobile emissions11. In addition, NO3- concentrations might be higher at the urban as well as the rural sites due to prevalent sources such as emissions from biomass burning and industrial emissions12.
Therefore, it is important to measure mercury, carbon and nitrogen in rain water and to identify their possible sources. For the identification of potential sources and the interlinkages between origins of mercury, organic carbon species and TN species, precipitation chemistry is one of the major mediums. This study aims to measure the levels and identify sources of Hg0, DOC and TN in rain water samples at an urban site in Delhi.
Methodology
Site Description
The megacity or Delhi is one of the most vulnerable cities of India due to massive population, urban and industrial activities. The sample collection site Sitapuri is positioned in south-west zone, Delhi. The area can be characterized as residential colony. Geographical coordinates of Sitapuri 28.6126° N, 77.0822° E. The mapping Fig. 1 shows the location of selected site.
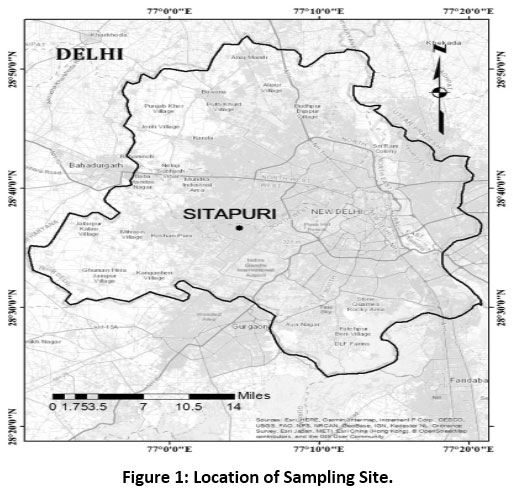 |
Figure 1: Location of Sampling Site. Click here to view Figure |
Sample Collection
The collection of rain samples was done with the help of assembled funnel and bottle. The assembly was mounted on terrace 5m above ground level to refrain any contamination. The collecting assembly was installed just before the rain and was removed as soon as the rain stopped to collect on event basis. The funnel was removed from the bottle to measure the volume of rainwater. The pH and conductivity of the samples were measured as soon as possible using the pH meter and conductivity meter.
Sample Preparation
The rainwater samples were filtered using 0.47 mm nylon filter and were preserved in pre-washed polypropylene bottles with 5% nitric acid. These bottles were soaked in 5% nitric acid overnight before use followed by rinsing with milli-Q water. All glassware and sample containers were washed in a same manner. Two replicas and blank were also analysed to check the closeness of the results. The mercury analysis was done using 10 ml of extracted solution. Trace metal determination was done using the remaining solution . Rain samples were preserved at 4° in the refrigerator and were used for DOC and TN analysis.
Determination of Mercury, DOC and TN
Mercury was determined by using 797 VA Computrace (Metrohm, Switzerland) mercury analyser with Differential Pulse Anodic Stripping Voltammetry (DPASV) technique. The voltammetry is widely used technique for mercury determination in environmental samples13-17. The instrument consists of working electrode placed in the centre made up using Gold (Au-RDE) of 2 mm, a reference electrode Ag/AgCl which is filled with KCl electrolyte and a glass carbon auxiliary electrode. The gold working electrode was kept in 0.1 M NaOH for at least half an hour for conditioning purpose. In the stripping voltammetry technique, the analyte is determined in two steps- i). in the deposition step, the substance is to be deposited on the working electrode at a constant potential up to a controlled deposition time, ii) stripping step in which the deposited substance in the first step is dissolved in the solution. During deposition, 370 mV deposition potential was applied for 260 seconds. During stripping step, 0.30 to 0.84 V potential was scanned at a sweep rate of 0.02 V/s. The peak potential was 0.521 V. The Anodic Stripping Voltammetry (ASV) has remarkably low detection limits (0.1 μg/L) and hence, this technique is proved to be efficient when it comes to analyse sample to find out heavy metal concentration at ppb level.
The stock solution of 1000 ppm Hg2+ was prepared on weekly basis for which 0.1345 g of HgCl2 (Merck) was dissolved in de-ionized water. The working standards of mercury (1 mg/L and 10 μg/L) were prepared from 1000 ppm stock solution at the time of daily analysis. The electrolyte of voltammetric cell had perchloric acid, ethylenediaminetetraacetic acid (EDTA) and potassium chloride (KCl). In a 10 ml sample, perchloric acid (300 μl), EDTA solution (400 μl) and of KCl solution (100 μl) were added into the cell followed by nitrogen purging for 300 seconds to remove any dissolved oxygen from the sample. Then as the first standard of addition, 200 μl of 1 mg/L Hg2+ standard was added to the cell vessel. Further, the replicate voltammograms were taken to ensure the repeatability. Afterwards, second standard of addition (200 μl of 1 mg/L Hg2+) standard was added to the cell vessel, and the corresponding voltammograms were recorded in replicates. Similarly, the water blank was also analysed (Fig. 2). Hg2+ concentration was calculated using peak height method. The preparation of solutions was done using ultrapure water (Mili-Q). All the chemicals and reagents used in the analysis were purchased from Merck Millipore having EMPARTA grade. Total Nitrogen and dissolved Carbon species were determined by using Total Organic Carbon Analyzer. (Shimadzu model LCPH/CPN) as described elsewhere18).
Results and Discussion
Variation of Hg in Rainwater
Table 1 gives the values of mercury concentrations in the samples collected at Sitapuri site. The maximum number of rain samples were collected in the month of July which falls under monsoon season (Fig.2). The Hg concentration was found to be the highest in the month of June followed by May. These are the months of pre-monsoon season in Delhi region when the atmosphere is relatively polluted and dry. This favours an accumulation of particulates leading to the elevated levels of toxins in the atmosphere. The most probable reason for these results can be their emissions from fossil fuel combustion including coal burning in brick kilns, diesel burning in vehicular movement and construction machines etc. Relatively lower values were recorded during monsoon months i.e., July, August, and September when rain occurrence was frequent which cleaned the atmosphere as a result the atmospheric loadings of Hg were not built up effectively during monsoon period. The concentrations of mercury in precipitation samples are highly affected by the source strength and meteorological factors. Wet deposition is the process helps to eliminate mercury and other contaminants from atmosphere19-20.
Table 1: Concentration of Hg and DOC in Rainwater along with Related Ratios.
|
S. No |
Date |
Hg Concentration (µg l-1) |
DOC mg l-1 |
TN mg l-1 |
DOC/Hg ratio |
TN/Hg ratio |
|
1 |
02/5/18 |
3.7 |
10.7 |
6.2 |
2.9 |
1.7 |
|
2 |
03/5/18 |
0.7 |
3 |
2.7 |
4.2 |
3.8 |
|
3 |
19/6/18 |
4.3 |
6.7 |
6.2 |
1.5 |
1.4 |
|
4 |
27/6/18 |
2.2 |
3.3 |
4.1 |
1.5 |
1.9 |
|
5 |
30/6/18 |
2.6 |
1.1 |
2.6 |
0.4 |
1.0 |
|
6 |
13/7/18 |
1.8 |
1.5 |
4.2 |
0.8 |
2.3 |
|
7 |
22/7/18 |
1.0 |
1.4 |
7.2 |
1.4 |
7.2 |
|
8 |
26/7/18 |
0.4 |
1.1 |
8.7 |
2.7 |
21.7 |
|
9 |
27/7/18 |
0.6 |
1.5 |
3.0 |
2.5 |
5.0 |
|
10 |
28/7/18 |
0.8 |
1.4 |
2.8 |
1.7 |
3.5 |
|
11 |
08/7/18 |
2.6 |
3.6 |
5.8 |
1.4 |
2.2 |
|
12 |
22/8/18 |
1.0 |
2.5 |
44.4 |
2.5 |
44.4 |
|
13 |
28/8/18 |
0.6 |
0.7 |
13.2 |
1.2 |
22.0 |
|
14 |
07/9/18 |
0.7 |
2.0 |
20.1 |
2.8 |
28.7 |
|
15 |
24/9/18 |
0.9 |
2.0 |
58.8 |
2.2 |
65.3 |
|
Average |
|
1.6 |
2.8 |
12.7 |
2.0 |
14.1 |
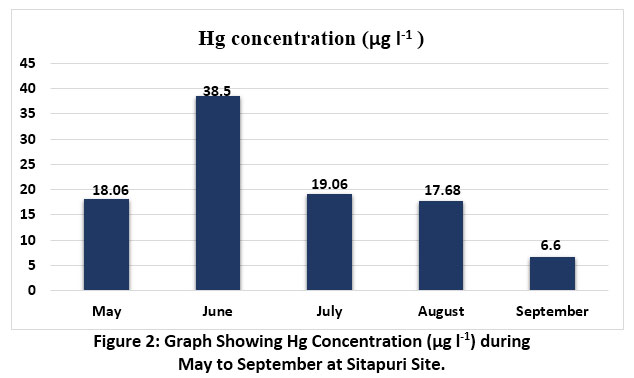 |
Figure 2: Hg Concentration (µg l-1) from May to September at Sitapuri Site. Click here to view Figure |
Variation of DOC in Rainwater
Table 2 gives the maximum, minimum and average values of DOC and Hg in the month of May. Variation of Hg and DOC is shown in Fig. 3. The figure shows a significant co-variation of Hg and DOC at Sitapuri site of Delhi region. The DOC concentration values were found to be the lowest in monsoon season and the probable reason is the scavenging effects. When compared with other global studies, organic carbon concentrations have been reported the lowest at Nigata site (274 μg C l-1), Tokya 657 μg C l-1 and Sado 273.9 μg C l-1. This has been observed that carbonaceous fractions were mostly higher during non-monsoon season due to higher pollution level and lower mixing height. The crop residues burning in the neighbouring states i.e., Haryana and Punjab make situation worse during non-monsoon season when organic carbon fractions show high peaks21.
Table 2: Descriptive Statistics of Hg and DOC (mg l-1) for Monsoon and Non-Monsoon Samples.
|
|
Hg (µg l-1) |
DOC (mg l-1) |
||
|
|
Monsoon |
Pre-monsoon |
Monsoon |
Pre-monsoon |
|
|
|
|
|
|
|
Average |
1.0 |
2.7 |
1.8 |
5.0 |
|
Minimum |
0.4 |
0.7 |
0.7 |
1.1 |
|
Maximum |
2.6 |
4.3 |
3.6 |
10.7 |
|
n |
10 |
5 |
10 |
5 |
Table 3 gives comparison of mercury concentrations at different cities worldwide. Among all sites, Taichung being an industrial city situated at the western side of Central Taiwan having area 2,215 km2 has shown the highest concentration of mercury dispersion. While in case of Kodiak being an Island situated in USA, Alaska state, within the city, The transportation is being done for commercial purposes within the Island or outer areas via road, ferryboat, or airline. This site is comparatively less used commercially in terms of industrial activities. The Hg concentration of sampling site was found to be low as compared to Taichung city of China but on the other hand it was found to be equal or closely related values such as Tibetan plateau of China, Minamata Bay of Japan, Mt. Leigong of China, Churchill city of Canada and Southern New Hampshire of USA respectively. Interestingly, Kodiak Island of USA has recorded the lowest value of Hg concentration.
Table 3: Comparative Data of Mercury Concentration (µg l-1) at Different Sites Worldwide.
|
Site |
Country |
Site type |
Sampling period |
Hg (µg l-1) |
Reference |
|
Sitapuri |
India |
urban |
2018 |
4.35 |
Present study |
|
Taichung |
China |
Urban |
2017 |
10,539.1 |
22 |
|
Three Gorges Reservoir |
China |
Reservoir |
2012-2013 |
18 |
23 |
|
Chongqing |
China |
Urban |
2010–2014 |
34.25 |
24 |
|
Tibetan Plateau |
China |
Plateau |
2010-2012 |
4.0 |
25 |
|
Xiamen |
China |
urban |
2012-2013 |
12.3 |
26 |
|
Lhasa |
China |
Urban |
2010 |
24.8 |
27 |
|
Tibetan Plateau |
China |
Plateau |
2009-2011 |
4.8 |
28 |
|
Minamata Bay |
Japan |
Bay |
2009-2010 |
5.9 |
29 |
|
Mt. Leigong |
China |
Mountain |
2008-2009 |
4 |
30 |
|
Southern New Hampshire |
USA |
Urban |
2008 |
12.33 |
31 |
|
Southern New Hampshire |
USA |
Urban |
2007 |
8.41 |
32 |
Variation of TN
The maximum and minimum TN was found to be 58.8 mg l-1 and 2.66 mg l-1 in monsoon and pre-monsoon at Sitapuri site. These maximum and minimum values were indicating the deposition of total nitrogen in the atmosphere in different forms such as NH3, NHx, NO2 and HNO333.
Among the above-mentioned species, ammonia (NH3) and ammonium (NHx) are water soluble species in the atmosphere. The two main reasons because of which atmospheric NH3 is hazardous to the environment are; firstly, for the ecological repercussions of its deposition on delicate ecosystems which causes eutrophication and secondly, it serves as a neutralizing agent in nature. Ammonia reacts rapidly with acidic components such as H2SO4, HNO3in the atmosphere. Neutralization by ammonia results in secondary formation of ammonium salts, i.e. (NH4)2SO4 , NH4HSO4and NH4NO3 etc., which play a salient role in radiative forcing. It is to be noted that deposition of NHx leads to acidification of the soil similar to the acidic effect of SO2 and NOx due to the ability to form nitrates in the soil as a result of oxidation34. Deposition of NHxfrom the atmosphere leads to excess Nr input to the ecosystem35.
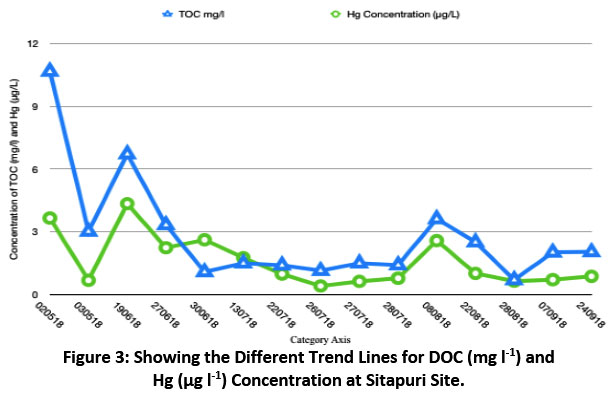 |
Figure 3: DOC (mg l-1) and Hg (µg l-1) Concentration at Sitapuri Site. Click here to view Figure |
Influence of Meteorological Factors
Wind rose is the graphical representation of an average of wind velocity characteristics that means wind velocity and frequency are represented through the radially outward stalked for diagram, direction is represented through angle it makes with the reference point. In a wind rose, wind velocity is represented by necessary legends, the length of stalked bar represents the frequency of such occurrences with respect to total time of measurement and the direction of stalked bar represents the wind direction. (Fig. 4) shows wind rose for different months. In the month of May the frequency of wind is maximum in the east direction and in subsequent months the frequencies were found to be more in west directions except in July where it was found to be in both the directions east and west. The direction of wind movement always governs the concentration of mercury dispersion. In the atmosphere, the major form of Hg is GEM. Due to its high stability and long residence time (several months to a year), GEM can be effectively carried over long distances36. In 2018, it has has been discussed that mercury is measured as a global pollutant, as it has property of transboundary movement in troposphere37. The types and forms of Hg metal enter the ambient air from various sources, and they have the potential to enter the terrestrial and aquatic ecosystems through drainage and rainfall, can be lethal if human body encounters. So, it becomes essential to monitor mercury concentrations in precipitation.
Hg/DOC Ratios
The ratio values or faction values signify the relationship between two variables. The ratio values help to identify the sources and to calculate fraction of any variable38. Table 4 gives the individual values for mercury concentrations and DOC and their ratios as well. In case of Hg concentration, the maximum values were found to be 4.35 µgl-1 and minimum was 0.41 µgl-1 whereas just in case of DOC maximum and minimum values were 10.68 and 0.70 µgl-1 respectively. The ratio values of DOC/Hg and TN/Hg indicated different emission sources in Sitapuri. The Hg/DOC ratio had an order of range. It varied from 0.2 to 2.4. In general, the ratio values were less than 1 except two samples. This indicated that the DOC concentrations were much higher than Hg. Secondly, ratios and the good correlation of Hg with DOC as shown in (Fig. 3) suggest an order of higher emissions of DOC precursors as compared to Hg emissions, if the sources of their emissions are considered the same. The ratios more than 1 in two samples indicated very high enrichment of Hg in those two events. This might be due to local source contamination which cannot be explained at present and needs further long-term investigations.
Table 4: Hg/DOC Values for Different Rain Samples Over Sitapuri Site.
|
S. No |
Hg Concentration (µg l-1) |
DOC (mg l-1) |
Hg/DOC ratio |
|
1 |
3.7 |
10.7 |
0.3 |
|
2 |
0.7 |
3.0 |
0.2 |
|
3 |
4.3 |
6.7 |
0.6 |
|
4 |
2.2 |
3.3 |
0.7 |
|
5 |
2.6 |
1.1 |
2.4 |
|
6 |
1.8 |
1.5 |
1.2 |
|
7 |
1 |
1.4 |
0.7 |
|
8 |
0.4 |
1.1 |
0.4 |
|
9 |
0.6 |
1.5 |
0.4 |
|
10 |
0.8 |
1.4 |
0.6 |
|
11 |
2.6 |
3.6 |
0.3 |
|
12 |
1 |
2.5 |
0.4 |
|
13 |
0.6 |
0.7 |
0.8 |
|
14 |
0.7 |
2.0 |
0.3 |
|
15 |
0.9 |
2.0 |
0.4 |
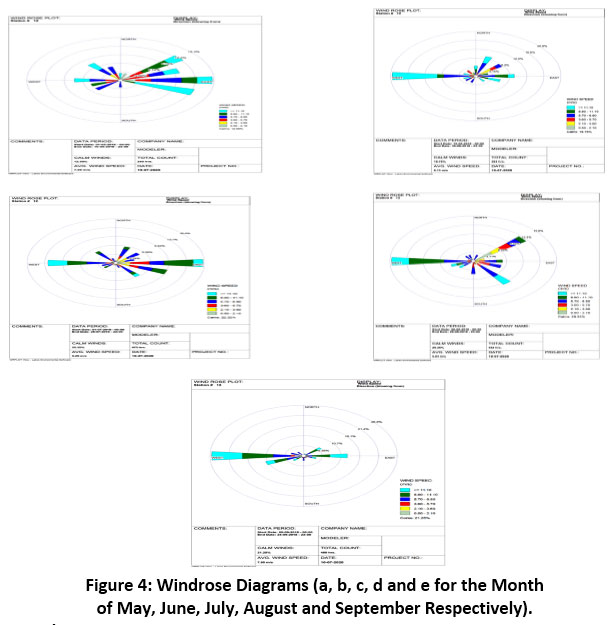 |
Figure 4: Windrose Diagrams (a, b, c, d and e for the Month of May, June, July, August and September Respectively). Click here to view Figure |
Conclusions
DOC, TN, and Hg along with other heavy metals and meteorological conditions were measured in urban site in New Delhi. The mean values for Hg, DOC and TN are 1.6 µgl-1, 2.8 mg l-1 and 12.7 mg l-1, respectively having a range between 0.4-4.3 µgl-1, 0.7-10.7 mg l-1and2.7-58.8 mg l-1, respectively. The values found to be higher during initial precipitation events especially during pre-monsoon season and dissimilar chemical and physical mechanisms emerge to control the atmospheric concentrations of Hg. DOC/Hg and TN/Hg ratios stipulate that there were different Hg emission sources at the two sites which effect local Hg concentrations were very distinct at designated site. The probable sources could be domestic animals, biomass burning, human population and waste incineration, coal combustion, cement for reactive nitrogen and mercury respectively.
Acknowledgment
This study was supported by UGC-UPA II project. Author Sunaina acknowledges the award of Junior Research Fellowship from University Grant Commission (UGC) of India. We would also like to thank anonymous reviewers for their valuable suggestions for improvement of this manuscript.
References
- Steffen, A., Douglas, T., Amyot, M., Ariya, P., Aspmo, K., Berg, T., ... & Temme, C. (2007). A synthesis of atmospheric mercury depletion event chemistry linking atmosphere, snow, and water. Atmospheric Chemistry and Physics Discussions, 7(4), 10837-10931.
CrossRef - Munthe J, McElroy WJ. Some aqueous reactions of potential importance in the atmospheric chemistry of mercury. Atmos Environ. 1992;26:553–557. doi: 10.1016/0960-1686(92)90168-K.
CrossRef - Kumari, A., Kumar, B., Manzoor, S., &Kulshrestha, U. (2014). Status of atmospheric mercury research in South Asia: a review. Aerosol and Air Quality Research, 15(3), 1092-1109.
CrossRef - Kroll, J. H., Donahue, N. M., Jimenez, J. L., Kessler, S. H., Canagaratna, M. R., Wilson, K. R., ... &Mysak, E. R. (2011). Carbon oxidation state as a metric for describing the chemistry of atmospheric organic aerosol. Nature Chemistry, 3(2), 133-139.
CrossRef - Sakata, M., &Marumoto, K. (2005). Wet and dry deposition fluxes of mercury in Japan. Atmospheric Environment, 39(17), 3139-3146.
CrossRef - Florence, T. M. (1970). Anodic stripping voltammetry with a glassy carbon electrode mercury-plated in situ. Journal of Electroanalytical Chemistry and Interfacial Electrochemistry, 27(2), 273-281.p-12.
CrossRef - Sigsgaard, T., Forsberg, B., Annesi-Maesano, I., Blomberg, A., Bølling, A., Boman, C., ... & Brunekreef, B. (2015). Health impacts of anthropogenic biomass burning in the developed world. European Respiratory Journal, 46(6), 1577-1588.
CrossRef - Huo, M. Q., Sato, K., Ohizumi, T., Akimoto, H., & Takahashi, K. (2016). Characteristics of carbonaceous components in precipitation and atmospheric particle at Japanese sites. Atmospheric Environment, 146, 164-173.
CrossRef - Kumari, A., & Kulshrestha, U. (2018). Trace ambient levels of particulate mercury and its sources at a rural site near Delhi. Journal of Atmospheric Chemistry, 75(4), 335-355.
CrossRef - Singh, S., Kulshrestha, U.C., 2014. Rural versus urban gaseous inorganic reactive nitrogen in the Indo-Gangetic plains (IGP) of India. Environ. Res. Lett. 9 (12), 125004.
CrossRef - Ravishankara, A. R., Daniel, J. S., &Portmann, R. W. (2009). Nitrous oxide (N2O): the dominant ozone-depleting substance emitted in the 21st century. science, 326(5949), 123-125.
CrossRef - Jongebreur, A. A., &Voorburg, J. H. (1992). The role of ammonia in acidification. Perspectives for the prevention and reduction of emissions from livestock operations. In Studies in Environmental Science (Vol. 50, pp. 55-64). Elsevier.
CrossRef - Buzica, D., Gerboles, M., Borowiak, A., Trincherini, P., Passarella, R., & Pedroni, V. (2006). Comparison of voltammetry and inductively coupled plasma-mass spectrometry for the determination of heavy metals in PM10 airborne particulate matter. Atmospheric Environment, 40(25), 4703-4710.
CrossRef - Buldini, P. L., Cavalli, S., Mevoli, A., & Sharma, J. L. (2001). Ion chromatographic and voltammetric determination of heavy and transition metals in honey. Food Chemistry, 73(4), 487-495.
CrossRef - Farghaly, O. A., & Ghandour, M. A. (2005). Square-wave stripping voltammetry for direct determination of eight heavy metals in soil and indoor-airborne particulate matter. Environmental research, 97(3), 229-235.
CrossRef - Locatelli, C., & Torsi, G. (2003). Analytical procedures for the simultaneous voltammetric determination of heavy metals in meals. Microchemical journal, 75(3), 233-240.
CrossRef - Nedeltcheva, T., Atanassova, M., Dimitrov, J., & Stanislavova, L. (2005). Determination of mobile form contents of Zn, Cd, Pb and Cu in soil extracts by combined stripping voltammetry. Analytica Chimica Acta, 528(2), 143-146.
CrossRef - Roy A. and Kulshrestha U. C. 2021. Inter-linkages Between Total Nitrogen and Dissolved Organic Carbon in Rainwater at an Urban Site in Saharsa District of Bihar (India). Current World Environment (in press).
- Pant, P., Shukla, A., Kohl, S.T., Chow, J.C., Watson, J.G., Harrison, R.M., 2015. Characterization of ambient PM2.5 at a pollution hotspot in New Delhi, India and inference of sources. Atmos. Environ. 109, 178e189.
CrossRef - Li, R., & Deng, X. (2020). Determination of Total Mercury in Rain Water by Chemical Vapor Atomic Fluorescence Spectrometry. E&ES, 440(4), 042047.
CrossRef - Sonwani, S., &Kulshrestha, U. C. (2019). PM 10 carbonaceous aerosols and their real-time wet scavenging during monsoon and non-monsoon seasons at Delhi, India. Journal of Atmospheric Chemistry, 76(3), 171-200.
CrossRef - Fang, G. C., Huang, W. C., Zhuang, Y. J., Huang, C. Y., Tsai, K. H., & Xiao, Y. F. (2018). Wet depositions of mercury during plum rain season in Taiwan. Environmental geochemistry and health, 40(4), 1601-1607.
CrossRef - Zhao, S., Zhu, L., & Li, D. (2015). Microplastic in three urban estuaries, China. Environmental Pollution, 206, 597-604.
CrossRef - Qin, J., Liu, Y., & Grosvenor, R. (2016). A categorical framework of manufacturing for industry 4.0 and beyond. Procedia cirp, 52, 173-178.
CrossRef - Huang, X., Zhao, Z., Cao, L., Chen, Y., Zhu, E., Lin, Z., ... & Huang, Y. (2015). High-performance transition metal–doped Pt3Ni octahedra for oxygen reduction reaction. Science, 348(6240), 1230-1234.
CrossRef - Xu, J., Kleja, D. B., Biester, H., Lagerkvist, A., & Kumpiene, J. (2014). Influence of particle size distribution, organic carbon, pH and chlorides on washing of mercury contaminated soil. Chemosphere, 109, 99-105.
CrossRef - Huang, J., Kang, S., Wang, S., Wang, L., Zhang, Q., Guo, J., ... & Tripathee, L. (2013). Wet deposition of mercury at Lhasa, the capital city of Tibet. Science of the total environment, 447, 123-132.
CrossRef - Huang, J., Kang, S., Zhang, Q., Yan, H., Guo, J., Jenkins, M. G., ... & Wang, K. (2012). Wet deposition of mercury at a remote site in the Tibetan Plateau: concentrations, speciation, and fluxes. Atmospheric environment, 62, 540-550.
CrossRef - Marumoto, K., & Matsuyama, A. (2014). Mercury speciation in wet deposition samples collected from a coastal area of Minamata Bay. Atmospheric environment, 86, 220-227.
CrossRef - Fu, X. W., Feng, X., Dong, Z. Q., Yin, R. S., Wang, J. X., Yang, Z. R., & Zhang, H. (2010). Atmospheric gaseous elemental mercury (GEM) concentrations and mercury depositions at a high-altitude mountain peak in south China. Atmospheric Chemistry and Physics, 10(5), 2425-2437.
CrossRef - Lombard, M. A. S., Bryce, J. G., Mao, H., & Talbot, R. (2011). Mercury deposition in southern New Hampshire, 2006–2009. Atmospheric Chemistry and Physics, 11(15), 7657-7668.
CrossRef - Lombard, M. A. S., Bryce, J. G., Mao, H., & Talbot, R. (2011). Mercury deposition in southern New Hampshire, 2006–2009. Atmospheric Chemistry and Physics, 11(15), 7657-7668.
CrossRef - Singh, S., &Kulshrestha, U. C. (2012). Abundance and distribution of gaseous ammonia and particulate ammonium at Delhi, India. Biogeosciences, 9(12).
CrossRef - Guenther, A. B., Jiang, X., Heald, C. L., Sakulyanontvittaya, T., Duhl, T., Emmons, L. K., & Wang, X. (2012). The Model of Emissions of Gases and Aerosols from Nature version 2.1 (MEGAN2. 1): an extended and updated framework for modeling biogenic emissions.
CrossRef - Fowler, D., Pilegaard, K., Sutton, M. A., Ambus, P., Raivonen, M., Duyzer, J., ... &Granier, C. (2009). Atmospheric composition change: ecosystems–atmosphere interactions. Atmospheric Environment, 43(33), 5193-5267.
CrossRef - Kumari, A., Kumar, B., Manzoor, S., &Kulshrestha, U. (2014). Status of atmospheric mercury research in South Asia: a review. Aerosol and Air Quality Research, 15(3), 1092-1109.
CrossRef - Outridge, P. M., Mason, R. P., Wang, F., Guerrero, S., &Heimbürger-Boavida, L. E. (2018). Updated global and oceanic mercury budgets for the United Nations Global Mercury Assessment 2018. Environmental science & technology, 52(20), 11466-11477.
CrossRef - Willey, J. D., Kieber, R. J., Eyman, M. S., & Avery Jr, G. B. (2000). Rainwater dissolved organic carbon: concentrations and global flux. Global Biogeochemical Cycles, 14(1), 139-148.
CrossRef


