Flood Hazard Modelling in Upper Mandakini Basin of Uttarakhand
Gagandeep Singh1
 , Vishwa Bandhu Singh Chandel2
*
and Simrit Kahlon2
, Vishwa Bandhu Singh Chandel2
*
and Simrit Kahlon2
http://dx.doi.org/10.12944/CWE.16.3.18
Copy the following to cite this article:
Singh G, Chandel V. B. S, Kahlon S. Flood Hazard Modelling in Upper Mandakini Basin of Uttarakhand. Curr World Environ 2021;16(3). DOI:http://dx.doi.org/10.12944/CWE.16.3.18
Copy the following to cite this URL:
Singh G, Chandel V. B. S, Kahlon S. Flood Hazard Modelling in Upper Mandakini Basin of Uttarakhand. Curr World Environ 2021;16(3). Available From: https://bit.ly/3oHAC4M
Download article (pdf) Citation Manager Publish History

Introduction
Floods by far are the most lethal of all disasters that claimed 6.8 million human lives in twentieth century1; about 44 percent flood events since 1960 have occurred in Asia2.India accounts for one-fifth of the global deaths due to floods; about 12 percent of its land is prone to floods that displace over 30 million peoples and affect 8 million hectares land annually3,4,5.The Himalayan mountains are sensitive to multiple hazards6-11 of which flood is most lethal. Climate change is triggering frequent disasters12 and rapid glacier melt that has escalated the risk of glacial lake outburst floods13.The active tectonics and high potential energy of Himalayan terrain create conditions for multiple hazards exacerbated by hydro-meteorological forces14,15,16. Such processes resurface in same geographical localesand therefore add to the severityof disasters. Moreover, such inherent hazardousness gets amplified as anthropogenic activities exposes more people to potential disasters. It is in this sense, a comprehensive understanding of threats associated with potential flood events is highly needed.
Upper Mandakini basin of the Garhwal Himalayas of Uttarakhand has a rugged topography; its elevation rangesfrom 948 to 7000 meters above mean sea level.Tectonically active faults and thrusts control relief and drainage in the basin that has high mountains and glaciers in north and east while fluvial terraces dominate its southern parts. Climate is highly variable and rainfall is heaviest during the monsoon (late June to mid-September) season. Thesummer temperature reaches 34°C while winters are extremely cold. River Mandakini originates from glaciers north of Kedarnath; its major tributaries include Vasuki Ganga, Sina Gad, Kali Ganga, Markanda Ganga, Kyar Gad, Mandani Ganga and Madhyamaheshwar Ganga.
The study area exhibits interplay of glacial and fluvial processes; it represents a complex geo-physical setup prone to a multitude of hazards. The basin is situated in very high seismic risk zone; its weak structure is prone to slope failure. The altitudinal and climatic juxtaposition makes it susceptible to cloudbursts and flash floods. The dense network of streams produces a high degree of landscape incision and rivers flowing through a steep gradient surface possess high flow velocity and potential energy. A highly intense rainfall during July-September enhances rivers’ peak discharge and kinetic energy to transportation large sized sediments leading to bank erosion, and slope failure. All these factors exert a great deal of influence on physical susceptibility of study area to flood hazard.
The study area is sparsely populated; about 41,415 people resides in 109 villages out of which six are un-inhabited. The tehsil headquarter is located at Ukhimath while Kedarnath is the only statutory town.The area has agrarian character; however, tourism has gained momentum over the years and is major source of incomethrough heavy influx of religious tourists during June-September which also coincides with high disaster frequency. The susceptibility of study area to floodslargely depends on its terrain characteristics, drainage, hydrology and climate. Therefore, determination of flood risk necessitates assessment of flow characteristics under given river discharge. In this paper, an attempt was made to highlight flood hazard characteristics and risk in the upper Mandakini basin.The aim was to explore physical dimensions of critical zones prone to flood hazard by taking to consideration the physical landscape, drainage, and hydrological attributes. Such characterization provides an understanding of terrain hazardousness, flow potential and volume estimation during extreme flow discharge conditions and therefore helps in visualizing risk associated with flood hazard in the study area.
Material and Methods
Flood hazard research primarily focuses on documentation and mapping of flood prone areas, flood characteristics, delineation of trigger mechanisms, and flood simulations using scientific evidences, materials and methods. This paperexamined flood hazard through a simulation model(Figure 1) to understand stream flow behaviour during flood conditions. The inventory onhistorical flood eventscompiled from secondary sources combined with cutting edge geospatial technology and spatial analysis was used to carry out the analysis. Flood modelling was carried out to simulate flow characteristics and inundation scenario under different river discharge volumes of 900, 1500 and 3909 cumec (cubic meter per second or m3/s) using HEC-RAS and Arc-GIS software. HEC-RAStool allow for modelling the behavior of flood water extant17,18,19 by taking into account both 1D and 2D dimensions of flood along with other important indicators such as velocity, depth and top width of flood water20.
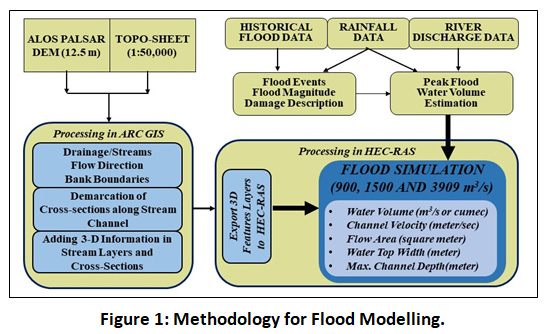 |
Figure 1: Methodology for Flood Modelling. Click here to view Figure |
In this study, flood simulation was based on steady flow analysis in which flow properties re assumed to be independent of time, i.e., the derivative of this property with time is zero (∂P/∂t = 0,Where P is any property like pressure, velocity or density). The steady flow analysis provides fairly accurate results; however, it has limitation as uniform flow analysis does not depend by the time and distance. Therefore, visualizing how flood water will behave at different points in time during an event remains unclear. Moreover, if computation of river discharge characteristics is done for fewer cross sections, it may not give substantial insight to flood scenario. To overcome this limitation, the river discharge was computed for 22 cross-sections in different streams of the study area (Figure 2) that included flow volume (m3/s), minimum channel elevation (meter), water surface elevation (meter), channel velocity (meter/second), flow areas (square meter), top width of flow (meter) and maximum channel depth (meter).These cross sections are representative of different terrain setups within the study area. In addition, flood simulation for 2 sections (Figure 3) along River Mandakini was done to visualize flood riskat different flow discharge scenarios.
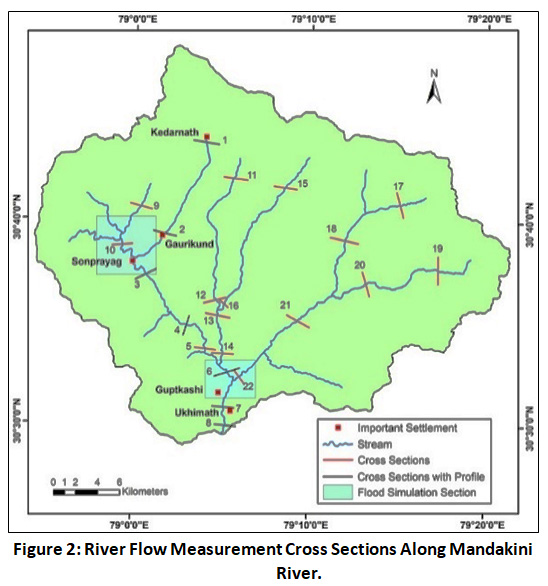 |
Figure 2: River Flow Measurement Cross Sections Along Mandakini River. Click here to view Figure |
Results and Discussion
Flash-Floods and Cloudbursts in the Study Area
The study area has history of weather extremes of heavy downpour causing flash-floods and cloudbursts (Table 1). Such events result from intense vortices of small spatial scale airmass rising rapidly to form cumulonimbus clouds. Under such conditions, rainfall of more than 100 mm/hour over a small area produces cloudburst21,22. Uttarakhand has highest flash-flood casualty rate in India23 and such events are triggered by heavy rainfall, cloudburst, glacial lake outburst and landslide induced dam outburst. Generally, the occurrence is confined to monsoon season24; however, floods of June 2013 and February 2021 shows flood potential in other seasons as well.
The analysis reveals more than 6000 confirmed human casualties in the study area since 1990.A massive landslide at Paundar village in 1998 blocked River Madhyamaheshwar and subsequent outbursts caused havoc25. Another cloudburst that struck Phata village in July 2001 claimed 28 people26.There were 2 cloudbursts; one near Kedarnath and other near Jungle Chatti on 5th and 7th July, 2005. The occurrence of flash-floods was conspicuous in 2012; two events occurred on 4th and 19th Julyin Mandakini and Kali Ganga valleys, respectively. However, the most devastating event took place in mid-September wherein a series of cloudbursts hit three villages of Giriya, Mangoli and Chunni (Table 1).These events claimed 60 lives, destroyed 7 houses while 57 houses suffered partial damage.One of the most wrecking events played havoc in 2013 wherein a series of cloudbursts, exceptionally highrainfall (above 250 mm)and Chorabari lake outbursts in north of Kedarnath caused considerable damage; more than 6600 people were killed, over 600 houses, 500 roads and 150 bridges damaged27,28,29(Dobhal et al. 2013; Asthana and Asthana 2014; Champati Ray et al. 2016).
Since late 1990s, as many as 18 major incidents of extremely high precipitation have occurred out of which 13 were cloudburst driven while remaining were flash-floods without cloudburst. Nearly half of these events were located in the upper parts of Mandakini River basin between Kedarnath and Sonprayag whereas 5 cloudbursts took place around Ukhimath-Guptkashi area. A narrow valley and steep stream gradient in the former amplify flow velocity and erosional capacity of river thus making area highly vulnerable. The occurrence of floods was strictly confined to the monsoon season until the Kedarnath disaster in pre-monsoon season. It suggests a high potential for random extreme flood events outside monsoon season.
Table 1: Major Cloudburst and Flashflood Events in Upper Mandakini River Basin.
|
Date |
Event |
Event |
Latitude |
Longitude (E) |
Damage Caused/ |
|
|
1 |
19-08-98 |
Paundar |
Flashflood |
30.568 |
79.13 |
Over 100 people got killed, created havoc downstream. |
|
2 |
17-07-01 |
Phata |
Cloudburst and Flashflood |
30.582 |
79.042 |
28 people got killed; six animals died and 77 houses were completely damaged; pilgrims stranded. |
|
3 |
05-07-05 |
Kedarnath |
Cloudburst and Flashflood |
30.733 |
79.068 |
10 shops were completely destroyed and 4 got partially damaged. |
|
4 |
07-07-05 |
Jungle Chatti |
Cloudburst and Flashflood |
30.675 |
79.041 |
One person got killed and one house suffered partial damage. |
|
5 |
04-07-12 |
Gauri Kund |
Cloudburst and Flashflood |
30.656 |
79.022 |
Road got damaged at one place. |
|
6 |
19-07-12 |
Chaumasi |
Cloudburst and Flashflood |
30.614 |
79.073 |
One house suffered partial damage. |
|
7 |
14-09-12 |
Kimada/ Giriya |
Cloudburst and Flashflood |
30.542 |
79.122 |
60 people got killed and 12 got lost; 86 animals died; 7 houses were completely destroyed and 58 got partially damaged |
|
8 |
14-09-12 |
Mangoli |
Cloudburst and Flashflood |
30.526 |
79.106 |
|
|
9 |
14-09-12 |
Chunni |
Cloudburst and Flashflood |
30.532 |
79.105 |
|
|
10 |
17-06-13 |
Phata |
Cloudburst and Flashflood |
30.580 |
79.039 |
Over 200 got killed and 3998 went missing; 2771 animals got killer or went missing; about 1720 houses got damaged; roads and footpaths got damaged at 243 spots. |
|
11 |
17-06-13 |
Mangoli |
Cloudburst and Flashflood |
30.527 |
79.100 |
|
|
12 |
17-06-13 |
Kimana |
Cloudburst and Flashflood |
30.505 |
79.097 |
|
|
13 |
17-06-13 |
Kedarnath |
Cloudburst and Flashflood |
30.736 |
79.090 |
|
|
14 |
17-06-13 |
Rambara |
Flashflood |
30.700 |
79.051 |
|
|
15 |
17-06-13 |
Gaurikund |
Flashflood |
30.656 |
79.020 |
|
|
16 |
17-06-13 |
Sonprayag |
Flashflood |
30.634 |
79.000 |
|
|
17 |
27-06-15 |
Sonprayag |
Flashflood |
30.634 |
79.000 |
Bridge was washed away. |
|
18 |
06-07-15 |
Jungal Chatti |
Cloudburst and Flashflood |
30.676 |
79.041 |
Triggered landslide; Char-dham yatra got suspended. |
Source: Compiled from The Tribune (1990-2017) and Disaster Mitigation and Management Centre (DMMC) Uttarakhand (2001-2014)
Flood Hazard Modelling and Analysis
Floods hazard analysis involves assessment of flow characteristics. In this study, flood modelling was carried out under three different river discharge conditions of 900, 1500 and 3909 cumec for 22 cross-sections. These characteristics revealed critical information about rise in water level and flood inundation risk at each cross-section (Table 2). The flow behaviour in Mandakini River was calculated at 8 cross sections between Kedarnath and Lwara village near Ukhimath. At a normal flow of 900 m3/s, Kedarnath cross-section shows channel depth of 1.41 meter with a velocity of 3.426 meter/second and width of water surface 38.40 meter. A relatively wide u-shaped valley in this upper part of river course produces low water depth; however, with an increase of flow to 1500 m3/s, water depth changes to 1.88 meter with top flow width of 43.71 meter and channel velocity of 3.96 meter/second. Under extreme flow discharge of 3900 m3/s (equivalent of peak discharge during Kedarnath floods in June 2013), river water rises to alarming level of 4.67 meter with channel velocity of 7.36 m/s whereas flood attains width of nearly 63.68 meters at surface.
The second cross section at Gaurikund that has a history of massive damage due to floods shows high risk of floods. At 900 m3/s, water depth is 2.04 meters; channel top width is 26.11 meters and channel velocity is 4.075 meter/second. At this location narrow valley produces small channel width but velocity gets accelerated tremendously. These values at 1500 m3/s reaches to 2.65 meter, 29.46 meter and 4.66 meter/second, respectively while same parameters attain staggering levels of 6.81 meter, 49.30 meter and 7.73meter/second under GLOF/LLOF scenario at 3909 m3/sdischarge. The water rises to 2.04 meter, 2.65 meter and 6.81 meter under 900 m3/s, 1500 m3/s and 3909 m3/s condition, respectively. The third cross-section at Nyalsu village south of Sonprayag shows channel depth of 2.20 meter with top width of 39.30 meter and velocity of 5.77 meter/second at 900 m3/s discharge rate. High velocity at the cross section is due to addition of water at the confluence of Vasuki Ganga and Mandakini at Sonprayag. The water level increase to 5.57 meter with channel velocity 9.71 meter/second and channel top attain width of 61.73 meters under 3909 m3/sflow scenario.
Further downstream at Khatvillage, a low channel gradient causes substantial decline in channel velocity but produces high channel depth, flow area and flow top width. Under 3909 m3/s scenario, water level increases up to 12.16 meter high with channel top width reaching 73.44 meter. As valley gradient increases, flow characteristics change around Kalimath village; there is noticeable reduction in channel depth which is expected to rise up to 3.38 meter, 4.42 meter and 8.56 meter under 900 m3/s, 1500 m3/s and 3909 m3/s scenario, respectively. The next cross section at Hyuna village represents confluence of Mandakini and Kali Ganga rivers. Here, water depth at 900 m3/s is 6.48 meter which increase to 7.78 meter at 1500 m3/s and 11.41 meter at 3909 m3/s flow condition (Table 2). This sudden increase in water depth is due to less channel gradient and narrow valley. The two cross sections in lower parts of Mandakini river near Ukhimath show similar results. The water level rises up to 4.97 meter with channel velocity of 5.58 meter/second at Thaglasi and 5.94 meter and 7.06 meter/second at Lwara under 900 m3/s water discharge condition. These values further increase to 6.14 meter and 6.85 meter/second and 7.62 meter and 8.13 meter/second at 1500 m3/s scenario. In worst case scenario of 3903 m3/s, river water may potentially attain incredible height of 9.80 meter and 12.23 meter at Thaglasi and Lwara villages, respectively.
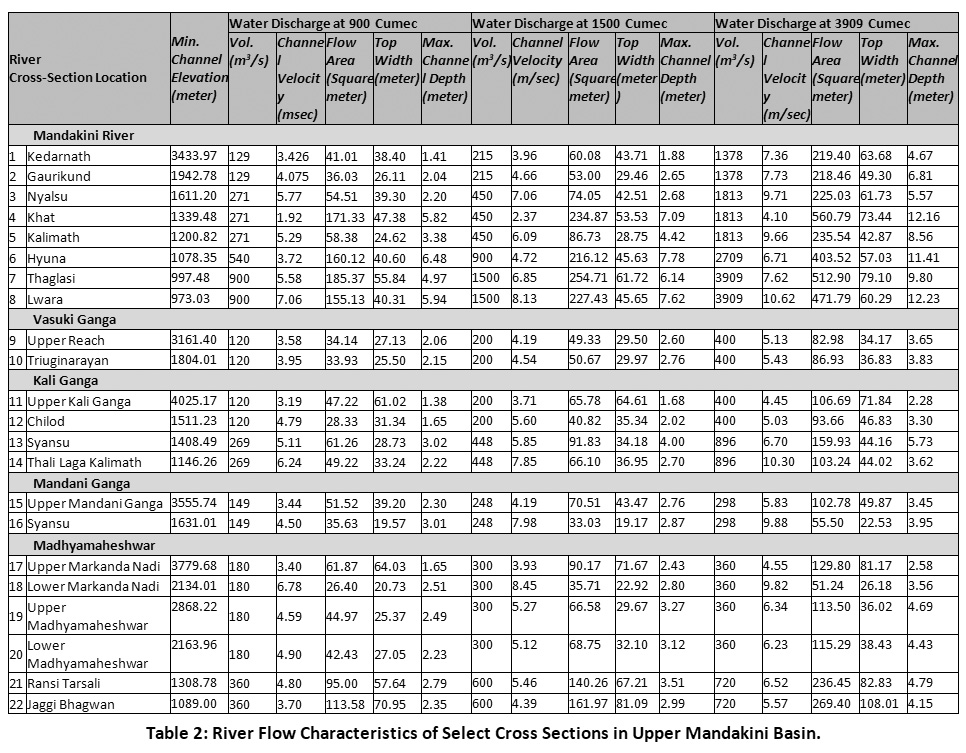 |
Table 2: River Flow Characteristics of Select Cross Sections in Upper Mandakini Basin. Click here to view Table |
River Vasuki Ganga drains into Mandakini at Sonprayag. Two cross sections selected along its course, first at the source and other at village Triuginarayan shows a potential of over 2 meter water depth and 3-4 meter/second velocity at 900 m3/s discharge. At 1500 cumec, water depth changes to above 2.5 meter with velocity of over 4 meter/second (Table 2) while velocity of above 5 meter/second is attained under conditions similar to June 2013 flash-flood. Kali Ganga and Mandani Gangaare important tributaries that flows through central part of the study area. The cross-sections at 4 locations in former and 2 in the latter shows results analogues to Vasuki Ganga. Flow depth and velocity for Kali Ganga varies between 1-3 meter and 3-6 meter/second under 900 m3/s that changes to 2-6 meter depth and 5-10 meter/second velocity at 3909 m3/s. Under similar conditions, maximum flow depths in Mandani Ganga remain between 3-4 meter. The first cross-section in this stream shows low channel depth due to wider valley but it increases at second cross section near Syansu (upper). A noticeable increase in discharge volume takes place after these two converges. The cross section at Syansu (lower) village due to narrow valley and relatively gentle gradient shows increase in water depth; the maximum depth attained is 5.73 meter under 3909 cumec.
River Madhyamaheshwar is a major tributary of Mandakini; it has two sub-tributaries, viz. Markanda Ganga and Madhyamaheshwar Nadi. The upper valleys of both tributaries are devoid of human habitation; settlements are located downstream the confluence of these two tributaries. The two cross-section each in the upper parts of these sub-tributaries were selected in addition to two more cross sections along the major river. The velocity and water depth in Markanda Ganga increases with distance from its source area but scenario is opposite for other tributary due to increase in valley width toward its lower reaches. The two cross-sections at middle and lower sections of River Madhyamaheshwar shows potential of over 2 meter, 3 meter and 4-5 meter water depth at 900 m3/s, 1500m3/s and 3909 m3/s water discharge, respectively (Table 2). The cross section at Ransi Tarsali village in Madhyamaheshwar River shows maximum potential for water depth which in worst case scenario may attain the height of 4.79 meters. A lower potential for water depth and flow velocity in Madhyamaheshwar River compared to other large streams is due of its wider channel top and a relatively broader valley with gentler gradient.
The overall analysis of stream flow characteristics reveals high potential for flash-flood. The average streams flow is likely to rise by 2.91 meter with a velocity of 4.53 meter/second and flood water surface to spread by 38.37 meter at stream water discharge of 900 cumec. This situation changes to staggering 5.69 meter rise in water level with average velocity of 7.07 meter/second and surface width of 55.02 meter under water discharge of 3900 cumec (Table 3). A change in flood volume from 900 m3/s to 1500 m3/s is likely to raise flood level almost by 25 per cent but scenario becomes extremely dangerous as there is a possibility of 95 per cent increase in water depth in case discharge rate changes to 3909 m3/s. Under such conditions flood velocity is expected to increase by 20 percent and 55 percent while flood width may expand by 12.41 percent and 43.39 percent, respectively.
Table 3: Average Flow Characteristics in Upper Mandakini Basin.
|
Parameter |
Average Water |
Parameter |
Percentage Change in Water Parameter Values (%) |
|||
|
900 m3/s |
1500 m3/s |
3909 m3/s |
900-1500 m3/s |
900-3909 m3/s |
||
|
Depth (meter) |
2.91 |
3.62 |
5.69 |
Depth |
24.39 |
95.53 |
|
Velocity (meter/second) |
4.53 |
5.47 |
7.07 |
Velocity |
20.75 |
56.07 |
|
Top Width (meter) |
38.37 |
43.13 |
55.02 |
Top Width |
12.41 |
43.39 |
The analysis shows high potential for rapid change in flow characteristics during an event of extreme precipitation. Flood simulation at different flow conditions for two locations (Figure 3) shows tremendous flood water rise and inundation of valley floor in Sonprayag-Nyalsu and Guptkashi-Ukhimath area. The inundation remains confined to areas along river channels at 900 cumec but flood water rises to critical levels as flow discharge increases beyond 1500 cumec. Under such circumstances, settlements, roads and other infrastructure in the vicinity of valley floor submerges under flood water. It is important to mention that like any other Himalayan valleys, the study area too is undergoing massive infrastructure development closer to rivers and valley floor. This further enhances economic risk associated with floods.
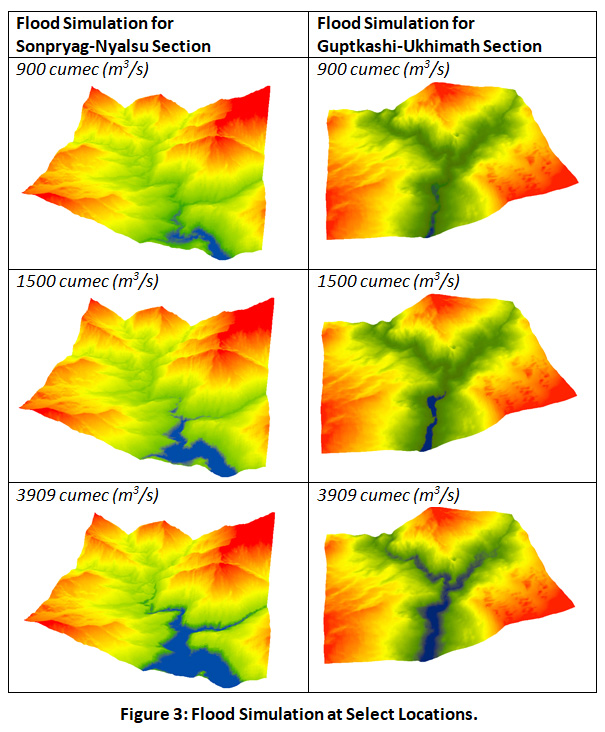 |
Figure 3: Flood Simulation at Select Locations. Click here to view Figure |
Conclusions
Floods in the upper Mandakini River basin represent an extremely hazardous interplay of natural processes that have resulted in unprecedented destruction in the past. The reconstruction of flood hazard simulation shows a high degree of risk attributed to steep gradient, high streamflow, high kinetic energy of streams, and high probability of intense rainfall. A sudden rise in peak streamflow in response to heavy rainfall and cloudburst conditions has the potential to enhance flow capacity of river channels to great extent thereby triggering landslides and flash-floods. The impacts are likely to be devastating as terrain characteristics accentuate flow velocity, water spread and the river’s capacity to erode and carry sediment. Floods in the study area also display the role of natural forces coupled with anthropogenic elements. The risk is exceptionally high, especially in the upper sections of Kali Ganga, Mandani Ganga, Madhyamaheshwar and Mandakini rivers. Although, such areas are largely devoid of human habitation and thus possess low human vulnerability but active presence of anthropogenic in Mandakini valley raises serious concerns. Regardless of the low population, it is important to mention that extreme events are likely to trigger massive destruction as this mountainous terrain crisscrossed by numerous streams is vulnerable to frequent slope failure and flash-floods. As human habitations and associated economic activities are concentrated mainly along with the valley floors, such flow scenarios may translate into gruesome reality. Considering the history of extreme precipitation led flash floods at a smaller spatial scale and a specific case of major flood event during the 2013 Kedarnath tragedy, it is evident that the flow regime in the study area is capable of creating an irreparable loss.
Conflict of Interest
The author(s) declares no conflict of interest.
Acknowledgments
The authors would like to thank the Department of Geography, Panjab University, Chandigarh for granting access to the GIS Lab Facility. The authors are also grateful to the Department of Disaster Mitigation and Management Centre Uttarakhand for the data and Information, Survey of India, Dehradun for providing the topographical sheets.
Funding Source
There is no funding or financial support for this research work.
References
- Doocy S., Daniels A., Murray S., and Kirsch T. D. The Human Impact of Floods: A Historical Review of Events 1980-2009 and Systematic Literature Review. PLoSCurr. 2013;5(5). doi: 10.1371/currents.dis.f4deb457904936b07c09daa98ee8171a (accessed on 31 January 2021).
CrossRef - World Disaster Report. Come Heat or High Water: Tackling the Humanitarian Impacts of the Climate Crisis Together. 2020; International Federation of Red Cross and Red Crescent Societies, Geneva, Switzerland.
- Gupta S., Javed A. and Datt D. Economics of flood protection in India. Nat Hazards. 2003; 28:199-210.
CrossRef - Planning Commission, Government of India. Eleventh Five Year Plan, 2007-12, Volume I: Inclusive Growth. 2008. Oxford University Press, New Delhi.
- Singh O., and Kumar M. Flood events, fatalities and damages in India from 1978 to 2006. Nat Hazards. 2013; 69: 1815-1834.
CrossRef - Gardner J.S. Tourism and risk from natural disasters, Manali, Himachal Pradesh, India. In Disasters, Environment and Development, ed. R. B. Singh. 1996; 107-120. New Delhi: Oxford and IBH Publication.
- Gardner J.S. Natural hazards risk in the Kullu district, Himachal Pradesh, India, Geographical Review. 2002; 92(2): 282-306.
CrossRef - Chandel V.B.S. and Brar K.K. Climatic Extremes and Changing Climate in Western Himalayas: A Study of Cloudburst Incidences in Himachal Pradesh. Punjab Geographer. 2010; 6: 29-40.
- Chandel V.B.S. and Brar K.K. Multi-Disaster Risk and Vulnerability in Western Himalayan State of Himachal Pradesh. Punjab Geographer.2011; 7: 9-19.
- Kahlon S., Chandel V.B.S. and Brar K.K. Landslides in Himalayan Mountains: A study of Himachal Pradesh, India. International Journal of IT, Engineering and Applied Sciences Research. 2014; 3 (9): 28-34.
- Nie Y., Liu Q., Wang J., Zhang Y., Sheng Y. and Liu S. An inventory of historical glacial lake outburst floods in the Himalayas based on remote sensing observations and geomorphological analysis. Geomorphology. 2018; 308:91-106.
CrossRef - Shrestha B., Mool P.K. and Bajracharya S. R. Impact of Climate Change on Himalayan Glaciers and Glacial Lakes: Case Studies on GLOF and Associated Hazards in Nepal and Bhutan. 2007; International Centre for Integrated Mountain Development (ICIMOD); United Nations Environment Programme (UNEP), Kathmandu, Nepal.
CrossRef - Bajracharya S.R., Mool P.K. and Shrestha B.R. Impact of Climate Change on Himalayan Glaciers and Glacial Lakes: Case Studies on GLOF and Associated Hazards in Nepal and Bhutan. 2007; Kathmandu: ICIMOD.
- Chandel V.B.S., Brar K.K. and Chauhan Y. RS & GIS based landslide hazard zonation of mountainous terrains: A study from middle Himalayan Kullu district, Himachal Pradesh, India. International Journal of Geomatics and Geosciences. 2011; 2(1): 121-132.
- Chandel V. B. S., Brar K. K. and Kahlon S. Land use/cover change and its implications for Kullu district of Himachal Pradesh, India. International Journal of Geomatics and Geosciences. 2013; 3(3): 538-551.
- Chandel V.B.S., Kahlon S. and Brar K.K. Flood disaster in mountain environment: A study of Himachal Pradesh, India. In Managing Our Resources: Perspectives and Planning, eds. D.D. Sharma and B. R. Thakur. 2014; New Delhi: Bharti Publications.
- Ä°caga Y., Tas E. and Kilit M. Flood inundation mapping by GIS and a hydraulic model (HEC RAS): A case study of AkarcayBolvadin sub-basin, in Turkey. Acta Geobalcanica. 2016; 2(2): 111-118.
CrossRef - Thakur B., Parajuli R., Kalra A., Ahmad S. and Gupta R. Coupling HEC-RAS and HEC-HMS in Precipitation Runoff Modelling and Evaluating Flood Plain Inundation Map. In World Environmental and Water Resources Congress. 2017: 240-251.
CrossRef - Abdulrazzak M.,ElfekiA., Kamis A., KassabM., Alamri N., Chaabani, A. and Noor, K. Flash flood risk assessment in an urban arid environment: a case study of Taibah and Islamic Universities’ campuses, Medina, Kingdom of Saudi Arabia. Geomatics, Natural Hazards and Risk. 2019; 10(1): 780-796.
CrossRef - Dimitriadis P., Tegos A., Oikonomou A., Pagana V., Koukouvinos A., Mamassis N. and Efstratiadis A. Comparative evaluation of 1D and quasi-2D hydraulic models based on benchmark and real-world applications for uncertainty assessment in flood mapping. Journal of Hydrology. 2016; 534: 478-492.
CrossRef - Das P.K. The monsoons. 1988; National Book Trust, India.
- Das S., Ashrit R. and Moncrieff M.W. Simulation of Himalayan cloudburst event. Journal of Earth System Science. 2006; 115(3): 299-313.
CrossRef - Pandey R.K. Flash flood disasters in Uttarakhand. Disaster Prevention and Management. 2010; 19 (5): 565-570.
CrossRef - Asthana A. K. L. and Sah M. P. Landslides and cloudbursts in the Mandakini Basin of Garhwal Himalaya. Himalayan Geology. 2007; 28(2): 59-67.
- Rautela P. and Thakur V.C. Landslide Hazard Zonation in Kaliganga and Madhyamaheshwar valleys of Garhwal Himalaya: A GIS-based approach. Himalayan Geology. 1999; 20(2): 31-44.
- United News of India (UNI). 28 landslip deaths in Uttaranchal. www.tribuneindia.com.https://www.tribuneindia.com/2001/20010718/nation.htm#15. 18th July 2001. Accessed on 14 August 2021.
- Dobhal D.P., Gupta A.K., Mehta M. and Khandelwal D.D. Kedarnath disaster: Facts and plausible causes. Current Science. 2013; 105(2): 171-174.
- Asthana A. K. L. and Asthana H. Geomorphic control of cloud bursts and flash floods in Himalaya with special reference to Kedarnath area of Uttarakhand, India. International Journal of Advancement in Earth and Environmental Sciences. 2014; 2(1):16-24.
- Champati Ray P. K., Chattoraj S. L., Bish M.P.S., Kannaujiya S., Pandey K. and Goswami A. Kedarnath disaster 2013: causes and consequences using remote sensing inputs. Nat Hazards.2016; 81:227-243.
CrossRef


