Heavy Metals in Agricultural Soils of National Capital Region, Delhi: Levels and Ecological Risk
Jyoti Rani1
, Tripti Agarwal2
and Sudesh Chaudhary1
*

http://dx.doi.org/10.12944/CWE.16.3.13
Copy the following to cite this article:
Rani J, Agarwal T, Chaudhary S. Heavy Metals in Agricultural Soils of National Capital Region, Delhi: Levels and Ecological Risk. Curr World Environ 2021;16(3). DOI:http://dx.doi.org/10.12944/CWE.16.3.13
Copy the following to cite this URL:
Rani J, Agarwal T, Chaudhary S. Heavy Metals in Agricultural Soils of National Capital Region, Delhi: Levels and Ecological Risk. Curr World Environ 2021;16(3). Available From: https://bit.ly/3mvm0o2
Download article (pdf) Citation Manager Publish History

Introduction
Indian economy is agriculture based; employing 42 percent of the population and with average Indian spending about 45 percent of its expenditure on food.1 Haryana is one of the fastest-growing states of India and is a part of the economically important national capital region of the country. The state is also known as the “Breadbasket of India” as it contributes to 60 % of the total basmati rice export.2 Rapid industrialization in the state has resulted in the immigration of a large population to the area which led to unregulated usage of natural resources. These factors have contributed to an increased level of pollution in the environment during recent decades. As there is no boundary line of the environment, pollutants such as persistent organic pollutants, particulate matters, volatile organic compounds, polyaromatic hydrocarbons, heavy metals, etc., pass from one medium to another. The lead emitted into the atmosphere by leaded petrol had left its residues on plants, soil, and water.3-5 Although all the pollutants are harmful but heavy metals exposure to humans may cause serious health issues.6 Heavy metals are entering agricultural soils through air and water pathway and increasing the chances of human exposure to them.7
The industries along with increasing population are playing a major role in emitting heavy metals in the natural environment through solid and liquid waste discharge, on land and water bodies.8, 9 The use of wastewater for irrigation and sewage sludge as manure in agricultural fields has resulted in increased levels of metals in soils.10, 11 Application of animal manure in the agriculture also caused heavy metals enrichment in agricultural soil.12 Illegal discharge of the wastewater into natural water bodies and soil ecosystems is a contributing factors for high concentrations of heavy metals in agricultural soils to a large extent. 13 Agricultural activities (like application of pesticides and fertilizers spray) also contribute heavy metals in agricultural soils.7
Soil, which is an important natural resource, serves as the basis for food production. It also acts as a natural filter to remove pollutants from the water which infiltrates down into the underground water reservoirs. Heavy metals present in agricultural soil can leach into groundwater; the use of this contaminated groundwater will further increases the concentration of heavy metals in vegetables if used for irrigation.14, 15 The vegetables cultivated in heavy metal contaminated soil have shown accumulation of the metals in their edible parts. 16, 17 The change in physical factors like pH and cation exchange capacity with time may change the bioavailability of heavy metals to growing crops.18 The application of compost can increase the uptake of the metals by the plants.19 These heavy metals may enter human beings through the ingestion of contaminated food.20 The heavy metals present in vegetables may pose serious health issues like effect on the nervous system and kidneys. 21 The present study was conducted in the National capital region (NCR), Delhi, India during 2017-18. In this study, heavy metal contamination in agricultural soil was evaluated as this area is characterized by high industrialization and intensive agricultural activities. This area is in a highly developing stage due to high industrialization. High population pressure has also resulted in the discharge of waste in the Yamuna river and nearby drains which are used for irrigation purposes that may cause high levels of heavy metals in the agricultural soils. Literature related to assessment of heavy metals in the agricultural soil of this region was very limited. This study has been carried to assess the heavy metals concentrations in agricultural soils and their potential ecological risk.
Materials and Methods
Description of the Study Area
The National Capital Region (NCR) of India is the 2nd largest urban agglomeration in the world. Haryana contributes 48.93 percent (28,545 Km2) area of this NCR (58,332Km2) with 13 districts.22 Industrialization in the NCR of Delhi is growing at a rapid pace. Four districts (Panipat, Sonipat, Gurugram, and Faridabad) of the NCR, Delhi have been selected for the present study (Table 1, Figure 1). This region lies in the green revolution belt of the country. Horticulture is done on nearly 28.36 percent of the study area and the crops grown in this area include cereals, pulses, fruits, and vegetables. The study area is having more than 60 percent of the total industries of Haryana. The different types of industries located in the area include metal and mineral-based, agro-based, electrical machinery, engineering units, repair and servicing, textile, auto parts, rubber, plastic, petro based motorcycle parts, diesel engines, etc.23 The emission from these industries can contribute to a significant concentration of heavy metals pollution in the surrounding area. Therefore, there is a need to assess the impact of industrialization in the area. Thus, considering the above point, the heavy metals concentration in agricultural soil samples was assessed in the present study.
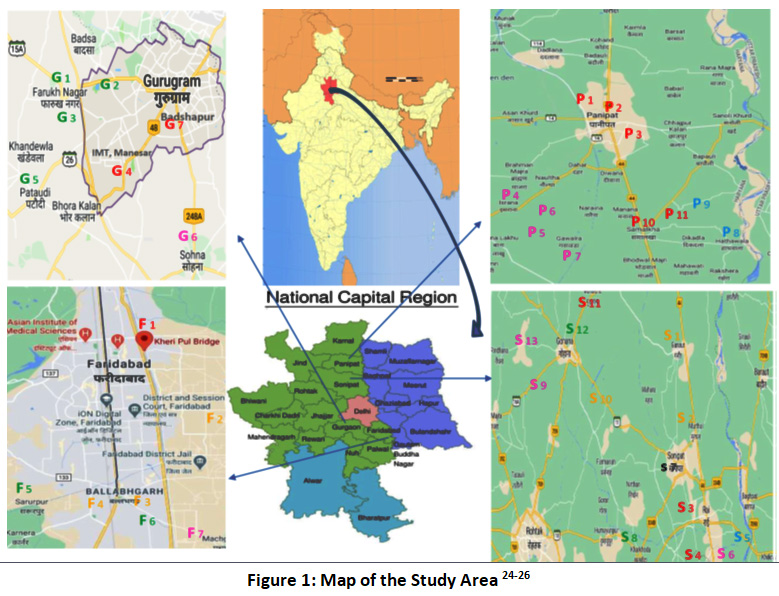 |
Figure 1: Map of the Study Area 24-26 Click here to view Figure |
(sites located near industrial areas are marked in the map in red color, national highways in orange color, state highways in pink color residential in green, Yamuna floodplain in blue color, and Wastewater irrigated in black color)
Table 1: Description of the Study Area.
|
Location |
Latitude |
Longitude |
Soil type |
|
Panipat |
29°09’ 15” & 29° 27’ 25” North |
76° 38’ 30” & 77° 09’ 15” East |
loamy to sandy loam |
|
Sonepat |
28°48’30” & 29°17’54” North |
76°28’30” & 77°13’40” East |
Fine loam and sandy |
|
Faridabad |
27°39’ & 28°31’ North |
76° 40’ & 77°32’ East |
tropical and brown |
|
Gurgaon |
27°39' & 28°32' 25’’ North |
76 ° 39' 30" & 77 °20' 45" East |
tropical and brown |
Collection of Soil Samples and Analysis
A total of 84 agricultural soil samples were collected from selected agricultural fields of NCR, Delhi, in such a way that the effect of various industries, national highways (NH), state highways (SH), Yamuna floodplain (NY), residential complexes (Res.), etc. on vegetable contamination can be taken into consideration. The sampling was done from May 2017 to February 2018. A 10 x 10 x 15 cm monolith was dug for a soil sample collection from five different locations in a field. Approximately 2 kg of agricultural soils were collected in zip-lock polybags and were brought to the laboratory.17
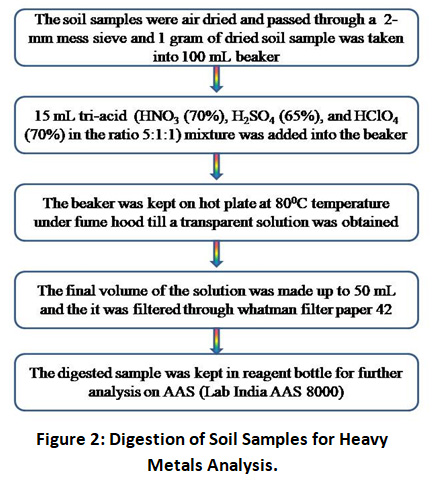 |
Figure 2: Digestion of Soil Samples for Heavy Metals Analysis. Click here to view Figure |
For analysis of a soil-water suspension (1:2.5) was prepared, and the pH was measured by dipping the pbobe of a digital pH meter in the suspension. 27 Walkley Black wet oxidation method was used for the determination of soil organic carbon.28 The procedure for heavy metal analysis of soil has been shown in figure 2. 3 The concentrations of different heavy metals in the filtrate were estimated by atomic absorption spectrophotometer (Lab India AAS 8000). The glassware used in experimentation was washed with a 10% HNO3 solution and then with double distilled water (DDW). Analytical grade chemicals and reagents used were purchased from Merck Company, Germany. The instrument was calibrated with a blank and reference standard of heavy metals of different concentrations shown in table 2. Blank and standard were run after every 10 samples for quality assurance; all the analysis was done in triplicate.
Table 2: Wavelength and Concentration of Standard of Heavy Metals in AAS Analysis.
|
Metal(s) |
Wavelength |
Standards concentrations |
R2 |
|
Al |
396.152 |
0.02-10 ppm |
0.99 |
|
Cd |
214.439 |
0.02-5 ppm |
0.99 |
|
Co |
238.892 |
0.02-5 ppm |
0.99 |
|
Cr |
267.716 |
0.02-5 ppm |
0.99 |
|
Cu |
327.395 |
0.02-5 ppm |
0.99 |
|
Fe |
238.204 |
0.02-10 ppm |
0.99 |
|
Mn |
257.610 |
0.02-5 ppm |
0.99 |
|
Ni |
231.604 |
0.02-5 ppm |
0.99 |
|
Pb |
220.353 |
0.02-2 ppm |
0.99 |
|
Zn |
213.857 |
0.02-5 ppm |
0.99 |
Assessment of Pollution Sources
Contamination factor, enrichment factor, and coefficient of variation were calculated for estimating the pollution levels of heavy metal in the soil samples collected in the present study. 29, 30
Contamination Factor (CF)
The contamination factor is the ratio of a specific metal content (Ci) in the soil to the background value (Cb) of that metal in the soil, and was calculated as follow:
CF= Ci/Cb Eq. (1)
Background concentrations of heavy metals in Haryana Indo-Gangetic plains (Fe, Pb, Cu, Mn, Co, Cr, Zn, and Ni) and world average values (for Al and Cd) are adopted in the present study. The background concentrations adopted for different heavy metals are given in Table 3. CF was classified into six classes as given in Table 3.29
Table 3: Classification of Contamination Factor.
|
Level of contamination |
uncontaminated |
Slight |
Moderate |
Considerable |
Strong |
Very strong |
|
CF (Individual Metal) |
≤ 0 |
0 ≤ 1 |
1 ≤ 3 |
3 ≤ 5 |
5 ≤ 6 |
CF > 6 |
Enrichment Factor (EF)
EF is a very effective tool for elucidating potential pollution sources of heavy metals in agricultural soil samples. Equation 2 was used for finding out the EF values of heavy metals in the soil samples collected from NCR, Delhi.
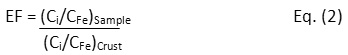
Where Ci = concentration of a specific heavy metal in the agricultural soil samples.
CFe = concentration of Fe in the agricultural soil samples and in the continental crust (Fe concentrations in the continental crust was taken as a reference element). The classification of EF is given in table 4.
Table 4: Classification of Enrichment Factor 30
|
EF Value |
Source of Heavy Metals |
|
0.5-1.5 |
crustal materials |
|
EF >1.5 |
anthropogenic processes |
Coefficient of Variation (CV)
The coefficient of variation is used to explain the degree of human intervention. CV is directly proportional to human intervention i.e. the higher the range of human activities, the higher the coefficient of variation will be. It has been classified in to three categories: low variation (CV < 0.15), medium variation (0.15 < CV < 0.36) and high variation (CV > 0.36), and is calculated as given in Eq. 3.30
CV= Standard Deviation/Mean Eq. (3)
Assessment of Soil Contamination
The contamination status of agricultural soils was assessed using the potential ecological risk index (PERI). The ecological risk assessment is a technique used to identify the environmental impacts of heavy metals in soil and is calculated using Eqs. 4 and 5. RI is the ecological risk index and is defined as the sum of the potential ecological risk index (Ei) of various metals present in the soil.30 Classification of PERI has been given in Table 5.
RI = ∑ Ei Eq. (4)
Ei = Ti (Ci / C0) Eq. (5)
Ei is the potential ecological risk index of an individual heavy metal present in the soil, Ti is the toxic response factor for heavy metals, (Ti value for different metals are as follow, Cd (30), Pb, Cu and Ni (5), Cr (2), and Zn (1)), Ci is the concentration of heavy metal i in the soils, C0 is the background concentration of heavy metals in Indian agricultural soils.
Table 5: Classification of the Potential Ecological Risk Index.
|
Risk (RI) |
Low |
Moderate |
Considerable |
High |
very high |
|
Ei |
<40 |
40 ≤ 80 |
80 ≤ 160 |
160 ≤ 320 |
≥320 |
|
RI |
≤ 150 |
150 < RI ≤ 300 |
300 < RI ≤ 600 |
-- |
> 600 |
Statistical Analysis
The Pearson’s correlation coefficient (r), principal component analysis, and hierarchical cluster analysis were studied using the SPSS (version 22.0) software.
Results
Physico-Chemical and Heavy Metals Analysis
The pH and organic carbon are important parameters of agricultural soils as they control the bio-availability of heavy metals in soils. In the present study, the pH of the agricultural soils was found to be slightly alkaline with an average value of 7.79±0.49. The average value of organic carbon (%) content in agricultural soil samples was 0.53±0.21 percent.
Average concentrations of heavy metal in the agricultural soil samples were found to be in the order of Fe > Al > Mn > Zn > Ni > Cr > Cu > Pb > Co > Cd. Average concentration and standard deviation of heavy metals in present study for Fe, Al, Mn, Zn, Ni, Cr, Cu, Pb, Co, and Cd were 14916.92 ± 5221.93 mg kg-1, 13538.87 ± 4307.73 mg kg-1, 277.16 ± 128.96 mg kg-1, 74.53 ± 42.88 mg kg-1, 35.34 ± 30.48 mg kg-1, 33.68 ± 21.47 mg kg-1, 22.94 ± 14.62 mg kg-1, 18.45 ± 17.62 mg kg-1, 1.88 ± 1.49 mg kg-1, and 0.92 ± 0.41 mg kg-1, respectively. Range of the metals concentrations in the collected soil samples was observed as 5631-27109.99 mg kg-1 for Al, 6640.09-32650.23 mg kg-1 for Fe, 16.45-221.88 mg kg-1 for Zn, 73.80-735.72 mg kg-1 for Mn, 9.65-127.21 mg kg-1 for Cr, 7.63-192.63 mg kg-1 for Ni, 5.12-70.43 mg kg-1 for Cu, 0.31-80.13 mg kg-1 for Pb, and 0.15-1.96 mg kg-1 for Cd, and ND-7.82 mg kg-1 for Co,. A detailed description of heavy metals concentration at different sampling sites has been shown in table 6. The results of the present study were compared with the background concentration of heavy metals (Fe, Pb, Cu, Mn, Co, Cr, Zn, and Ni) in the Indian soil and (Al and Cd) world’s average soil heavy metal concentrations.
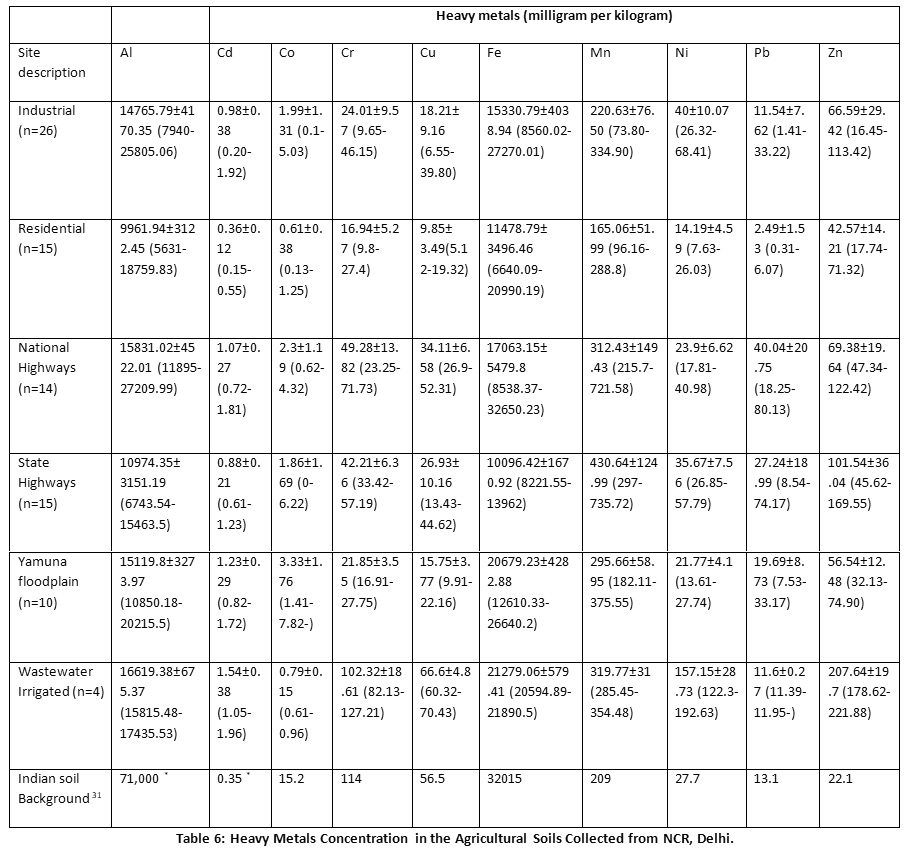 |
Table 6: Heavy Metals Concentration in the Agricultural Soils Collected from NCR, Delhi. Click here to view Table |
In represents the number of samples collected from respective sites, *World’s soil average concentration of Al and shale average concentration of Cd was taken as background values due to lack of relevant data for these heavy metals in Indian soils.32, 33
Discussion
The pH of the agricultural soil samples collected in the present study was found to be alkaline. Excessive use of organic fertilizers and continuous cultivation of crops may have probably increased the pH value of agricultural soils.34 Generally, heavy metals have shown high solubility at low pH, so the alkaline pH in the present study is supposed to reduce the solubility of heavy metals in the agricultural soil. The availability of a particular heavy metal is governed by many factors like Cd can become bio-available in alkaline soil in the presence of calcium and zinc, which desorb the metals from soil particles. 35 The values of pH reported here are in good agreement with others in the agricultural soil samples collected from Haryana and Uttar Pradesh states of India.36, 37
The average value of organic carbon (%) content in agricultural soil samples was 0.53±0.21 percent. This shows less application of crop residue, cow dung and decomposed animal waste in the fields.34 Poor soil organic carbon decreases the microbial diversity and biomass of soil by reducing nutrient mineralization. Soil organic matter forms complex with heavy metals and hence controls the availability of heavy metals to the plants.38 Low organic matter content in the agricultural soils may increase metals uptake by the crops. The value of organic matter content in the present study was in agreement with the percent level of organic matter in the agricultural soil of Nigeria.39
Iron
The concentrations of Fe in all agricultural soils were within the background limits of Indian agricultural soils except for one sample that was collected from the site S1 site. The concentration of iron in this agricultural soil sample was 32650.23 mg kg-1. The high concentration of iron in the soils may be due to the steel fabrication and machinery manufacturing industries situated near highways. The high concentration of Fe in the agricultural soils may be the result of the continuous use of inorganic fertilizers in agricultural fields.40 The application of compost and fertilizers also increases the Fe uptake by the growing crop. 41 The concentrations of Fe reported here are higher than the concentrations reported by Punetha and Tewari in the agricultural soils of Morabadad district, India.42 The Iron concentration in the soil samples collected from agricultural fields on the Yamuna floodplain area in Panipat was also in good agreement with the earlier study.43
Aluminium
The aluminium concentration in all the soil samples was below the world's average background concentration of the metal. The maximum concentration of aluminium was reported as 27209.99 mg kg-1 from the agricultural soil sample collected near the national highway (S1), which may be due to the presence of steel fabrication and machine manufacturing industries on highways.23 Aluminum phosphide is also a registered pesticide for agricultural use in India, which can be a potential source of aluminium in agricultural land.44
Manganese
Manganese concentration in all the agricultural soil samples was higher than the background concentration of Mn in Indian agricultural soils, except for the soil samples that were collected from the sites located near residential areas. Mn concentration was 2 times higher in the agricultural soils located near state highways. The high concentration of Mn in the soil sample collected near highways may be attributed to several industries located there, such as the steel industry, spring industry, non-woven bag-making machine industry, precast concrete structure, and machine parts.23 Combustion of fossil fuel also contributes Mn in the environment. Mn is a constituent of a fungicide (Mancozeb) and MnSO4 is used as a fertilizer in agriculture.45 The Mn concentrations reported here were higher than the concentrations observed in agricultural soils of Panipat and Varanasi.15, 46
Zinc
All the soil samples were having high concentrations of Zn, especially the wastewater irrigated agricultural soils had shown Zn concentration nine times higher than its background value. The drain water used for irrigation in the study areas is receiving city sewage and wastewater from different industries. The other reason for the high concentration of Zn in agricultural soils could be the application of Zn sulfate fertilizers.40 Zn concentrations reported here were higher than concentrations reported in previous studies.16, 47
Nickel
Ni concentrations in most of the agricultural soils were higher than its background concentration in Indian agricultural soil. This may be due to the application of inorganic fertilizer, sewage, and industrial wastewater in agricultural soils.48 The concentration of Ni was 23.9 mg kg-1 and 35.67 mg kg-1 in agricultural fields near national and state highways while 157.15 mg kg-1 in wastewater irrigated fields. Nickel concentration in soil samples reported here was more than the concentrations reported in India and the China.47, 49
Chromium
A high concentration of Cr (127.21 mg kg-1) was found in one soil sample collected from wastewater irrigated agricultural field S7. The high concentration of Cr in WWI soil may be due to the dumping of waste by printing and chemical industries in the drain. The mean concentration of Cr in the agricultural soils in the present study was higher than the concentration of Cr in agricultural soils of India and East China.30, 50
Copper
Most of the agricultural soil samples were having Cu concentrations within the background value of Indian agricultural soil except, for one site (S7) that was irrigated by wastewater. The presence of Cu in this area may be attributed to the use of Cu-containing fungicides (copper sulfate and copper oxychloride) and the irrigation by sewage.44, 51 The concentration of Cu reported in the present study was several times higher than the concentrations reported in agricultural soils of Jagdalpur, Chhattisgarh State, India and of Marrakech in Morocco.10, 52
Lead
Concentrations of lead in the soil samples collected from national highways and state highways were found to exceed the background concentration of Pb in Indian agricultural soils. The mean concentration of Pb was almost three times higher in agricultural soils of national highways and two times higher in agricultural soils of state highways than its background concentration value, which is pointing towards the anthropogenic input of this metal along with its natural sources. The other sources of Pb may be different types of industry located near the national highways like automobiles, paint, metallurgical, and battery manufacturing industries.53 Pb get volatilize under high temperature and can travel a long distance from the source to the sink point. Pb is also found in phosphate and superphosphate rocks and has a strong binding with organic matter, which reduces its mobility.54 The concentration of Pb in our study was higher than the concentration of Pb in agricultural soils in the Huainan City of China and Amritsar city of Punjab, India.55, 56
Cadmium
The average concentration of cadmium in the agricultural soils in the present study was above than the world's average value. Nearly 4.5 times higher concentration of Cd (1.54 mg kg-1) was found in the soil samples collected from wastewater irrigated site S7 compared to its’ world average value. The high concentration of Cd in the soils was due to irrigation by a drain that receives water from printing, chemical industries along with city sewage. It has been reported in a previous study that sewage irrigation is responsible for Cd input in Indian soils.57 Another potential source of Cd in agricultural soil may be the use of Cd- containing fertilizers in the fields.58 The Cd concentration reported in this study was higher than the concentration reported in agricultural soils of China.47 The results reported here also showed similarities with the results reported from peri-urban Delhi and Southwestern China.59, 60
Cobalt
The concentrations of Cobalt in all of the collected agricultural soil samples were below the background value of Co in Indian agricultural soils. The cobalt concentrations reported here are higher than the values reported in Varanasi.49
Heavy Metals Pollution Assessment
Contamination factor
The contamination factor for agricultural soil samples has been calculated and shown in Figure 3. All of the agricultural soil samples were found to be contaminated with the different types of heavy metals. The samples collected from industrial areas, state highways, and national highways were moderately to considerably contaminated with Cd, Pb, and Zn, respectively. A moderate to a considerable level of contamination with Cd was found in the soil samples collected from the Yamuna floodplain whereas, wastewater irrigated soil samples were found to be highly contaminated with Cd, Ni, and Zn. Agricultural soil samples near residential areas were also moderately contaminated with Zn due to the application of zinc fertilizers.
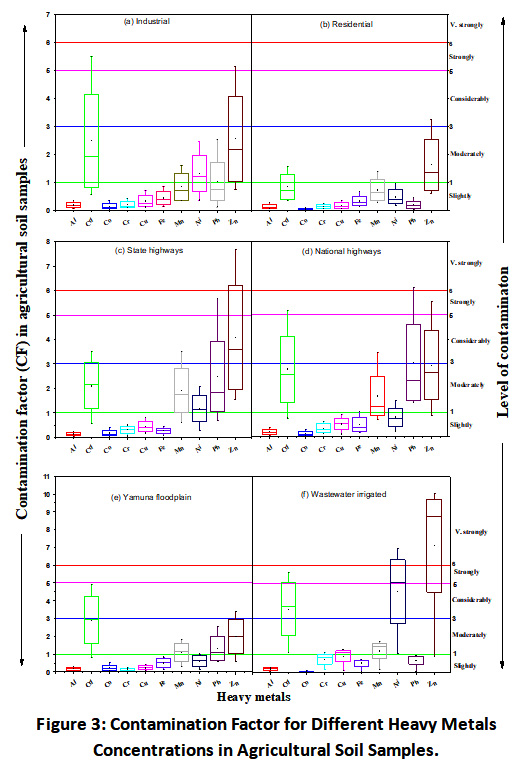 |
Figure 3: Contamination Factor for Different Heavy Metals Concentrations in Agricultural Soil Samples. Click here to view Figure |
Enrichment Factor
Statistics of enrichment factors (EF) in the agricultural soils are shown in Figure 4. The average EF values in the agricultural soil samples followed the decreasing order of Zn > Cd > Pb > Mn > Ni > with average values 7.94, 5.82, 3.27, 3.12, and 2.78, respectively. Thus the agricultural soils in the study area are having high enrichment with Zn and Cd, while moderate enrichment with Pb, Mn, and Ni. The high EF value for these metals indicates the anthropogenic input of these metals in agricultural soils. The agricultural soils of east China had also shown enrichment with Zn, Cd, and Pb.30
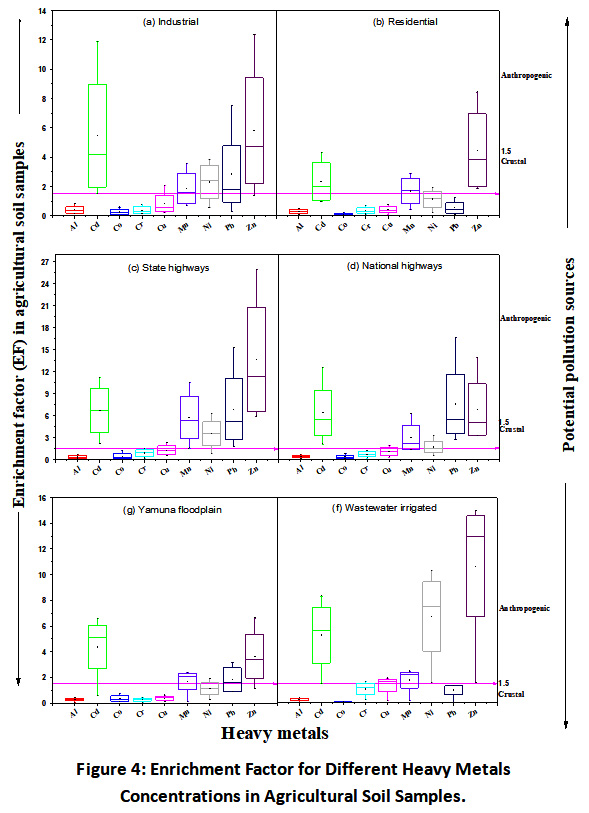 |
Figure 4: Enrichment Factor for Different Heavy Metals Concentrations in Agricultural Soil Samples. Click here to view Figure |
Coefficient of Variation (CV)
Coefficient of variation was found in the order of Pb > Ni > Co > Cu > Cr > Zn > Mn > Cd > Fe > Al with values 0.96 > 0.86 > 0.79 > 0.64 > 0.637 > 0.58 > 0.47 > 0.45 > 0.35 > 0.32. The high variation was seen for the heavy metals (Pb, Zn, Ni, Cr, Co, Mn, Cu, and Cd), pointing towards a significant contribution of anthropogenic sources in the study area for these metals. Medium variation was observed for Al and Fe, which indicates the minimum input of Al and Fe by anthropogenic sources. The CV for Pb, Ni, Cu and Cr obtained in our study was higher than the CV in agricultural soils of China.30
Potential Ecological Risk Index (PERI)
Amongst the studied metals, PERI was calculated for Cd, Pb, Cu, Ni, Cr, and Zn and the results are presented in Figures 5 & 6. The value of PERI was found to be highest for Cd in all the analyzed samples. Moderate to considerable potential ecological risk (Ei) has been observed in agricultural soil samples collected from national highways, state highways, Yamuna floodplains, and industrial areas, whereas WWI soil samples showed a considerable potential ecological risk (Ei) due to the presence of Cd. The level of ecological risk index (Ri) was high for 75% of the soil samples irrigated with wastewater due to the presence of Cd, Pb, Cu, Ni, Cr, and Zn. Chen et al., 2019 has observed the considerable ecological risk due to Cd in agricultural soils of East China that was similar to the current study.30
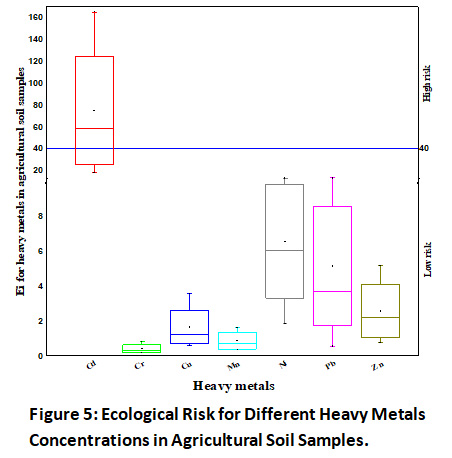 |
Figure 5: Ecological Risk for Different Heavy Metals Concentrations in Agricultural Soil Samples. Click here to view Figure |
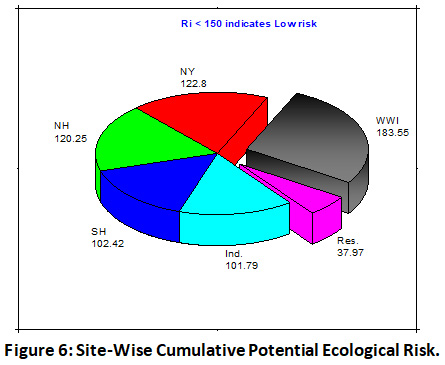 |
Figure 6: Site-Wise Cumulative Potential Ecological Risk. Click here to view Figure |
Correlation, Cluster and Factor Analysis
Pearson correlation analysis was performed between heavy metals, and a close association between heavy metals has been observed (Table 7). A strong positive correlation was observed between Cd, Fe, and Al, which indicates their common source of origin i.e. crustal. Ni showed a positive correlation with Cr, Zn, and Cu, suggesting that the potential source of these metals in agricultural soils is anthropogenic. Pb was significantly and positively correlated with Mn and Co, which intimate their vehicular source of origin. A comparison of principal components analysis (PCA), loading, and the cumulative percentage for varimax normalized matrix and factor scores for different agricultural sites are shown in Table 8. There were three components with an eigenvalue greater than 1 after varimax rotation, which indicates the presence of multiple sources of heavy metals in the NCR. PCA and dendrogram analysis suggested the formation of three primary cluster pairs are Ni-Cr-Zn-Cu, Fe-Al-Cd, and Pb-Mn-Co (Figure 7). In the Principal component analysis, factor 1 contributed to 34.71% of total variance with a high loading of Ni, Cr, Zn, and Cu which indicate their common source of origin i.e. industrial. Factor 2 contributed to 23.68% of total variance with the high loading Fe, Al, and Cd suggesting their agricultural and crustal source of origin. Factor 3 contributed to 22.49% of total variance with the high loading of Pb, Mn, and Co, suggesting a vehicular source of origin.
Table 7: Pearson’s Correlation Matrix.
|
|
Al |
Cd |
Co |
Cr |
Cu |
Fe |
Mn |
Ni |
Pb |
Zn |
|
Al |
1 |
|
|
|
|
|
|
|
|
|
|
Cd |
.631** |
1 |
|
|
|
|
|
|
|
|
|
Co |
.442** |
.521** |
1 |
|
|
|
|
|
|
|
|
Cr |
.433** |
.497** |
.050 |
1 |
|
|
|
|
|
|
|
Cu |
.433** |
.640** |
.244* |
.854** |
1 |
|
|
|
|
|
|
Fe |
.679** |
.641** |
.275* |
.328** |
.341** |
1 |
|
|
|
|
|
Mn |
.227* |
.457** |
.419** |
.451** |
.498** |
.160 |
1 |
|
|
|
|
Ni |
.321** |
.477** |
-.028 |
.764** |
.705** |
.331** |
.214 |
1 |
|
|
|
Pb |
.160 |
.403** |
.485** |
.305** |
.500** |
.102 |
.573** |
-.024 |
1 |
|
|
Zn |
.281** |
.558** |
.191 |
.747** |
.787** |
.151 |
.495** |
.770** |
.262* |
1 |
**. Correlation is significant at the 0.01 level.
Table 8: Principal Components Analysis (Varimax with Kaiser Normalization)
|
Heavy metals |
Factor 1 |
Factor 2 |
Factor 3 |
|
Al |
.210 |
.858 |
.130 |
|
Cd |
.420 |
.683 |
.400 |
|
Co |
-.131 |
.465 |
.707 |
|
Cr |
.890 |
.202 |
.153 |
|
Cu |
.830 |
.241 |
.366 |
|
Fe |
.154 |
.888 |
-.009 |
|
Mn |
.369 |
.045 |
.749 |
|
Ni |
.897 |
.231 |
-.156 |
|
Pb |
.139 |
.022 |
.875 |
|
Zn |
.877 |
.078 |
.251 |
|
Eigen Value |
3.471 |
2.368 |
2.249 |
|
%of Variance |
34.711 |
23.679 |
22.49 |
|
Cumulative% |
34.711 |
58.389 |
80.879 |
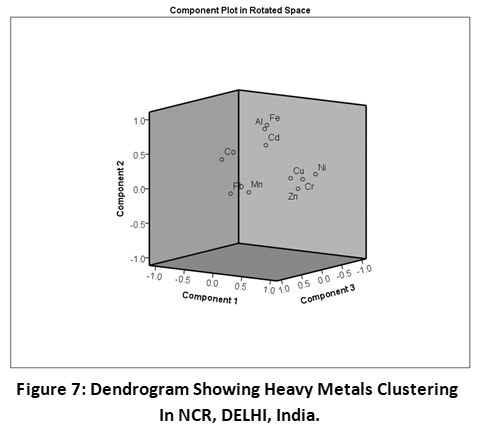 |
Figure 7: Dendrogram Showing Heavy Metals Clustering in NCR, DELHI, India. Click here to view Figure |
Funding Sources
The author(s) received no financial support for the research, authorship, and/or publication of this article.
Conflict of Interest
The authors declare they have no conflict of interest.
Acknowledgments
The author would like to thank Deenbandhu Chhotu Ram University of Science and Technology, Murthal, Sonepat for granting the Ph.D. research work.
Conclusion
The significant potential ecological risk has been noticed in nearly all the agricultural soil samples except for the samples collected nearby residential areas. Wastewater irrigated soils had shown the highest level of contamination due to the presence of heavy metals. All soil samples were enriched with heavy metals like Zn, Mn, Pb , Cd, and Ni with moderate to a strong level of contamination. The soil samples collected from the S7 site of the Sonepat district were strongly contaminated with Cd, Ni, and Zn. Thus we can say that the use of city’s drain water for irrigation has resulted in a high concentration of heavy metals (Zn, Cd, Ni, Cu, and Cr) in the soil samples, and cultivation of vegetables/cereals in such soils may result in the bioaccumulation of heavy metals in them. The Potential Ecological risk index was found to be considerable due to Cd. Based on EF, CV, and statistical analysis, it may be concluded that anthropogenic sources of heavy metals (metal industries, sewage water, the use of phosphate fertilizers, etc.) in the study area are contributing a significant amount of heavy metals in agricultural soils. From the results of this study, it can be concluded that a large-scale level monitoring plan is necessary to evaluate the levels of metal concentration in agricultural soils of NCR, DELHI. Government agencies should develop some strategies to reduce the input of heavy metals in the agricultural soils from anthropogenic sources. A further study of heavy metals in vegetables grown in this type of area is highly recommended.
References
- Gulati A., Juneja R. Indian agriculture towards 2030. Ministry of Agriculture & Farmers Welfare, Government of India. 2020.p.1-27.
- Progressive Haryana: The agricultural hub of India. PHD chamber of commerce and industry. New Delhi. 2019.p.1-72.
- Sandeep G., Vijayalatha K. R., Anitha T. Heavy metals and its impact in vegetable crops. Int J Chem Stud. 2019;7:1612-1621.
- Bhaskar B. V., Rajasekhar R. V. J., Muthusubramanian P., Kesarkar A. P. Ionic and heavy metal composition of respirable particulate in Madurai, India. Environ Monit Assess. 2010;164:323–336.
CrossRef - Sharma R. K., Agrawal M., Marshall F. M. Heavy metal (Cu, Zn, Cd and Pb) contamination of vegetables in urban India: A case study in Varanasi. Environ Pollut. 2008;154(2):254-263.
CrossRef - Bathla S., Jain T. Heavy Metals Toxicity. Int J Heal Sci Res. 2016;6:361–368.
- Manzoor J., Sharma M., Wani K. A. Heavy metals in vegetables and their impact on the nutrient quality of vegetables: A review. J Plant Nutr. 2018;41:1744–1763. Doi.org/10.1080/01904167.2018.1462382.
CrossRef - Baride M. V., Patil S. N., Yeole D., Golekar R. Evaluation of the heavy- metal contamination in surface / ground water from some parts of Jalgaon District , Maharashtra , India. Arch Appl Sci Res. 2012;4:2479–2487.
- Sekhar K. C., Chary N. S., Kamala C. T., Vairamani M., Anjaneyulu Y., Balaram V., Sorlie, J. E. Risk Communications: Around the world - Environmental risk assessment studies of heavy metal contamination in the industrial area of Kattedan, India - A case study. Hum Ecol Risk Assess. 2006;12:408–422.
CrossRef - Chaoua S., Boussaa S., Gharmali A. E., Boumezzough A. Impact of irrigation with wastewater on accumulation of heavy metals in soil and crops in the region of Marrakech in Morocco. J Saudi Soc Agric Sci. 2019;18(4):429-436.
CrossRef - Smith S. R. Effect of soil pH on availability to crops of metals in sewage sludge - treated soils. I. Nickel, Copper and Zinc uptake and toxicity to Ryegrass. Environ Pollut. 1994;85:321–327.
CrossRef - Odoemelam S. A., Ajunwa O. Heavy metal status and physicochemical properties of agricultural soil amended by short term applicaton of animal manure. Curr World Environ. 2008;3:21–26.
CrossRef - Imron M. F., Kurniawan S. B., Abdullah S. R. S. Resistance of bacteria isolated from leachate to heavy metals and the removal of Hg by Pseudomonas aeruginosa strain FZ-2 at different salinity levels in a batch biosorption system. Sustain Environ Res. 2021;31(14):1-13.
CrossRef - Dinakaran J., Abbas N. S., Arora S., Bhardwaj S., Kaula B. C. Assessment of heavy metals in ground water of different locations of National Capital Region, Delhi, India. Curr World Environ. 2021;16:143–150.
CrossRef - Bharti P. K., Kumar P., Singh V. Impact of industrial effluents on ground water and soil quality in the vicinity of industrial area of Panipat city, India. J Appl Nat Sci. 2013;5(1):132-136.
CrossRef - Chaudhary S., Banerjee D. K., Kumar N., Yadav S. Assessment of bioavailable metals in the sediments of Yamuna flood plain using two different single extraction procedures. Sustain Environ Res. 2016;26(1):28-32.
CrossRef - Sharma R. K., Agrawal M., Marshall F. Heavy metal contamination of soil and vegetables in suburban areas of Varanasi, India. Ecotoxicol Environ Saf. 2007;66(2):258-266.
CrossRef - Rieuwerts J. S., Thornton I., Farago M. E., Ashmore M. R. Factors influencing metal bioavailability in soils: Preliminary investigations for the development of a critical loads approach for metals. Chem Speciat Bioavailab. 1998;10(2):61-75.
CrossRef - Molla S. R., Huq S. M. I. Comparison of extractants for assessing Fe, Mn, Cu and Zn availability in soils. Kulana University Studies. 2002;2:823-825.
- Kaushik A., Emanuel N., Agarwal S. Determination of concentration of heavy metals and trace minerals in selected fruit and vegetables from Delhi NCR region. Int J Recent Sci Res. 2017;8:17494–17498.
- Achparaki M., Thessalonikeos E., Tsoukali H., Mastrogianni O., Zaggelidou E., Chatzinikolaou F., Vasilliades N., Raikos N. Heavy metals toxicity . Aristotle Univ Med J. 2012;39(1):29-34.
- Map of India. https://www.mapsofindia.com/maps/delhi/delhi-ncr-map.html. Accessed November 9, 2020.
- MSME. State Industrial Profile of Haryana. Ministry of micro, small and medium enterprises, Karnal, Government of India. 2015. P.1-63.
- https://images.app.goo.gl/VCdoJv6smBqrLF6x6accessed on 24 Jan 2020
- https://images.app.goo.gl/gPB25PQin2BApuoHAaccessed on 24 Jan 2020
- https://goo.gl/maps/Xhg2NVSrNxm2tbd17accessed on 24 Jan 2020
- Islam M. S., Ahmed M. K., Habibullah-Al-Mamun M. Apportionment of heavy metals in soil and vegetables and associated health risks assessment. Stoch Environ Res Risk Assess. 2016;30(1):365-377.
CrossRef - Global Soil Laboratory Network. Standard operating procedure for soil organic carbon Walkley-Black method. Vol.1;2019.
- Gabarrón M., Faz A., Martínez-Martínez S., Zornoza R., Acosta J. A. Assessment of metals behaviour in industrial soil using sequential extraction, multivariable analysis and a geostatistical approach. J Geochem Expl. 2017;172:174-183.
CrossRef - Chen L., Wang G., Wu S., Xia Z., Cui Z., Wang C., Zhou S. Heavy metals in agricultural soils of the Lihe River watershed, East China: spatial distribution, ecological risk, and pollution source. Int J Environ Res Public Health. 2019 Jun 13;16(12):2094.
CrossRef - Kumar V., Sharma A., Kaur P., Sidhu G. P. S., Bali A. S., Bhardwaj R., Thukral A. K., Cerda A. Pollution assessment of heavy metals in soils of India and ecological risk assessment: A state-of-the-art. Chemosphere. 2019;216:449-462. DOI:10.1016/j.chemosphere.2018.10.066.
CrossRef - Giri S., Singh A. K. Ecological and human health risk assessment of agricultural soils based on heavy metals in mining areas of Singhbhum copper belt, India. Hum Ecol Risk Assess. 2017;23(5):1008-1027.
CrossRef - US Environmental Protection Agency. US EPA ecological soil screening level for Aluminium.; 2014. p. 1-1.
- Shamim A. H. M., Moniruzzaman M., Siddiquy M., Shaibur M. R. Status of some nutrients at Tejgaon soil series in 2001 and in 2018?: A study from Bangladesh. Environ Biol Res. 2019;1:44–53.
- Khaledian Y., Pereira P., Brevik E. C., Pundyte N., Paliulis D. The influence of organic carbon and pH on heavy metals, potassium, and magnesium levels in Lithuanian Podzols. L Degrad Dev. 2016;28(1):345-354.
CrossRef - Daulta R., Rani J., Yadav A. Effect of sugar mill effluent on physico-chemical properties of soil at Panipat City, India. Int Arch Appl Sci Technol. 2014;5(2):6-12.
- Pandey R. K., Dwivedi A. Accumulation of heavy metal in agricultural field irrigated with sewage water in industrial and municipal area. Curr World Environ. 2009;4:405–408.
CrossRef - Li G., Lu N., Wei Y., Zhu D. Relationship between heavy metal content in polluted soil and soil organic matter and pH in mining areas. IOP Conf Ser Mater Sci Eng. 2018;394(5):1-7.
CrossRef - Ojo F. O., Wokhe T. B., Chima M. P. Assessment of heavy metal pollution in soils from farms in the vicinity of Durumi quarry site in Mpape, Abuja Nigeria. Curr World Environ. 2018;13:360–373.
CrossRef - Garg V. K., Yadav P., Mor S., Singh B., Pulhani V. Heavy metals bioconcentration from soil to vegetables and assessment of health risk caused by their ingestion. Biol Trace Elem Res. 2014;157(3):256-265.
CrossRef - Molla S. R., Huq S. M. I. Availability of some heavy metals in soil due to compost application and its correlation with the growth of Amaranthus Gangeticus L. J Asiat Soc Banglaesh, Sci. 2004;30:47–56.
- Punetha D., Tewari G., Pande C., Kharkwal G. C., Tewari K. Investigation on heavy metal content in common grown vegetables from polluted sites of Moradabad district, India. J Indian Chem Soc 2015;92(1):97-103.
- Kaushik A., Kansal A., Santosh, Meena, Kumari S., Kaushik C. P. Heavy metal contamination of river Yamuna, Haryana, India: Assessment by Metal Enrichment Factor of the Sediments. J Hazard Mater. 2009;164(1):265-270.
CrossRef - Bhushan C., Bhardwaj A., Misra S. S. State of Pesticide Regulations in India. Centre for Science and Environment, New Delhi. 2013. p.1-72.
- Howe P. D., Malcolm H. M., Dobson S. Manganese and Its Compounds: Environmental Aspects. World Health Organization. Geneva. 2004. P. 1-63.
- Singh S., Raju N. J., Nazneen S. Environmental risk of heavy metal pollution and contamination sources using multivariate analysis in the soils of Varanasi environs, India. Environ Monit Assess. 2015;187(6):1-12.
CrossRef - Tian K., Huang B., Xing Z., Hu W. Geochemical baseline establishment and ecological risk evaluation of heavy metals in greenhouse soils from Dongtai, China. Ecol Indic. 2017;72:510-520. DOI:10.1016/j.ecolind.2016.08.037.
CrossRef - Iyaka Y. A. Nickel in soils: A review of its distribution and impacts. Sci Res Essays. 2011;6(33):6774-6777.
CrossRef - Verma P., Agrawal M., Sagar R. Assessment of potential health risks due to heavy metals through vegetable consumption in a tropical area irrigated by treated wastewater. Environ Syst Decis. 2015;35(3):375-388.
CrossRef - Bhagure G. R., Mirgane S. R. Heavy metal concentrations in groundwaters and soils of Thane Region of Maharashtra, India. Environ Monit Assess. 2011;173:643-652. DOI:10.1007/s10661-010-1412-9.
CrossRef - Antil R. S. Impact of sewage and industrial effluents on soil-plant health. In:Show, K. Y. and Xinxin, G. Industrial Waste. Croatia: IntechOpen;2012: 53-72. DOI:978-953-51-0253-3.
- Rao P. S., Thomas T., Hasan A., David A. Determination of heavy metals contamination in soil and vegetable samples from Jagdalpur, Chhattisgarh state, India. Int J Curr Microbiol App Sci. 2017;6(8):2909-2914.
CrossRef - Debnath B., Singh W. S., Manna K. Sources and toxicological effects of lead on human health. Indian J Med Spec. 2019;10:66-71.
CrossRef - Wuana R. A., Okieimen F. E. Heavy Metals in Contaminated Soils: A review of sources, chemistry, risks and best available strategies for remediation. ISRN Ecol. 2011;402647:1-20. DOI: 10.5402/2011/402647.
CrossRef - Niu S., Gao L., Wang X. Characterization of contamination levels of heavy metals in agricultural soils using geochemical baseline concentrations. J Soils Sediments. 2019;19:1697-1707. DOI: 10.1007/s11368-018-2190-1.
CrossRef - Vanita C., Piar C., Avinash N., Kaur K. J., Pakade Y. B. Evaluation of heavy metals contamination and its genotoxicity in agricultural soil of Amritsar, Punjab, India. Int J Res Chem Environment. 2014;4(4):20-28.
- Murti C. R. K. The Cycling of Arsenic , Cadmium , Lead and Mercury in India. In: Thomas C. Hutchinson KMM, ed. Lead, Mercury, Cadmium and Arsenic in the Environment. Wiley–Blackwell; 1987.p.315-333.
- Roberts T. L. Cadmium and phosphorous fertilizers: The issues and the science. Procedia Eng. 2014;83:52-59. DOI: 10.1016/j.proeng.2014.09.012.
CrossRef - Singh S., Kumar M. Heavy metal load of soil, water and vegetables in peri-urban Delhi. Environ Monit Assess. 2006;120:79-91. DOI: 10.1007/s10661-005-9050-3.
CrossRef - Zhang H., Huang B., Dong L., Hu W., Akhtar M. S., Qu M. Accumulation, sources and health risks of trace metals in elevated geochemical background soils used for greenhouse vegetable production in southwestern China. Ecotoxicol Environ Saf. 2017;137:233-239. DOI: 10.1016/j.ecoenv.2016.12.010.
CrossRef


