Impact of River Dams on Littoral Cells Located Adjacent to the River Mouth
Kamal Nag
*

http://dx.doi.org/10.12944/CWE.16.3.24
Copy the following to cite this article:
Nag K. Impact of River Dams on Littoral Cells Located Adjacent to the River Mouth. Curr World Environ 2021;16(3). DOI:http://dx.doi.org/10.12944/CWE.16.3.24
Copy the following to cite this URL:
Nag K. Impact of River Dams on Littoral Cells Located Adjacent to the River Mouth. Curr World Environ 2021;16(3). Available From:
Download article (pdf)
Citation Manager
Publish History

Introduction
Constructions of dams, reservoirs, water diversion projects etc. arrest sediment flux and decrease its supply to the coast1-3. Large rivers all over the globe are affected by dams. According to the International Commission on Large Dams (ICOLD), 45000 large dams all over the globe are obstructing the natural flow of rivers. Dam changes discharge volume of water and sediment and affects the entire river system. Sediments are arrested behind the dam and the coast receives reduced influx. Such reduction alters the coastal sediment budget. Impacts of reduced sediment influx may be visible near the estuary and littoral sediment cells adjacent to the river mouth. Coastal erosion, shifting of the river mouth and marine bar are geomorphological manifestations of reduced sediment influx.
Suspended sediment influx by rivers is a major source of sediment to the coasts4. Terrestrial sediment is carried away by the river and deposition takes place wherever carrying capacity of river falls below threshold limit5,6. Low-lying alluvial plains, estuaries and coastal zones are the major reservoirs of terrestrial sediment. Theprocess of sedimentation in the river mouth and coastal zone brings morphological changes7. Warrick et al. (2019)9 have studied the process through which terrestrial sediment brings changes to the coast. According to them, sedimentation begins in “intertidal and subtidal deltaic lobes''. In due course of time river mouth bars are formed by wave action and these bars gradually get attached to the mainland. Large deltas all around the world have been formed by sediment discharge and deposition by large rivers and all deltas are sensitive to fluctuation in sediment flux10.
Rozengurt et al. (1993)11 have studied the impact of a barrage in the Nile delta and concluded that the prograding phase of the Nile delta was replaced by retrograding with the construction of barrage. Aswan dam across the Nile reduces sediment influx further and these two events result in erosion of delta coastline up to 125-175 m/yr. Stanley (1996)12 has measured the impact of Aswan and other dams across the Nile on the coast. He pointed out that reduction in sediment discharge depends upon the design, purpose and operation of the dam. Another example of the effects of dams on coastal geomorphology may be cited from the study on the Pearl river in China by Dai et al. (2008)13. Sediment discharge from this river has decreased significantly since the mid-1980s with the construction of large dams and consequent deposition of sediment behind those dams.
With the growing need for freshwater, the numbers of dams are likely to increase in future dates. The natural flow of rivers continues to be obstructed more with an increasing number of dams14. The sediment supply from the river to the sea will decrease further. The scientific community should pay more attention to measuring the environmental impacts of such a decrease in sediment supply and suggest management techniques14. The present research examines how the increase in the number of dams across an east-flowing Indian river (Subarnarekha) impacts sediment influx and consequent changes along the coast. A number of studies have already linked up the relationship between dam construction and a decrease in sediment influx to the coast due to sediment arrest behind the dams 15-18. Misra (2017) has prepared a stochastic model of flow and sediment of the rivers at delta head19. Lowering of sediment influx to the coast and consequent acceleration in erosion has also been studied in scientific investigation20-22. For example, Jana et al (2016) have calculated the rate of coastal erosion on the North-Eastern coastal tract of the Indian peninsula based on Landsat images in the Digital Shoreline Analysis System (DSAS) platform23.
However, the available literature regarding the impact of river dams on coastal geomorphology is limited to calculating the rate of shoreline shifting and identifying erosion-affected zones. There is little research that emphasises areal gain and loss in relation to the continuous decrease in sediment influx. The present study has also taken littoral sediment cells as a natural geomorphological unit while analysing the impact of an increasing number of dams on the coastal environment. Using littoral cells as a unit of the study may provide us significant insight into the differential behaviour of adjacently located cells under identical changes. Again, the periodic breakup of total investigation time in the present study is likely to contribute significantly to understanding the lag time between commissioning a dam and its impact to be visible on the coast. In the present study, changes in suspended sediment influx were studied first and such changes were correlated with coastal erosion and accretion.
Study Area
Subarnarekha river originated in the Indian state of Jharkhand and flows through West Bengal and Odisha before debouching into the Bay of Bengal. The geographical extension of the basin ranges from 85° 8' to 87° 32' E and 21° 15' to 23° 34' N. The river basin of Subarnarekha has a total area of 29,196 km2. The basin receives a Mean Annual Rainfall of 1458 mm and most of the rainfall takes place during the South-West monsoon. A total of 38 dams including 16 large dams and water diversion barrages (Fig. 1a) has been commissioned so far. The numbers of dams and barrages have increased since 1974 and sediments continue to arrest behind the dams24. The river enters the Bay of Bengal through the northern coastal zone of the Indian state of Odisha. According to Mohanty et al (2008), this coastal tract is highly vulnerable to tropical cyclone25. Areal loss and gain along the shoreline adjacent to the mouth of this river in response to the decreasing amount of sediment influx have been observed for a time span of 38 years. The observed length of the coast is extended from the left bank of Bardaia river mouth (87° 12' 20.02''E and 21° 32' 45.17"N) in the south to Udaypur (87° 31' 48.57''E and 21° 37' 27.42"N) in the north for a length of about 36 km. Coastal stretches on either side of the river mouth have been assumed to be in two different littoral cells. Such an assumption was based on the idea of “fixed absolute boundaries of a cell” as proposed by Malcolm et al. (1995)26. Littoral sediment cells located adjacent to the river mouth have been named LCLS (Littoral Cell to the Left of Subarnarekha) and LCRS (Littoral Cell to the Right of Subarnarekha)
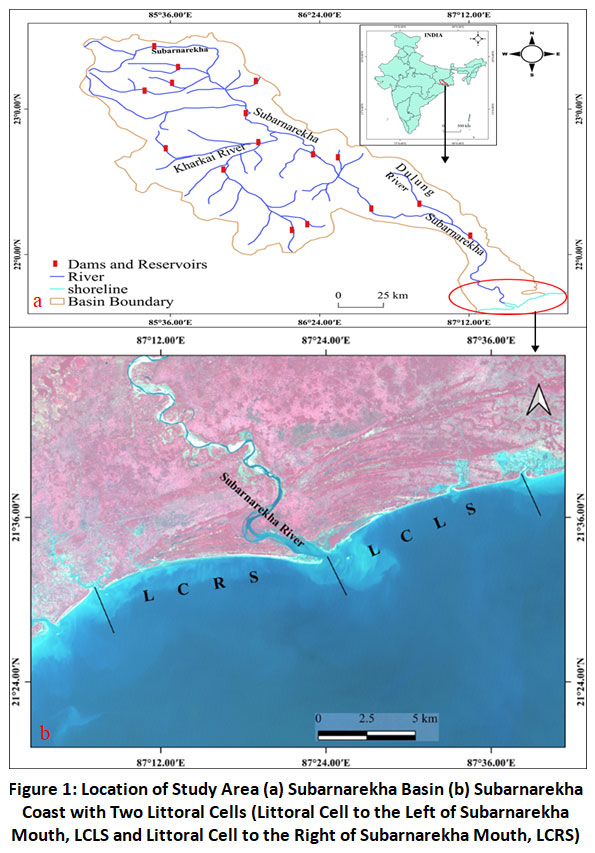 |
Figure 1: Location of Study Area (a) Subarnarekha Basin (b) Subarnarekha Coast with Two Littoral Cells (Littoral Cell to the Left of Subarnarekha Mouth, LCLS and Littoral Cell to the Right of Subarnarekha Mouth, LCRS) Click here to view Figure |
Materials and Methods
Time series data on annual sediment load has been collected from the “Water Year Book” published by Hydrological Observation Circle, Bhubaneswar (Ministry of Water Resource, River Development & Ganga Rejuvenation, Govt. of India). Information on the number of dams in river basins and the year of completion has been collected and compiled from “National Register of Large Dams-2019”, published by Dam Safety Monitoring Directorate, Central Water Commission, Govt. of India. An increase in the number of dams and a decrease in sediment influx have been examined for a period of time from 1978 to 2016.
Shifting of shorelines adjacent to the river has been detected through Landsat images for the said period of time (Table 1). Landsat images have been collected from the USGS (United States Geological Survey) website (https://glovis.usgs.gov). The selected set of images have been acquired under similar rising tidal situations and image scenes were processed with the Standard Terrain Correction (Level 1). Almost the same acquisition time of the day and similar tidal condition was basic criteria while selecting image scenes. Tidal conditions during an image scene acquisition were accounted for with the help of daily tide chart archives of the INCOIS (Indian National Centre for Ocean Information Service), an autonomous body of Govt. of India. Landsat level-1 products are precision registered and orthorectiï¬ed. It includes ground control points and a digital elevation model27. These products are useful for coastal mapping28.
Table 1: Specifications of Landsat Images.
|
Satellite |
SENSOR |
Grid Cell Size Reflective (Meter) |
PATH/ROW |
Date of acquisition |
Time (GMT+5:30) |
Scene Identifier |
|
LANDSAT-3 |
MSS |
60 |
149/045 |
17-12-1978 |
03:56:38 |
LM31490451978153AAA03 |
|
LANDSAT-5 |
TM |
30 |
139/045 |
23-12-1990 |
03:56:57 |
LT51390451990357ISP00 |
|
LANDSAT-7 |
ETM+ |
30 |
139/045 |
10-12-2000 |
04:27:42 |
LE71390452000345SGS00 |
|
LANDSAT-7 |
ETM+ |
30 |
139/045 |
19-12-2009 |
04:28:25 |
LE71390452009353SGS01 |
|
LANDSAT-8 |
OLI_TIRS |
30 |
139/045 |
14-12-2016 |
04:37:35 |
LC81390452016349LGN01 |
For the purpose of study, the entire time duration has been subdivided into four segments (From 1978 to 1990, 1990 to 2000, 2000 to 2009 and 2009 to 2016). Such unequal sub-division of observation duration was due to availability of good quality Landsat images in those years. The year 1978 has been taken as the base year and subsequent changes in sediment load has been calculated based on average annual sediment load during a time period. As 1978 was taken as a base year, “zero” change was assigned to it. After calculating the amount of changes from one time period to another, total change was obtained by adding up all periodic changes. To make the amount of changes unit free, all amounts were converted into percentage values and the cumulative changes were determined by adding up percentage values of change from one time point to next.
Changes in sediment flux due to dam construction across the river over a period of time have been measured carefully in a way as mentioned in Table 2. “x” was taken as the average annual sediment load for a time period. To identify the change, “x1”was taken as a base year. Changes in average sediment load could be negative or positive or zero. Summation of changes would always be a positive number as modulus function (│x│) has been used to calculate the total changes (│xd0, xd1…xd4│). As a result, the percentage of total change may or may not be hundred. Similarly, while calculating cumulative changes it could be hundred percent or less than hundred depending on pattern of changes.
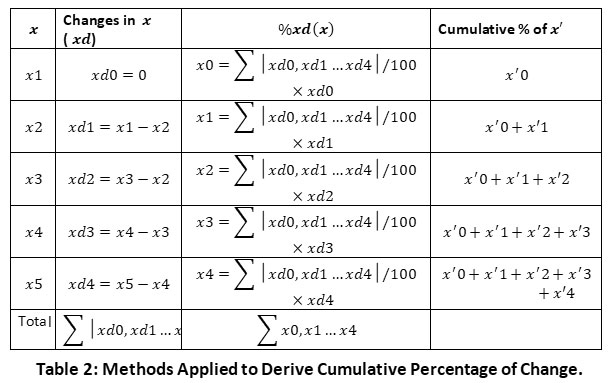 |
Table 2: Methods Applied to Derive Cumulative Percentage of Change. Click here to view Table |
QGIS 3.14 “Pi '' has been used to process Landsat data to derive shoreline and quantifying changes. Individual Landsat bands were stacked together by using the “Virtual Raster” function in QGIS 3.14 “Pi” to develop multispectral images. Interpretability of multispectral images have been enhanced by using “band rendering” and “contrast enhancement” and “colour rendering” tools in QGIS (Fig 2a). Normalised Differences Water Index (NDWI) function29has been applied to Landsat images to differentiate between land and water in satellite images.
NDWI=(Green – NIR)(Green + NIR)
Equation for NDWI was written in “Field calculator” of QGIS and the multispectral images were transformed into NDWI (Fig. 2b). Band-1 and band-3 of Landsat-4 MSS (Multispectral Scanner) have been used as green and NIR respectively to generate NDWI images. For the Thematic Mapper (TM) and Enhanced Thematic Mapper Plus (ETM+) of Landsat 5, band-2 and band-4 have used for the same purpose. Selection of those bands (to be used as green and NIR) was based on the wavelength of the bands. Information on band wavelength has been derived from the USGS website (https://glovis.usgs.gov).
Image thresholding by raster calculator was performed to make land and water boundaries more clearly identifiable (Fig. 2c). Pixel values less than zero (< 0) are assigned zero and rest of the pixels are assigned one (zero for land and one for water). Output images after thresholding were transformed into vector format through “polygonise (Raster to Vector)” tool in QGIS (Fig. 2d). Polygon features were then converted into line and except shorelines all others features were eliminated (Fig. 2e). After extracting the shorelines, “merge” tool in QGIS was used to unite shorelines of two different dates (Fig. 2f). Ends of shorelines were closed by adding line features and again converted into polygon by “polygonise” tool to calculate areal loss or gain along the shoreline (Fig. 2g).
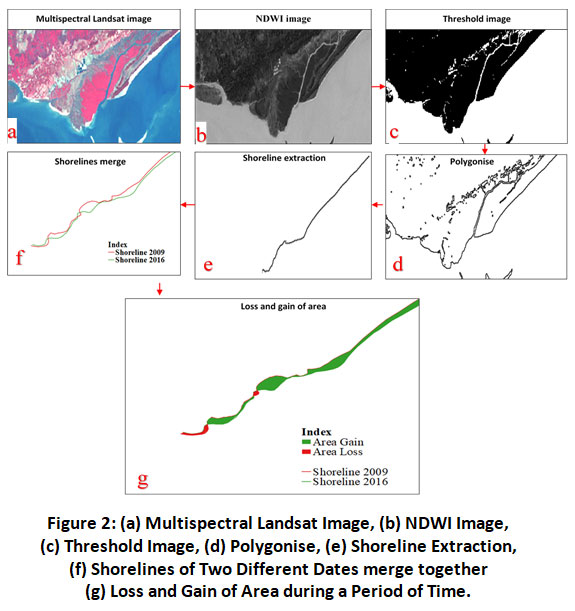 |
Figure 2: (a) Multispectral Landsat Image, (b) NDWI Image, (c) Threshold Image, (d) Polygonise, (e) Shoreline Extraction, (f) Shorelines of Two Different Dates merge together (g) Loss and Gain of Area during a Period of Time. Click here to view Figure |
Based on such differentiation, shorelines of different dates have been detected and extracted from the image as line vectors. Shorelines of different dates were superimposed to calculate loss and gain of land due to erosion and accretion along the shoreline during a specific time segment. The geometric function in the Field Calculator of QGIS has been used to calculate areal loss and gain. All maps were prepared in Layout of QGIS and line graphs in MS Excel professional 2013.
Results
It is evident that the decrease in sediment influx was in tune with the increasing number of dams. During the entire time period from 1978 to 2016, suspended sediment load has decreased. Although there was no new dam recorded between 1990 and 2000, sediment discharge has been reduced by 7.86 percent. Such reduction may be viewed as an after-effect of dams which were constructed before 1990 (Table 3). Again, with the increase of the number of dams from 2000, suspended sediment load started to decrease (Fig. 3.).
Table 3: Dams and Sediment Discharge in Subarnarekha Basin.
|
Year |
Cumulative Time Period |
No. of Dam |
% of growth |
Cumulative % of Growth |
Avg. Annual Load (M.T) |
% of Changes in Avg. Annual Load |
Cumulative % of Changes in Avg. Annual Load |
|
1978 |
0 |
0 |
0.00 |
0.00 |
7486769 |
0.00 |
0.00 |
|
1990 |
12 |
21 |
87.5 |
87.50 |
3911678 |
-55.61 |
-55.61 |
|
2000 |
22 |
0 |
0.00 |
87.50 |
3406113 |
-7.86 |
-63.47 |
|
2009 |
31 |
2 |
8.33 |
95.83 |
2803126 |
-9.38 |
-72.85 |
|
2016 |
38 |
1 |
4.17 |
100.00 |
1057624 |
-27.15 |
-100.00 |
 |
Figure 3: Impact of River Dam on Sediment Load. Click here to view Figure |
A cumulative analysis of littoral cells on either side of Subarnarekha mouth was performed to relate coastal changes with decreasing sediment influx to the shore. It was observed that LCLS lost area and shoreline moved back towards land on account of net cumulative erosion over an area of 0.97 km2 whereas LCRS accumulated sediment and shoreline advanced towards sea on account of net cumulative accretion over an area of 3.97 km2. LCLS was dominated by erosional activities from 1990 to 2009 (Fig. 4b). A reverse trend has been noted since 2009 (Fig. 4c). Although loss of area was not regained completely between 2009 and 2016 (Fig 4d). On the other hand, a significant loss of area (1.55 km2) in LCRS has been noted from 1978 to 1990 (Fig 4a). Such an erosional trend had been replaced with accretion in from 1990 to 2000 when net area increased maximum (5.18 km2). Such a change in LCRS was contrary to the direction of change in LCLS during the same time. Net loss of area in LCRS from 1978 to 1990 and 2000 to 2009 was adjusted by deposition during the rest of the time. By the end of 2016 this cell gained an area of 3.97 km2 with respect to base year (Table 4).
Table 4: Cumulative Net Area Change in LCLS and LCRS between 1978 and 2016.
|
Date |
Time period (Years) |
Cumulative time period (Years) |
LCLS |
LCRS |
||
|
Net areal changes (km2) |
Cumulative net areal changes (km2) |
Net areal changes (km2) |
Cumulative net areal changes (km2) |
|||
|
1978 |
0 |
0 |
0.0000 |
0.0000 |
0.0000 |
0.0000 |
|
1990 |
12 |
12 |
0.2077 |
0.2077 |
-1.5481 |
-1.5481 |
|
2000 |
10 |
22 |
-1.0957 |
-0.8881 |
5.1801 |
3.6320 |
|
2009 |
9 |
31 |
-1.0247 |
-1.9128 |
-1.9532 |
1.6788 |
|
2016 |
7 |
38 |
0.9403 |
-0.9725 |
2.2909 |
3.9696 |
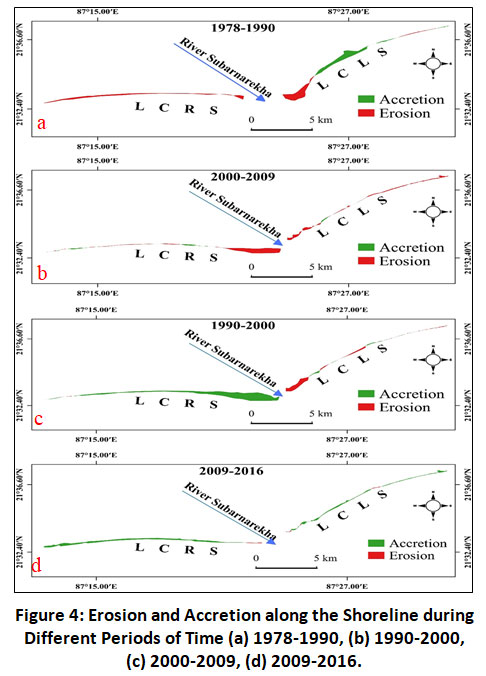 |
Figure 4: Erosion and Accretion along the Shoreline during Different Periods of Time (a) 1978-1990, (b) 1990-2000, (c) 2000-2009, (d) 2009-2016. Click here to view Figure |
Absolute values of areal changes along the shoreline have been converted into unit free value i.e., percentage (Table 5) to detect coastal response to decreasing influx. It has been observed that response of LCLS is more in tune with decreasing sediment load (Fig. 5). From 1978 to 2016 sediment load decreased continuously while loss of area in LCLS was detected only between 1990 and 2009. However, in LCRS net area was added between 1978 and 2016 (net cumulative 36 percent of total Change due to more accretion than erosion). Thus, changes in sediment load in Subarnarekha remain unrelated to the changes in this cell for the entire time duration (from 1978 to 2016). Although, periodic break up indicates that loss of area in LCRS surpasses area gain by accretion between 1978 and 1990 and between 2000 and 2009.
Table 5: Net Changes in Area Along the Shoreline in Response to Decreasing Sediment Influx.
|
Year |
Cumulative Time Period |
Net Changes in Area along the shoreline due to erosion or accretion |
|||
|
LCLS |
LCRS |
||||
|
% of Net change |
Cumulative % of net Change |
% of net Change |
Cumulative % of net Change |
||
|
1978 |
0 |
0 |
0 |
0 |
0 |
|
1990 |
12 |
6.35 |
6.35 |
-14.11 |
-14.11 |
|
2000 |
22 |
-33.52 |
-27.17 |
47.21 |
33.1 |
|
2009 |
31 |
-31.35 |
-58.52 |
-17.8 |
15.3 |
|
2016 |
38 |
28.77 |
-29.75 |
20.88 |
36.18 |
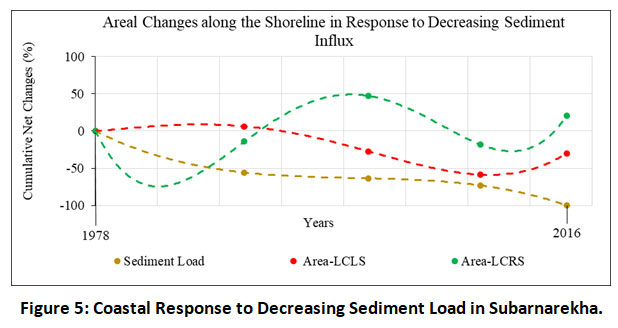 |
Figure 5: Coastal Response to Decreasing Sediment Load in Subarnarekha. Click here to view Figure |
Discussion
Differential response of littoral cells in terms of areal changes may be attributed to seasonal reversal of longshore current (Fig. 6). Coastal current in the western margin of Bay of Bengal (BoB) become northerly under the South-West Monsoon (S-E Monsoon) regime and southerly under North-East Monsoon (N-E Monsoon) regime 30-31. River Subarnarekha being a rain-fed river, brings maximum sediment to the coast during summer monsoon (June to August) which is a rainy season in India. River sediment carried away by northerly coastal current and influences the sediment budget of LCLS. On the other hand, southerly coastal currents (During the months of November to January which are cold and dry) have much less amount of sediment to carry and influence the sediment budget of LCRS. Thus, geomorphic evolution of this cell may be assumed as independent of sediment influx from river mouth.
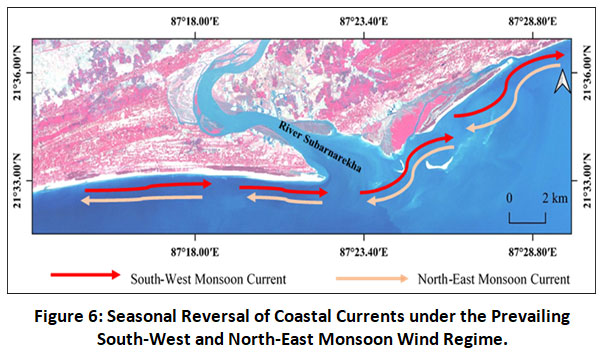 |
Figure 6: Seasonal Reversal of Coastal Currents under the Prevailing South-West and North-East Monsoon Wind Regime. Click here to view Figure |
In addition to longshore coastal currents, perpendicular components of coastal currents such as rip currents may be responsible for differential behaviour of adjacently located littoral cells. Variations in wave height and wave breaking along the shore due to undulation of shore-zone topography may give rise to rip currents. Such currents directed towards open sea and carried away suspended sediment deep into the sea32-34. Predominance of such current may neutralise effects of suspended sediment influx on coast.
Scientific research should pay attention to these aspects of coastal currents as further steps towards assessing impact of dams on the coastal morphology through reduction in sediment influx to the coast.
Investigations into the impacts of dams on coastal environments primarily had a geomorphological focus. This study attempted to address the indirect effects of dam on shoreline shifting and consequent areal changes along the littoral cells adjacent to river mouth. There have been relatively few studies that have addressed the causal relationship between dams and areal changes in littoral cells in response to damming.
The present study found that the coastal response to decreasing sediment influx is not uniform. Different parts of the coast respond at varying degrees. The study reveals that reduction in sediment influx does not necessarily lead to coastal erosion. Shoreline shifting and consequent area loss and gain depend upon a number of factors like sea-level changes, river mouth shifting, longshore drift and construction of port and harbours, etc.35-36. Reduction in suspended sediment influx could be an important factor in controlling shoreline changes and consequent area loss and gain in a littoral cell but it cannot be taken as the single most important factor. However, as the present study relies upon Landsat images which provide very coarse resolution (30 m), it is difficult to capture any sub-meter level changes along the coast. With the availability of sub-meter level data with more temporal frequency may reveal more minute changes.
There is a pressing need to measure not only areal changes in littoral cells but also other factors which control the morphological evolution of the coast. The role of Regional Sea Level Rise (RSLR) in altering or moderating coastal morphodynamic processes is also very poorly understood and needs to be studied in connection with decreasing sediment influx. A number of observations need to be increased to provide new insight into how coastal processes respond to upstream dam construction.
Acknowledgements
The author acknowledges European Space Agency (ESA) and Nippon Foundation, Japan for Sentinel and GEBCO_2020 data respectively.
Funding Source
There is no funding for this research work.
Conflict of Interest
The authors declare that they have no conflict of interest.
References
- Rao, K.N., P. Subraelu, K.C.V.N. Kumar, G. Demudu, B.H. Malini, A.S. Rajawat, and Ajai. 2010. Impacts of sediment retention by dams on delta shoreline recession: evidences from the Krishna and Godavari deltas, India. Earth Surface Processes and Landforms, 35(7):817-827. https://doi.org/10.1002/esp.1977.
CrossRef - Cantalice, J.R.B., W.L. da S. Souza, Y.J.A. Bezerra Silva, S.M.S. Guerra, A.M. Araújo, D.M. Cavalcante, and C.M.C.A.C. Silva. 2015. Bedload and Suspended Sediment of a Watershed Impacted by Dams. In: Hrissanthou V (ed) Effects of Sediment Transport on Hydraulic Structures, 1st edn. IntechOpen, Rijeka, pp 20-36.
CrossRef - Poeppl, R.E., K.A. Fryirs, J. Tunnicliffe, and G.J. Brierley. 2020. Managing sediment (dis)connectivity in fluvial systems. Science of The Total Environment, 139627. doi:10.1016/j.scitotenv.2020.139627.
CrossRef - Jiongxin, X. 2002. Sediment flux into the sea as influenced by different source areas in the drainage basin: example of the Yellow River, China. Hydrological Sciences Journal, 47(2):187–202.
CrossRef - Williams, M. 2012. River sediments. Philosophical Transactions of the Royal Society A: Mathematical. Physical and Engineering Sciences, 370(1966):2093– 2122. doi:10.1098/rsta.2011.0504
CrossRef - Fagherazzi, S., D.A. Edmonds, W. Nardin, N. Leonardi, A. Canestrelli, F. Falcini, and R.L Slingerland. 2015. Dynamics of river mouth deposits. Reviews of Geophysics, 53(3):642–672. doi:10.1002/2014rg000451.
CrossRef - Fredston-Hermann A., C.J. Brown, S. Albert, C.J. Klein, S. Mangubhai, J.L. Nelson, L. Teneva., A. Wenger, S.D. Gaines, and B.S. Halpern. 2016. Where Does River Runoff Matter for Coastal Marine Conservation? Front. Mar. Sci. 3:273. doi: 10.3389/fmars.2016.00273.
CrossRef - Berkun, H., and E. Aras. 2012. River sediment transport and coastal erosion in the south-western Black Sea river. Journal of Hydrology and Hydromechanics, 60(4):299-308.
CrossRef - Warrick, J.A., A.W. Stevens, and I.M. Miller., et al. 2019. World’s largest dam removal reverses coastal erosion. Sci Rep 9, 13968. https://doi.org/10.1038/s41598-019-50387-7 , Accessed: 10, 06, 2021.
CrossRef - Tripathy, G.R., S.K. Singh, R. Bhushan, and V. Ramaswamy. 2011. Sr–Nd isotope composition of the Bay of Bengal sediments: Impact of climate on erosion in Himalaya, Geochemical Journal, 45(3):175-186.
CrossRef - Rozengurt, M., and I. Haydock. 1993. Freshwater flow diversion and its implications for coastal zone ecosystems. Transactions of the 58thNorth American Wildlife and Natural Resources Conference.Wildlife Management Institute, pp. 287–293.https://wildlifemanagement.institute/store/product/47. Accessed 12 June 2021.
- Stanley, D.J. 1996. Nile delta: extreme case of sediment entrapment on a delta plain and consequent coastal land loss. Marine Geology, 129(3-4):189–195.
CrossRef - Dai, S.B., S.L. Yang, and A.M. Cai. 2008. Impacts of dams on the sediment flux of the Pearl River, southern China. CATENA, 76(1):36–43. doi:10.1016/j.catena.2008.08.004.
CrossRef - Khaddor, I., M. Achab, M.R. Soumali, A. Benjbara, A.H. Alaoui. 2021.The Impact of the Construction of a Dam on Flood Management. Civil Engineering Journal. 7:2. doi: https://doi.org/10.28991/cej-2021-03091658.
CrossRef - Yamini, O.A., M.R. Kavianpour, A. Movahedi. 2020. Performance of Hydrodynamics Flow on Flip Buckets Spillway for Flood Control in Large Dam Reservoirs. Journal of Human, Earth, and Future.1:1.doi: 10.28991/HEF-2020-01-01-05.
CrossRef - da Silva, G.C.X., C.H.M. de. Abreu, N.D. Ward, L.P. Belúcio, D.C. Brito, H.F.A. Cunha, A.C. da Cunha. 2020. Environmental Impacts of Dam Reservoir Filling in the East Amazon. Frontiers in Water, 2:11. doi:10.3389/frwa.2020.00011.
CrossRef - Soukhaphon, A., I.G. Baird, Z.S. Hogan. 2021. The Impacts of Hydropower Dams in the Mekong River Basin: A Review. Water. 13(3):265. https://doi.org/10.3390/w13030265.
CrossRef - Charoenlerkthawin, W., M. Namsai, K. Bidorn, C. Rukvichai, B. Panneerselvam, B. Bidorn. 2021. Effects of Dam Construction in the Wang River on Sediment Regimes in the Chao Phraya River Basin. Water. 3(16):2146. https://doi.org/10.3390/w13162146.
CrossRef - Mishra, S.P. 2017 Stochastic Modeling of Flow and Sediment of the Rivers at Delta Head, East Coast of India. American Journal of Operations Research, 7:331-347. https://doi.org/10.4236/ajor.2017.76025.
CrossRef - Warrick, J.A., A.W. Stevens, I.M. Miller, S.R. Harrison, A.C. Ritchie, G. Gelfenbaum. 2019. World’s largest dam removal reverses coastal erosion. Scientific Reports, 9(1):13968. doi:10.1038/s41598-019-50387-7.
CrossRef - Andredaki, M., A. Georgoulas, V. Hrissanthou, N. Kotsovinos. 2014. Assessment of reservoir sedimentation effect on coastal erosion in the case of Nestos River, Greece. International Journal of Sediment Research, 29(1):34–48. doi:10.1016/S1001- 6279(14)60020-2.
CrossRef - Berkun, M., E. Aras. 2012. River sediment transport and coastal erosion in the Southeastern Black Sea Rivers. Journal of Hydrology and Hydromechanics. 60:299-308. doi:10.2478/v10098-012-0026-z.
CrossRef - Jana, A., S. Maiti, A. Biswas. 2016. Analysis of short-term shoreline oscillations along MidnapurBalasore Coast, Bay of Bengal, India: a study based on geospatial technology. Modeling Earth Systems and Environment, 2(2):64. doi:10.1007/s40808-016-0117-7.
CrossRef - Water Year Book, Baitarani, Subarnarekha and Burhabalang Basin (2016-2017). Central Water Commission, Govt. of India.
- Mohanty, P. K., U. S. Panda, S. R. Pal, P. Mishra.2008. Monitoring and Management of Environmental Changes along the Orissa Coast. Journal of Coastal Research 24(sp2):13-27. https://doi.org/10.2112/04-0255.1.
CrossRef - Malcolm J. B., Carter, D. J., Janet M. H., 1995. Littoral Cell Definition and Budgets for Central Southern England. Journal of Coastal Research, 11(2), 381–400. http://www.jstor.org/stable/4298347.
- Wulder, M.A., T.R. Loveland, D.P. Roy, C.J. Crawford, J.G. Masek, C.E. Woodcock, and Z. Zhu. 2019. Current status of Landsat program, science, and applications. Remote Sensing of Environment, 225:127– 147. doi:10.1016/j.rse.2019.02.015.
CrossRef - Young, N.E., R.S. Anderson, S.M. Chignell, A.G. Vorster, R. Lawrence, and P.H. Evangelista. 2017. A survival guide to Landsat preprocessing. Ecology, 98(4):920– 932. doi:10.1002/ecy.1730.
CrossRef - McFeeters, S.K. 1996. The use of the Normalized Difference water Index (NDWI) in the delineation of open water features. International Journal of Remote Sensing, 17(7):1425-1432.
CrossRef - Murty, V.S.N., A. Suryanarayana, and D.P. Rao, 1993. Current structure and volume transport across 12°N in the Bay of Bengal. Indian J. Mar. Sci. 22:12–16.
- Shetye, S.R., A.D. Gouveia, D. Shankar, S.S.C. Shenoi, and P.N. Vinayachandran , et al. 1996 Hydrography and circulation in the western Bay of Bengal during the northeast monsoon. J. Geophys. Res. 101:14011–14025.
CrossRef - Mukherjee, A., D. Shankar, V. Fernando, P. Amol, S.G. Aparna, R. Fernandes, and S. Vernekar. 2014. Observed seasonal and intraseasonal variability of the East India Coastal Current on the continental slope. Journal of Earth System Science, 123(6):1197–1232. doi:10.1007/s12040-014-0471-7.
CrossRef - Castelle, B., T. Scott, R.W. Brander, and R.J. McCarroll. 2016. Rip current types, circulation and hazard. Earth-Science Reviews, 163:1–21. doi:10.1016/j.earscirev.2016.09.008.
CrossRef - Hurst, M.D., D.H. Rood, M.A. Ellis, R.S. Anderson, and U. Dornbusch. 2016. Recent acceleration in coastal cliff retreat rates on the south coast of Great Britain. Proceedings of the National Academy of Sciences, 113(47):13336–13341. doi:10.1073/pnas.1613044113.
CrossRef - Oyedotun, T.D.T., A. Ruiz-Luna, and A.G. Navarro-Hernández, 2018. Contemporary shoreline changes and consequences at a tropical coastal domain. Geology, Ecology, and Landscapes, 2(2):104–114. doi:10.1080/24749508.2018.1452483.
CrossRef - Kim, K-H., B-S. Shin, and K.T. Shim. 2019. Investigation of Coastal Environment Change Using Wave Measurement Sensors and Geographical Laser Scanner. Journal of Sensors, 2019:1–9. doi:10.1155/2019/3754972.
CrossRef


