Land Use/Land Cover (LU/LC) Changes and its impact on Soil Organic Carbon Stock in Killiar River Basin, Kerala, India: A Geospatial Approach
Sabu Joseph
*
 , Rahul R
and Sukanya S
, Rahul R
and Sukanya S
http://dx.doi.org/10.12944/CWE.16.3.2
Copy the following to cite this article:
Joseph S, Rahul R, Sukanya S. Land Use/Land Cover (LU/LC) Changes and its impact on Soil Organic Carbon Stock in Killiar River Basin, Kerala, India: A Geospatial Approach. Curr World Environ 2021;16(3). DOI:http://dx.doi.org/10.12944/CWE.16.3.2
Copy the following to cite this URL:
Joseph S, Rahul R, Sukanya S. Land Use/Land Cover (LU/LC) Changes and its impact on Soil Organic Carbon Stock in Killiar River Basin, Kerala, India: A Geospatial Approach. Curr World Environ 2021;16(3). Available From: https://bit.ly/3IcYV2k
Download article (pdf) Citation Manager Publish History

Introduction
Land use/land cover (LU/LC) change has been identified as one of the most potent anthropogenically driven repercussions on the environment. The latter half of the 20th century witnessed land-use changes emerging as a widespread phenomenon all over the world1. Monitoring LU/LC changes are one of the most important components to evolve strategies for managing natural resources and monitoring environmental changes2,3,4. Urban development leads the LU/LC changes in many areas in the world, mostly in developing countries5,6,7.
Information on LU/LC changes helps to understand changes in the environment and assists decision-makers to plan suitable projects for sustainable development8,9. Landsat data provides the longest record with large-scale medium spatial resolution earth observation data10,6,11. Urban expansion settings in many parts of the world pose a vital impact on a wide range of sectors viz., ecology, climate, hydrological systems, land use, energy flow, etc., all of which can be tracked through LU/LC change detection analysis12,13,14.
The majority of the land use-induced changes on soil carbon storage are reflected as atmospheric CO2 release or removal15,16,17, eventually leading to the perturbation of the global carbon cycle12.
There is a net flux of carbon from land-use change resulting from the conversion of natural ecosystems15,18,19. For instance, as forests hold a tremendous amount of carbon stocks, the conversion of forest into plantations creates an imbalance of Soil Organic Carbon (SOC) during land-use conversion20,21,22. The sensitivity of Soil Organic Carbon to anthropogenic disturbances makes it a potential determinant of the terrestrial carbon cycle and climate change16,22. Thus, the Soil Organic Carbon assessment can help stakeholders to make better initiatives regarding LU/LC in which sustainability can be achieved.
This paper analyzes the spatial pattern of LU/LC change detection along the Killiar River Basin (KRB) - a major tributary of Karamana river in Kerala - over a period of 64 years (1957-2021) through remote sensing and GIS approach. Also, a preliminary attempt has been made to appraise the land-use change impacts on soil carbon stock, which is the first of its kind in the study area. Thus the research aims to contribute as a baseline data for policy-makers for the formulation of sustainable land management strategies leading to improved carbon sequestration.
Study Area
The study was carried out in the Killiar river basin (KRB), one of the prominent tributaries of Karamana River in Thiruvananthapuram district, Kerala (India). The Karamana river starts from the southern tip of the Western Ghats at Chemmunji Mottai and Aathiramala (1600 m AMSL), flows 68 km westward and merges with the Arabian Sea at Panathura, south of Thiruvananthapuram. The largest tributary of Karamana river is Killiar, which originates at Panavur (8°38’30.7” N and 76°59’19.4” E) in Nedumangad taluk of Thiruvananthapuram district and flows for a distance of 24 km. The drainage area is 102 km2 and is a 6th order river (Figure 1). Killiar drains Nedumangad forest and its basin is rich in avian fauna. The Killiar merges with the Karamana River at Pallathukadavu (08â°27’23.4” N and 76â°57’32” E). In its final lap, the river runs parallel to the sea and the river course here is known as the Edayar.
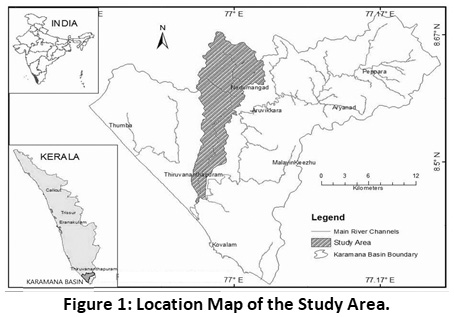 |
Figure 1: Location Map of the Study Area. Click here to view Figure |
Methodology
The land use map of KRB for the period 1957, 2005 and 2021 has been prepared using the SOI toposheet of 1957 (1:50,000), IRS LISS-III data of 2005 (geo-referenced, 1:50,000) and Landsat 8 OLI & TIRS imagery of 2021 (supervised classification) respectively. Land use data were visually interpreted using ArcGIS v.10.0 software (for processing, analysis and integration of spatial data) and layer stacked for the convenience of selection of the study area. Supervised classification was performed and the image was delineated to Level – I. It is further divided into Level–II and Level-III. The LU/LC thematic map was prepared from this for 1957, 2005 and 2021. Area of each category was calculated and analyzed for change detection by comparative change analysis.
Soil Carbon Stock Calculation based on Land Use Changes
The Soil Organic Carbon (SOC) stock was calculated for soil to a depth of 30 cm using Intergovernmental Panel on Climate Change (IPCC) based guidelines (2003)23. The computation of carbon pool (Mt C) in all land use categories were done by multiplying the carbon stock in each unit area (t/ha) with the total area covered by that particular land use. The SOC stock for the study period i.e., 1957, 2005 and 2021 were assessed using by applying the equation provided by IPCC 200323.
∆CCCsoil = [(SOC0 – SOC (0 –T))× A] / T (1)
SOC= SOCREF × FLU × FMG × FI (2)
∆CCCsoil = annual change in carbon stocks in mineral soils, tonnes C yr-1
SOC0 = soil organic carbon stock in the inventory year, tonnes C ha-1
SOC(0-T) = soil organic carbon stock T years prior to the inventory, tonnes C ha-1
T = inventory time period, yr
A = land area of each parcel, ha
SOCREF = default reference carbon stock (t/ha) (Table S1)
FLU = stock change factor for each land use pattern (dimensionless), FMG = stock change factor for management practice (dimensionless), FI = stock change factor for organic matter input (dimensionless) based on IPCC Good Practice Guidance for LULUCF guidelines23.
The SOC stock change factors (FLU, FMG, and FI) were used from IPCC23 (Table S1), depending on land use management practices. The SOC stock change factors (FLU, FMG, and FI) were adopted from IPCC23 based on land use management strategies reported by local people during field visits in addition to the data provided by Kerala State Remote Sensing and Environment Centre (KSREC). For calculating change in SOC stock (Mt C i.e., million tonnes of carbon) change in the area (ha) was multiplied with the change in SOC stock (t/ha) of each specific land-use conversion.
Results and Discussion
The results of LU/LC change detection based on comparative change analysis are given in Tables 1, 2, and 3. Various categories of LU/LC were delineated from the study area including agricultural land (cropland and agricultural plantation), built-up land, forest (evergreen/semi-evergreen, forest plantations, forest blank, scrub forest), water bodies and wastelands (scrubland, barren rocky/stony waste, sandy area).
Land Use/Land Cover- 1957
The detailed area-wise description of LU/LC of KRB for the period of 1957 is given in Table 1 and Figure 2. A total of five LU/LC categories have been identified for Level I classification. These are agricultural land (91.04%), built-up (5.90%), water bodies (1.18%), wasteland (1.2%) and forest land (0.67%) respectively.
Among these, the agricultural land covered an area of 753.92 km2 that accounting for 91% of the total area. It included double crops (2.01%), single crops (0.001%), and plantation crops comprising cashew (0.001), coconut (1.75), rubber (7.11), and other mixed plantation crops (80.17%). The total area of settlements in 1957 was 48.53 km2 (5.86%) and it falls in the built-up land. The water body consisting of rivers, streams, and ponds together constitute 9.84 km2 (1.18%). Most of the natural vegetation/forest is seen in the highlands which come to 5.58 km2 (0.67%). It constitutes evergreen/ semi-evergreen forest and forest plantations. Evergreen/semi-evergreen forest occupied most of the forest area covering 4.90 km2 (0.59%) and the rest of the area was occupied by forest plantations of 0.69 km2 (0.08%).
The total wasteland of all categories in the basin was 10.06 km2 (1.2%). This include barren/stony waste/ sheetrock areas which accounts for a considerable area, i.e., 3.78 km2 (0.45%) and sandy area occupying 0.23 km2 (0.02%). The scrubland was the most predominant class observed under wasteland with an area of 6.05 km2 (0.83%).
Table 1: Land Use/Land Cover Classification of Killiar River Basin (KRB)-1957.
|
Level I |
Level II |
Level III |
Area |
Total Area |
|
Agriculture |
Cropland |
Double Crop(Kharif+Rabi) |
16.69 |
2.01 |
|
Cropland(Kharif) |
0.01 |
0.001 |
||
|
Plantation |
Cashew |
0.01 |
0.001 |
|
|
Coconut |
14.53 |
1.7 |
||
|
Rubber |
58.89 |
7.11 |
||
|
Mixed |
663.79 |
80.17 |
||
|
Subtotal |
|
|
753.92 |
91.04 |
|
Built-up |
Towns/Cities/Villages |
|
48.53 |
5.86 |
|
Subtotal |
|
|
48.53 |
5.90 |
|
Forest |
Evergreen/ Semi-evergreen |
|
4.90 |
0.59 |
|
Forest Plantation |
|
0.68 |
0.08 |
|
|
Subtotal |
|
|
5.58 |
0.67 |
|
Water bodies |
River/Streams/Ponds |
|
9.84 |
1.18 |
|
Subtotal |
|
|
9.84 |
1.18 |
|
Wasteland |
Scrubland |
|
6.05 |
0.83 |
|
Barren/Stony waste/ Sheetrock |
|
3.78 |
0.45 |
|
|
Sandy Area |
|
0.23 |
0.02 |
|
|
Subtotal |
|
|
10.06 |
1.2 |
|
Grant Total |
|
|
827.93 |
100 |
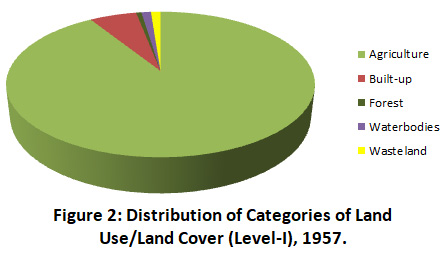 |
Figure 2: Distribution of Categories of Land Use/Land Cover (Level-I), 1957. Click here to view Figure |
Land Use/Land Cover – 2005
The detailed area-wise description of the LU/LC of KRB for the period 2005 is given in Table 2, Figure 3 and Figure 6. A total of five categories have been identified for Level–I. These are agricultural land (82.87%), built- upland (15.28%), forest land (0.36%), water bodies (0.96%) and wasteland (0.53%).
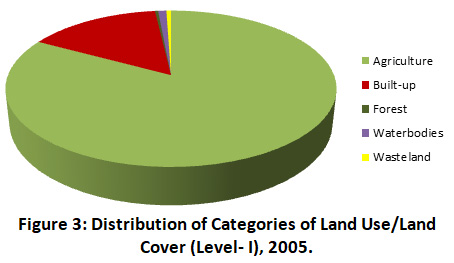 |
Figure 3: Distribution of Categories of Land Use/Land Cover (Level- I), 2005. Click here to view Figure |
Agriculture land covered an area of 685.44 km2 and accounted for 82.87% of the total area. It comprises plantation crops (5.79%), horticulture crops (47.65%), agro-horticulture crops (27.73%) and double crops (1.60%). Built-up land is recorded as 126.68 km2 comprising 15.28%. Rural settlements are the dominant one (7.20%), followed by urban settlements (3.93%), mixed built-up (3.36%), residential (0.59%) and transportation (0.19%).
Table 2: Land use/Land cover classification of Killiar River Basin (KRB)-2005.
|
Level I |
Level II |
Level III |
Area |
Area |
|
Agriculture |
Plantation |
Plantation |
47.99 |
5.79 |
|
Horticulture |
394.58 |
47.65 |
||
|
Agro Horticulture |
229.59 |
27.73 |
||
|
Cropland |
Two Crop Area |
13.28 |
1.60 |
|
|
Subtotal |
|
|
685.44 |
82.87 |
|
Built-up |
Towns/ Cities/ Villages |
Rural |
59.69 |
7.20 |
|
Urban |
32.58 |
3.93 |
||
|
Residential |
4.89 |
0.59 |
||
|
Mixed Built-up |
27.87 |
3.36 |
||
|
Transportation |
1.65 |
0.19 |
||
|
Subtotal |
|
|
126.68 |
15.28 |
|
Forest |
Scrub Forest |
|
0.06 |
0.007 |
|
Forest Blank |
|
0.15 |
0.01 |
|
|
Forest Plantation |
|
0.74 |
0.08 |
|
|
Natural Semi Natural Grassland and Grazing Land |
Temperate/ Sub Tropical |
0.30 |
0.03 |
|
|
Evergreen/ Semi evergreen |
Dense/ Closed |
1.96 |
0.23 |
|
|
Open |
0.04 |
0.004 |
||
|
Subtotal |
|
|
3.25 |
0.36 |
|
Water bodies |
River/ Stream/ Ponds |
Perennial |
7.94 |
0.95 |
|
Dry |
0.11 |
0.01 |
||
|
Subtotal |
|
|
8.05 |
0.96 |
|
Wasteland |
Scrub Land |
|
0.90 |
0.10 |
|
Barren rocky/ Stony waste |
|
0.75 |
0.09 |
|
|
Sandy Area |
Coastal |
2.59 |
0.31 |
|
|
Mining/ Industrial Waste |
Mine/ Quarry |
0.27 |
0.03 |
|
|
Subtotal |
|
|
4.51 |
0.53 |
|
Grand Total |
|
|
827.93 |
100 |
Out of all classifications, the total forest land in the basin was 3.25 km2 (0.36%). Under this forest subclass, five categories have been demarcated, viz., evergreen/semi-evergreen (0.24%), forest plantations (0.08%), natural/semi-natural grassland and grazing land (0.03%), forest blank (0.01%) and scrub forest (0.007%).The water body consisting of rivers, streams and ponds together constitute about 8.05 km2 (0.96%). Of which, perennial water body constitute 7.94 km2 (0.95%) and dried ones comprise 0.11 km2 (0.01%). The total area of wasteland in the basin was 4.51 km2 (0.53%). This include scrubland which accounts for 0.90 km2 (0.10%), barren rocky/stony waste of area 0.75 km2 (0.09%) and mining/ industrial area of area 0.27 km2 (0.03%). The majority of the wasteland sub-class was dominated by the sandy area with an areal coverage of 2.59 km2 (0.31%) in the coastal area.
Land Use/Land Cover – 2021
The detailed area-wise description of the LU/LC of KRB for the period 2021 is given in Table 3, Figure 4 and Figure 7. A total of five categories have been identified for Level–I. These are agricultural land (24.81%), built- upland (57.49%), forest land (0.34%), water bodies (0.56%) and wasteland (16.8%).
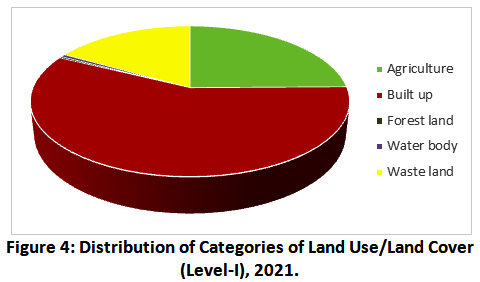 |
Figure 4: Distribution of Categories of Land Use/Land Cover (Level-I), 2021. Click here to view Figure |
Analysis of LU/LC status of KRB in the year 2021 revealed that agricultural land covered an area of 205.57 km2 (24.82%) of total area. It comprises plantation crops (23.5%) and Cropland (1.31%). The total area of Built-up land is increased from 2005 to 2021 and it is about 57.49% (474.98 km2). In the year 2021, the area of urban (24.25 km2), residential (84.68 km2) and transportation (11.21 km2) area is increased compared with previous years. The total area of forest land (2.89 km2) and water body (4.70 km2) decreased in the study area while the area of wasteland (139.79 km2) increased.
Table 3: Land Use/Land Cover Classification of Killiar River Basin (KRB) -2021.
|
Level I |
Level II |
Level III |
Area |
Area |
|
Agriculture |
Plantation |
|
194.67 |
23.5 |
|
Cropland |
Two Crop Area |
10.9 |
1.31 |
|
|
Subtotal |
|
|
205.57 |
24.81 |
|
Built-up |
Towns/ Cities/ Villages |
Rural |
216.28 |
26.12 |
|
Urban |
124.25 |
15.13 |
||
|
Residential |
84.68 |
10.23 |
||
|
Mixed Built-up |
38.56 |
4.66 |
||
|
Transportation |
11.21 |
1.35 |
||
|
Subtotal |
|
|
474.98 |
57.49 |
|
Forest |
Scrub Forest |
|
0.04 |
0.004 |
|
Forest Blank |
|
0.12 |
0.014 |
|
|
Forest Plantation |
|
0.78 |
0.091 |
|
|
Natural Semi Natural Grassland and Grazing Land |
Temperate/ Sub Tropical |
0.28 |
0.04 |
|
|
Ever green/ Semi evergreen |
Dense/ Closed |
1.65 |
0.19 |
|
|
Open |
0.02 |
0.002 |
||
|
Subtotal |
|
|
2.89 |
0.34 |
|
Water bodies |
River/ Stream/ Ponds |
Perennial |
4.61 |
0.55 |
|
Dry |
0.09 |
0.01 |
||
|
Subtotal |
|
|
4.70 |
0.56 |
|
Wasteland |
Scrub Land |
|
12.69 |
1.53 |
|
Barren rocky/ Stony waste |
|
62.58 |
7.55 |
|
|
Sandy Area |
Coastal |
42.39 |
5.1 |
|
|
Mining/ Industrial Waste |
Mine/ Quarry |
22.13 |
2.67 |
|
|
Subtotal |
|
|
139.79 |
16.8 |
|
Grand Total |
|
|
827.93 |
100 |
Comparative Change Analysis of Land Use/Land Cover (1957-2021)
Comparative analysis of land use patterns in 1957, 2005 and 2021 in the KRB (Table 4, Figure 8), it is evident that there has been a significant change in the area during 1957-2021. The reduction in agriculture plantation (-548.35 km2) and cropland (-5.8 km2) have occurred during this period.
There was an upsurge in the built-up area during the period (426.45 km2; +51.51%) possibly due to over-population and urbanization. The areal extent of wasteland increased by 129.73 km2 (+15.697%) falling under the sandy area category. Wasteland also increased in the mining/industrial sector by 22.13 km2 (+2.67%). Barren rocky/ stony waste showed a remarkable decrease in the area of about 58.8 km2 (+7.10%).
Forest area recorded a decrease in the evergreen and semi-evergreen category by 3.23 km2 (-0.39%) but showed a marginal increase in forest plantation area (0.1 km2; +0.001%). Other forest categories of 2005 showed a marginal increase in areal extent as follows; forest blank by 0.15 km2 (+0.01%), natural/semi-natural grassland and grazing land by 0.30 km2 (+0.03%) and scrub forest by 0.06 km2 (+0.007%). This shows the deterioration of native forest species which have been replaced with plantations.
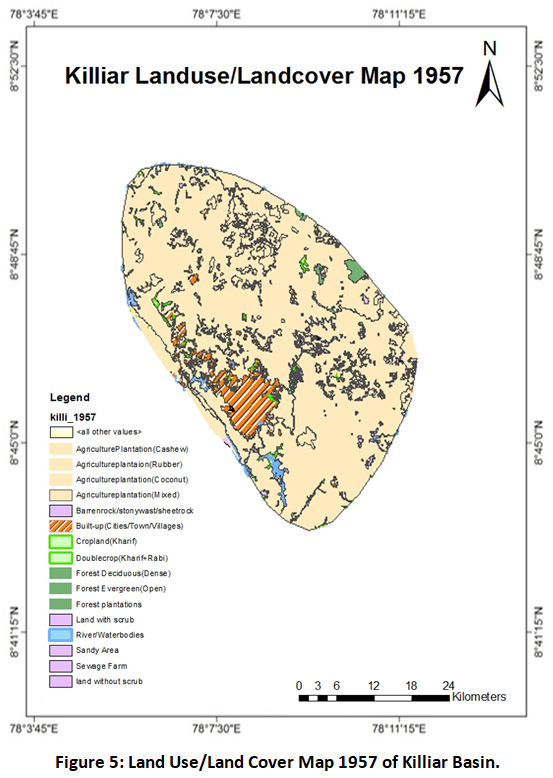 |
Figure 5: Land Use/Land Cover Map 1957 of Killiar Basin. Click here to view Figure |
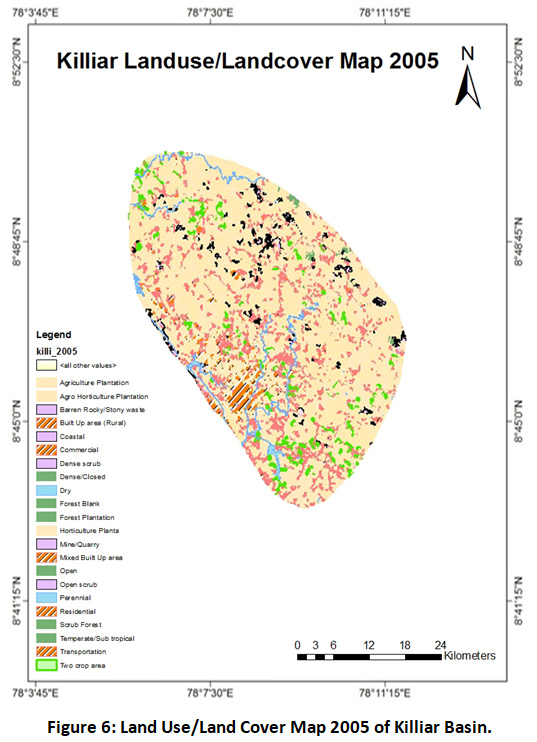 |
Figure 6: Land Use/Land Cover Map 2005 of Killiar Basin. Click here to view Figure |
The decline in water body area was noted with a decrease in areal extent (-5.14 km2; -0.62%). Land-use change in a tropical river basin influences the organic matter dynamics in tropical rivers24. The percentage area lost by the LU/LC classes especially the agricultural land has been converted to built-up land, resulting in the increase of built-up area. Water bodies, forest land also showed a marginal reduction in the area resulting in the overall conspicuous increase of built-up area.
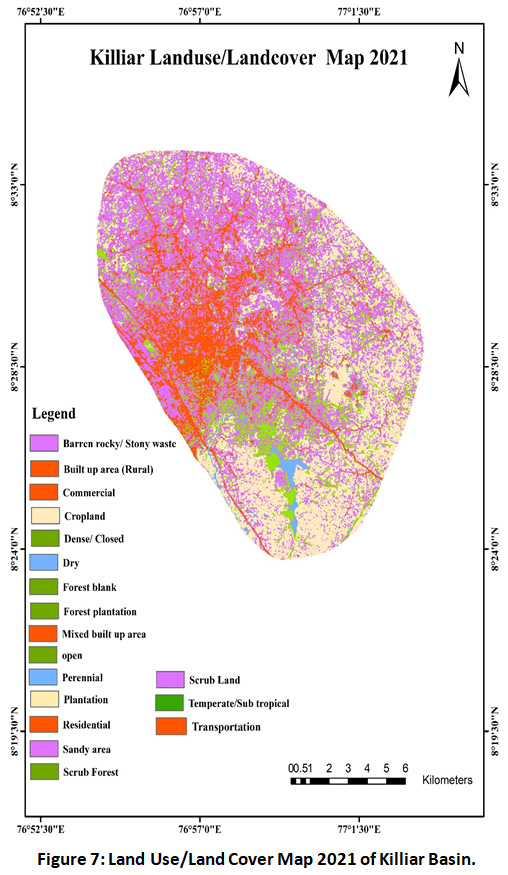 |
Figure 7: Land Use/Land Cover Map 2021 of Killiar Basin. Click here to view Figure |
Table 4: Change in Land Use/Land Cover of KRB- 1957-2021.
|
Level I |
Level II |
1957 |
2005 |
2021 |
Change in Area (km2) |
Change of Area in Percentage (%) |
|
Agriculture |
Cropland |
16.70 |
13.28 |
10.9 |
-3.42 |
-0.70% |
|
Plantation |
737.22 |
672.16 |
194.67 |
-542.55 |
-65.53% |
|
|
Subtotal |
|
753.92 |
685.44 |
48.96 |
-548.35 |
-66.23% |
|
Built-up |
Towns/ Cities/Villages |
48.53 |
126.68 |
474.98 |
+426.45 |
+51.51% |
|
Subtotal |
|
48.53 |
126.68 |
474.98 |
+426.45 |
+51.51% |
|
Forest |
Evergreen/ Semi-evergreen |
4.90 |
2.00 |
1.67 |
-3.23 |
-0.39%, |
|
Forest Plantation |
0.68 |
0.74 |
0.78 |
+0.1 |
+0.001% |
|
|
Forest Blank |
0.00 |
0.15 |
0.12 |
+0.12 |
|
|
|
Natural/ Semi Natural |
0.00 |
0.30 |
0.28 |
+0.28 |
|
|
|
Scrub Forest |
0.00 |
0.06 |
0.04 |
+0.04 |
|
|
|
Subtotal |
|
5.58 |
3.25 |
2.89 |
-2.69 |
-0.32% |
|
Water bodies |
River/ Streams/Lakes |
9.84 |
8.05 |
4.70 |
-5.14 |
-0.62% |
|
Subtotal |
|
9.84 |
8.05 |
4.70 |
-5.14 |
-52.24% |
|
Wasteland |
Scrub Land |
6.05 |
0.90 |
12.69 |
+6.64 |
+0.80% |
|
Barren Rocky/ Stony Waste |
3.78 |
0.75 |
62.58 |
+58.8 |
+7.10% |
|
|
Sandy Area |
0.23 |
2.59 |
42.39 |
+42.16 |
+5.09% |
|
|
Mining/ Industrial Waste |
0.00 |
0.27 |
22.13 |
+22.13 |
+2.67% |
|
|
Subtotal |
|
10.06 |
4.51 |
139.79 |
+129.73 |
+15.67% |
|
Grand Total |
|
827.93 |
827.93 |
827.93 |
0.00 |
0.00% |
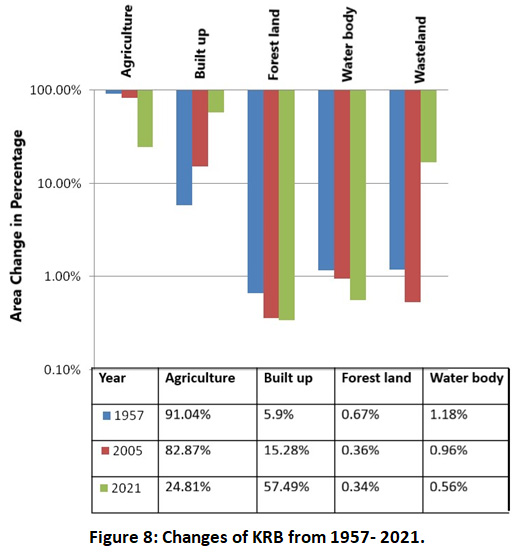 |
Figure 8: Changes of KRB from 1957- 2021. Click here to view Figure |
The area-wise description of LU/LC of KRB for the period 1957 shows agriculture land as the major class with an area of about 753.92 km2 (91.04%) out of the total area of 827.93 km2, followed by built- up with an area of 48.53 km2 (5.90%). Forest covered an area of about 5.58 km2 (0.67%), water bodies covered 9.84 km2 (1.18%) and wastelands, 10.06 km2 (1.2%).
A noteworthy rise in built-up lands (+9.43%) is apparent in the study area during the period of 1957-2005. A remarkable fall in the agricultural area has been noted in the 48-year time span, whereas a threefold increase in the built-up area has been observed. Compared to 2005, built-up land further expanded four times in 2021 (Figure 7), in contrast to the agricultural lands where a huge areal decline from 685.44 km2 to 48.96 km2 was noted (Table 4, Figure 7). Within the period of 2005 to 2021, wastelands including scrublands, barren rocky waste, sandy area, mining and industrial wastelands showed an abrupt increase from 4.51 km2 to 139.79 km2.
This points out that the cultivated lands have undergone reclamation and converted into settlements with agglomerated settlements. Shrinking of agricultural lands up to 16.31% due to urban expansion was noticed in South Indian city Bengaluru25. The increase in the urban settlement may be attributed to the decrease in the areal extent of water bodies. In India, extreme conversion of water bodies (~-40%) as a result of horizontal urban expansion was observed in Srinagar City within a time span of almost four decades26. The decline in wastelands also could be related to the conversion of this land surface into built-up land.
Impact of Land Use Change on Regional Soil Carbon Stocks
A pilot investigation on net change in Soil Organic Carbon (SOC) pool from 1957–2021 in Killiar basin was carried out. Built-up area, water bodies, barren rocky waste, sandy area and mining (wasteland) were not included in the stock estimation. SOC in topsoil (0–30 cm) under different types of management practices for different land-use patterns was estimated in the present work. This particular layer of selection was based on the fact that soil carbon storage in the topsoil is more labile, more sensitive to land-use changes, and directly interacts with the atmosphere compared to deeper layers27. Based on IPCC (2003)23 SOC estimation method (eqn. 2), in 1957 maximum soil carbon stock was found in forests covering (60.07 t/ha), followed by agriculture land (51.16 t/ha), and wastelands (16.36 t/ha). However, in 2005, this decreased to 31.13, 43.86 and 13.96 t/ha for the forest, agricultural land and wasteland respectively. In 2021, this further decreased to 21.1 t/ha for the forest, 36.7 t/ha for agriculture and 11.74 t/ha for wasteland.
From the analyses of present study, it could be further inferred that agricultural lands (cropland and plantation) turned out to be the category with most significant temporal change in the SOC stock. Area dependent SOC stock during 1957 (Table S2) was higher (evergreen forests=176.66, forest plantation = 144.28, agriculture croplands=394.74, agriculture plantation=412.46 and scrubland=164.58 Mt C) compared to that during 2005 (evergreen forests=70.65, forest plantation=55.21, agriculture cropland=196.14, agriculture plantation=204.5 and scrubland=36.15 Mt C).
SOC stock during 2021 declined substantially compared to its previous years (evergreen forests=14.87, forest plantation=9.52, agriculture cropland=41.65, agriculture plantation=52.4 and scrubland=39.42 Mt C). Highest SOC stock flux (∆CCCsoil) was noted as a result of agriculture land conversion (cropland= -198.6, plantation = -353 Mt C) due to intense unsustainable urban development during 1957–2021 period (Table S2). Conversion of evergreen forest to agriculture land resulted in a loss of -161.8 Mt C soil organic carbon (Table S2).
In 1957, the total SOC of all land use types was 1292.72 Mt C and in 2005 this reduced to 562.65 Mt C. In 2021, total SOC decreased to 152.86 Mt C with a net loss of 1139.86 Mt C compared to 1957. This drastic net soil carbon decrease within a time span of more than half a century implies the remarkable shift of agricultural/forest/wasteland into built-up land. Similar studies in China indicated that considerable SOC loss (~ 52%) was occurred due to conversion of agricultural lands as a result of urbanization in coastal region17.
Again, several previous studies have revealed that rapid urbanization significantly impacts regional SOC stock distribution15,16,17,28. Introducing agroforestry practices in wastelands could be a feasible way to increase carbon stocks stored in the region. Numerous studies have proved that agroforestry improves land cover as well as provides carbon inputs to the soil by means of root biomass, litter, prunings, etc., especially in tropical region29,30,31,32. The carbon sequestration potential of afforestation in changing land use scenarios has been explored by several researchers worldwide33,34,35. However, Deng et al.,36 found that afforestation-induced soil carbon stocks in native forests were always lower compared to the stocks in natural forests globally. A more lucid concept put forth by Brown37 strongly pointed out the need for a spatially targeted-land use specific afforestation approach than ‘one size fits all’ conventional tree planting programs.
Conclusion
The study on the spatial pattern of LU/LC change detection along the Killiar River Basin (KRB), Kerala over half a century (1957-2021) revealed drastic LU/LC changes over this period. In 1957, the LU types were agricultural land (91.04%), built-up (5.90%), water bodies (1.18%), wasteland (1.2%) and forest land (0.67%) in the decreasing order. The general trend followed within this period is the increase in built-up area (+51.51%) and wastelands (+15.67%) resulting in the decrease of all other classes viz., agricultural lands (-66.23%), forest cover (-0.32%) and water bodies (-0.62%). This conversion and land use for built-up is likely to follow as the population is rising and the over-exploitation of natural and agricultural resources is increasing every year.
Using IPCC guidelines, the soil organic carbon (SOC) stock from 1957–2021 were estimated in the study area and in 1957, the total SOC of all land use types was 1292.72 Mt C and in 2005 this reduced to 562.65 Mt C, which further declined to 152.86 Mt C in 2021. Maximum SOC loss has been observed for the agriculture land category. Hence, the study points out the need for monitoring regional land-use shifts and the implementation of carbon-neutral plans for the city and towns in the basin. This can be achieved through sustainable land use management practices and conservation of agriculturally productive lands by employing improved carbon farming.
Acknowledgment
The author(s) thankfully acknowledge the Director, Kerala State Remote Sensing and Environment Centre (KSREC), Trivandrum for providing data for the study to carry out this work.
Funding Source
The author(s) received no financial support for the research, authorship, and/or publication of this article.
References
- Foley JA, DeFries R, Asner GP, Barford C, Bonan G, Carpenter SR, Chapin FS, Coe MT, Daily GC, Gibbs HK, Helkowski JH. Global consequences of land use. Science. 2005;309(5734):570-4.
CrossRef - Rawat JS, Biswas V, Kumar M. Changes in land use/cover using geospatial techniques: A case study of Ramnagar town area, district Nainital, Uttarakhand, India.Egypt J Remote Sens Space Sci. 2013;16(1):111-7.
CrossRef - Ahmad F, Goparaju L, Qayum A. LULC analysis of urban spaces using Markov chain predictive model at Ranchi in India.Spat Inf. Res. 2017;25(3):351-9.
CrossRef - Näschen K, Diekkrüger B, Evers M, Höllermann B, Steinbach S, Thonfeld F. The Impact of Land Use/Land Cover Change (LULCC) on Water Resources in a Tropical Catchment in Tanzania under Different Climate Change Scenarios. Sustainability. 2019;11(24):7083.
CrossRef - Belal AA, Moghanm FS. Detecting urban growth using remote sensing and GIS techniques in Al Gharbiya governorate, Egypt. Egypt J Remote Sens Space Sci. 2011;14(2):73-9.
CrossRef - Chaudhary BS, Kumar S. Use of RS and GIS for Land Use/Land Cover Mapping of KJ Watershed, India. Int J Advances in Remote Sens and GIS. 2017;5(1).
- Hinz R, Sulser TB, Hüfner R, Masonâ€D’Croz D, Dunston S, Nautiyal S, Ringler C, Schüngel J, Tikhile P, Wimmer F, Schaldach R. Agricultural development and land-use change in India: A scenario analysis of tradeâ€offs between UN Sustainable Development Goals (SDGs). Earth's Future. 2020;8(2):e2019EF001287.
CrossRef - Pal S, Ziaul SK. Detection of land use and land cover change and land surface temperature in English Bazar urban center.Egypt J Remote Sens Space Sc.2017;20(1):125-45.
CrossRef - Adhikari K, Owens PR, Libohova Z, Miller DM, Wills SA, Nemecek J. Assessing soil organic carbon stock of Wisconsin, USA and its fate under future land use and climate change.Sci Total Environ. 2019;667:833-45.
CrossRef - Huang C, Peng Y, Lang M, Yeo IY, McCarty G. Wetland inundation mapping and change monitoring using Landsat and airborne LiDAR data.Remote Sens Environ. 2014;141:231-42.
CrossRef - Alam A, Bhat MS, Maheen M. Using Landsat satellite data for assessing the land use and land cover change in Kashmir valley. GeoJournal. 2020;85(6):1529-43.
CrossRef - Schneider A. Monitoring land cover change in urban and peri-urban areas using dense time stacks of Landsat satellite data and a data mining approach.Remote Sens Environ. 2012;124:689-704.
CrossRef - Hoover JD, Leisz SJ, Laituri ME. Comparing and combining Landsat satellite imagery and participatory data to assess land-use and land-cover changes in a coastal village in Papua New Guinea. Human Ecol. 2017;45(2):251-64.
CrossRef - Stumpf F, Keller A, Schmidt K, Mayr A, Gubler A, Schaepman M. Spatio-temporal land-use dynamics and soil organic carbon in Swiss agro-ecosystems.AgricEcosyst Environ. 2018;258:129-42.
CrossRef - Xia X, Yang Z, Xue Y, Shao X, Yu T, Hou Q. Spatial analysis of land-use change effect on soil organic carbon stocks in the eastern regions of China between 1980 and 2000. Geoscience Frontiers. 2017;8(3):597-603.
CrossRef - Vasenev VI, Stoorvogel JJ, Leemans R, Valentini R, Hajiaghayeva RA. Projection of urban expansion and related changes in soil carbon stocks in the Moscow Region. J Clean Prod. 2018;170:902-14.
CrossRef - Wang S, Adhikari K, Zhuang Q, Gu H, Jin X. Impacts of urbanization on soil organic carbon stocks in the northeast coastal agricultural areas of China.Sci Total Environ. 2020:137814.
CrossRef - Houghton RA, Goodale CL. Effects of land-use change on the carbon balance of terrestrial ecosystems. Ecosystems and land-use change. 2004;153:85-98.
CrossRef - Sharma G, Sharma LK, Sharma KC. Assessment of land-use change and its effect on soil carbon stock using multitemporal satellite data in the semiarid region of Rajasthan, India. Ecological Processes. 2019;8(1):42.
CrossRef - Cosslett CE. Understanding the potential impacts of REDD+ on the financing and achievement of sustainable forest management. In A report prepared for the Secretariat of the United Nations Forum on Forests (UNFFS) 2013 Mar 15.
- Haywood A, Stone C. Estimating large area forest carbon stocks—a pragmatic design-based strategy. Forests. 2017;8(4):99.
CrossRef - Ali A, Ashraf MI, Gulzar S, Akmal M. Estimation of forest carbon stocks in temperate and subtropical mountain systems of Pakistan: implications for REDD+ and climate change mitigation.Environ Monit Assess. 2020;192(3):1-3.
CrossRef - IPCC. Good practice guidance for land use, land-use change and forestry. Eds. Penman J, Gytarsky M, Hiraishi T, Krug T, Kruger D, Pipatti R, Buendia L, Miwa K, Ngara T, Tanabe K, Wagner F. IPCC IGES. Japan. 2003.
- Silva-Junior EF, Moulton TP, Boëchat IG, Gücker B. Leaf decomposition and ecosystem metabolism as functional indicators of land use impacts on tropical streams. Ecol. Indicators. 2014;36:195-204.
CrossRef - Kavitha A, Somashekar RK, Nagaraja BC. Urban expansion and loss of Agriculture land-A case of Bengaluru city. Int JGeomatics and Geosciences. 2015;5(3):492-8.
- Fazal S, Amin A. Impact of urban land transformation on water bodies in Srinagar City, India. J Environ Prot. 2011;2(02):142.
CrossRef - Arunrat N, Pumijumnong N, Sukanya S, Chareonwong U. Factors Controlling Soil Organic Carbon Sequestration of Highland Agricultural Areas in the Mae Chaem Basin, Northern Thailand. Agronomy. 2020;10(2):305.
CrossRef - Liu X, Li T, Zhang S, Jia Y, Li Y, Xu X. The role of land use, construction and road on terrestrial carbon stocks in a newly urbanized area of western Chengdu, China.Landsc Urban Plan. 2016;147:88-95.
CrossRef - Varsha KM, Raj AK, Kurien EK, Bastin B, Kunhamu TK, Pradeep KP. High-density silvopasture systems for quality forage production and carbon sequestration in humid tropics of Southern India. Agroforestry systems. 2019;93(1):185-98.
CrossRef - Dhyani SK, Ram A, Newaj R, Handa AK, Dev I. Agroforestry for carbon sequestration in tropical India. In Carbon management in tropical and sub-tropical terrestrial systems. 2020; (pp. 313-331). Springer, Singapore.
CrossRef - Zahoor S, Dutt V, Mughal AH, Pala NA, Qaisar KN, Khan PA. Apple-based agroforestry systems for biomass production and carbon sequestration: Implication for food security and climate change contemplates in the temperate region of Northern Himalaya, India. Agroforestry Systems. 2021;95(2):367-82.
CrossRef - Siarudin M, Rahman SA, Artati Y, Indrajaya Y, Narulita S, Ardha MJ, Larjavaara M. Carbon Sequestration Potential of Agroforestry Systems in Degraded Landscapes in West Java, Indonesia. Forests. 2021; 12, 714.
CrossRef - Kale MP, Ravan SA, Roy PS, Singh S. Patterns of carbon sequestration in forests of Western Ghats and study of the applicability of remote sensing in generating carbon credits through afforestation/reforestation. J. Ind. Soc. Remote Sens. 2009;37(3):457-71.
CrossRef - Wolf S, Eugster W, Potvin C, Turner BL, Buchmann N. Carbon sequestration potential of tropical pasture compared with afforestation in Panama. Glob. Change Biol. 2011;17(9):2763-80.
CrossRef - Nave LE, Walters BF, Hofmeister KL, Perry CH, Mishra U, Domke GM, Swanston CW. The role of reforestation in carbon sequestration. New Forests. 2019;50(1):115-37.
CrossRef - Deng L, Zhu G, Tang Z, Shangguan Z. Global patterns of the effects of land-use changes on soil carbon stocks. Glob. Ecol. Conserv. 2016;5:127–138.
CrossRef - Brown I. Challenges in delivering climate change policy through land-use targets for afforestation and peatland restoration. Environ. Sci. Policy. 2020 ;107:36-45.
CrossRef
Table S1: Default Reference Soil Organic Carbon Stocks (SOCREF) in Soil Categories at 0–30 cm Depth (t/ha) (Source: IPCC, 2003).
|
Region |
HAC soils |
LAC soils |
Sandy soils |
Spodic soils |
Volcanic soils |
Wetland soils |
|
Boreal |
68 |
NA |
10 |
117 |
20 |
146 |
|
Cold temperate, dry |
50 |
33 |
34 |
NA |
20 |
87 |
|
Cold temperate, moist |
95 |
85 |
71 |
115 |
130 |
|
|
Warm temperate, dry |
38 |
24 |
19 |
NA |
70 |
88 |
|
Warm temperate, Moist |
88 |
63 |
34 |
NA |
80 |
|
|
Tropical, dry |
38 |
35 |
31 |
NA |
50 |
86 |
|
Tropical, moist |
65 |
47 |
39 |
NA |
70 |
|
|
Tropical, wet |
44 |
60 |
66 |
NA |
130 |
Table S2: Net Change in Soil Organic Carbon (SOC) Pool from 1957 through 2005 to 2021 in the Study Area.
|
Land use |
Land use |
1957 |
2005 |
2021 |
∆CCCsoil |
|||
|
SOC (t/ha) |
SOC (Mt C) |
SOC (t/ha) |
SOC (Mt C) |
SOC (t/ha) |
SOC (Mt C) |
|||
|
Forests |
Evergreen Forest |
31.66 |
176.66 |
14.77 |
70.65 |
8.91 |
14.87 |
-161.8 |
|
Forest plantation |
28.41 |
144.28 |
16.36 |
55.21 |
12.2 |
9.52 |
-134.76 |
|
|
Agriculture |
Agriculture Cropland |
23.22 |
394.74 |
21.74 |
196.14 |
17.5 |
41.65 |
-198.6 |
|
Agriculture Plantation |
27.94 |
412.46 |
22.12 |
204.5 |
19.2 |
52.4 |
-353.09 |
|
|
Wastelands |
Scrubland |
16.36 |
164.58 |
13.96 |
36.15 |
11.74 |
39.42 |
-125.16 |
|
|
Total |
|
1292.72 |
|
562.65 |
|
152.86 |
-1139.86 |


