Spatial and Temporal Assessment of Rainfall Variability Using GIS Approach in Trichy District of Tamil Nadu
P. Ponnuchakkammal1
, B. Violet Joy2
, P. Aravind2
and A. Raviraj3
*

http://dx.doi.org/10.12944/CWE.16.3.19
Copy the following to cite this article:
Ponnuchakkammal P, Joy B. V, Aravind P, Raviraj A. Spatial and Temporal Assessment of Rainfall Variability Using GIS Approach in Trichy District of Tamil Nadu. Curr World Environ 2021;16(3). DOI:http://dx.doi.org/10.12944/CWE.16.3.19
Copy the following to cite this URL:
Ponnuchakkammal P, Joy B. V, Aravind P, Raviraj A. Spatial and Temporal Assessment of Rainfall Variability Using GIS Approach in Trichy District of Tamil Nadu. Curr World Environ 2021;16(3). Available From: https://bit.ly/31ucedy
Download article (pdf) Citation Manager Publish History

Introduction
Precipitation is the important component in a Hydrologic cycle and Precipitation plays an impactful role in maintaining the sustainability of resources in the earth. Precipitation generally deals with the Rainfall events only. Based on the intensity of rainfall, it is classified into three types viz., heavy - >7.5 mm/h, moderate – between 2.5 and 7.5 mm/h and light rain - trace to 2.5 mm/h. 1 The rainfall is one of the paramount factors affecting vegetation and accessibility of water resources. Rainfall is the major source of water to the agriculture especially in rainfed agriculture. Crop productivity mainly depends upon the characteristics of rainfall such as rainfall intensity, amount of rainfall received and distribution of rainfall over an area. Characteristics of rainfall change over time and from place to place. Analysis of the rainfall characteristics is important for planning of water harvesting structures and other conservation measures for ensuring sustainability. Rainfall is a pivotal agro-climatological factor in the seasonally parched region of the world and its assessment an important perquisite for agricultural management in India.2 Many studies have been conducted in different parts of India to predict the rainfall variability.3 The crop plan can be carried out through the weekly rainfall pattern to take the extension activities and it will help to increase the agricultural productivity.4 The climate of Tamil Nadu is generally wet subtropical climate and features fairly hot temperature over the year except during the monsoon season. Rainfall, groundwater, reservoir levels and crop conditions are the major factors to determine the nature and extent of drought conditions in Tamil Nadu.5 Contemporary studies have stated that each and every analysis of hydro-climatic elements should be done at the local scale rather than at a large or global scale.
In Tiruchirappalli district Banana and Onion are the top two ranked crops due to high water requirement for other crops. Banana is a succulent, evergreen and shallow rooted crop. It require more water for its higher production. Tiruchirappalli district is one of the Banana growing belts in Tamil Nadu. The district has an area of 7390 km2 (40.6 % of net sown area) underneath rainfed situation. Spatial distribution of rainfall maps will be helpful to prepare a crop plan for different crops to increase the agricultural productivity. Based on the availability of water resources, the crop selection like drought tolerant crop and management practices such as drip irrigation, mulching etc., can be followed to ensure the food security. Keeping in view the importance of rainfall in rainfed agriculture, the present study was made to understand the Tiruchirappalli district’s rainfall characteristics.
Methodology
Area of Interest
Tiruchirappalli is one of the districts of Tamil Nadu state of India is sited in the central portion of Tamil Nadu (Fig 1) and the geographical extent of the Tiruchirappalli is 4403.83 Sq.km. For administrative purpose it was divided into 4 revenue Divisions, 11 Taluks and 507 Revenue Villages. Tiruchirappalli district experiences a tropical savanna climate and the average temperature is 28.8 °C which varies from 25.3°C in winter season to 31.7°C in summer season. River Cauvery is the significant source for drinking and irrigation water requirement in the district. One twelth of the area of Trichy district is enclosed by means of hills and revenue forest. Pachamalai hill near Thuraiyur is the significant hill in this district. Main crops grown in the district are Ragi, Paddy, Onion, Groundnut, and pulses. The high-priority cash crops in the district are Banana and Sugarcane.
Data Collection
Rainfall data of eighteen rain gauge stations for Tiruchirappalli district were (1971 to 2012 - 42 years) collected from the Public Work Department (PWD), Government of Tamil Nadu.
Methodology of the Study
Seasonal and annual rainfall data was taken for analysis of rainfall pattern of Tiruchirappalli district. Eighteen rain gauge stations under the study are located in different parts of the district to observe the rainfall event (Fig 2).
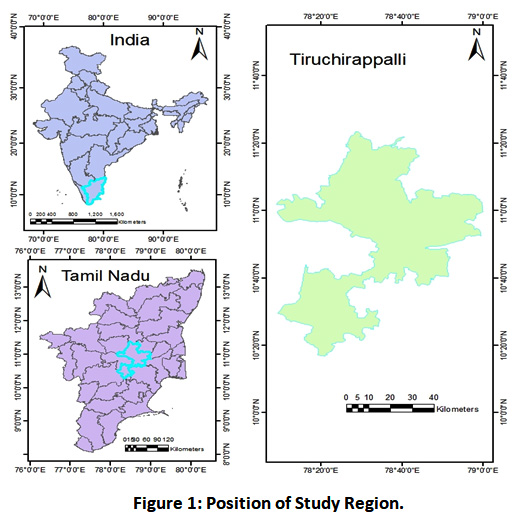 |
Figure 1: Position of Study Region. Click here to view Figure |
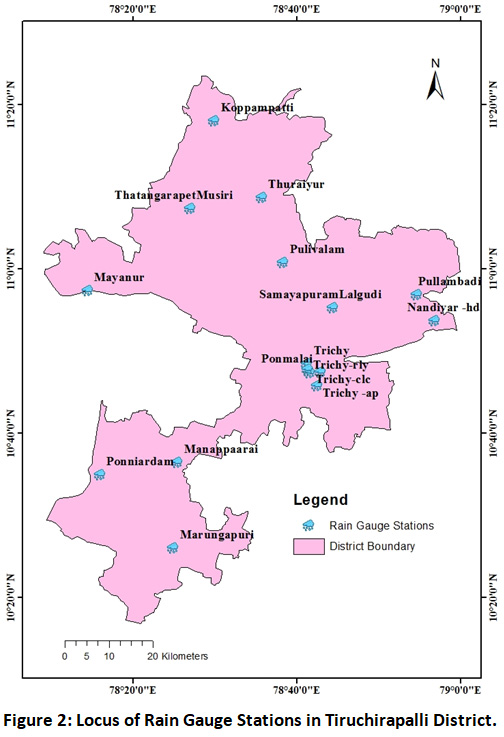 |
Figure 2: Locus of Rain Gauge Stations in Tiruchirapalli District. Click here to view Figure |
Geographical information system (GIS) of ArcGIS software version 10.3 was used for preparation of temporal and spatial rainfall distribution maps. Microsoft Excel was used for the preparation of the rainfall database and used as GIS input. Spatial interpolation is the technique of utilizing points with well-known values to assessment the values at other points. Kriging produced better results than other interpolation methods such as Inverse Distance Weighted (IDW) and spline.6 [Kriging tool in GIS was used to interpolate a raster surface from points using Kriging an advanced geostatistical procedure (Syntax: ArcToolbox – Spatial Analyst Tools- Interpolation – Kriging).] In Kriging, the seasonal rainfall data of each rain gauge stations are given as an input point feature. Where ordinary kriging method and linear semivariogram method was used for interpolation (Fig 3). Percentage Departure of annual rainfall in the district was calculated using normal annual rainfall. The category of annual departures from normal with range and colour code (Table 1) done for 10 years period (2003-2012).
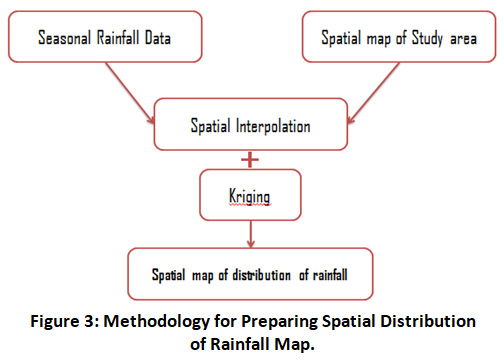 |
Figure 3: Methodology for Preparing Spatial Distribution of Rainfall Map. Click here to view Figure |
Table 1: Category of Departures from Normal7
|
Category |
Departures from Normal |
Colour Code |
|
LE - Large excess |
60 percentage or more |
|
|
E - Excess |
20 to 59 percentage |
|
|
N - Normal |
-19 to +19 percentage |
|
|
D - Deficient |
-20 to -59 percentage |
|
|
LD - Large Deficient |
-60 to -99 percentage |
|
|
No Rain |
-100 percentage |
|
|
No Data |
Data Not Available |
|
Results and Discussion
Normally the climate of the district is cold and wet. Spatial variability of climate can be large due to the precipitation ranging from <1000 mm up to >4000 mm.8,9,10 The Mean annual rainfall, Mean North East Monsoon (NEM) rainfall, Mean South West Monsoon (SWM) rainfall, Mean summer and winter rainfall, Mean rainfall distribution, spatial distribution and Percentage Departure of annual rainfall for Tiruchirappalli district are discussed below.
Mean Annual Rainfall
Tiruchirappalli district has the mean annual rainfall of 695 mm. From 1980 to 2012, the rainfall received was 24 % less than the mean rainfall for almost 19 years. During this period, the following years received rainfall less than 350 mm viz., 1976(228 mm), 1980(289 mm), 1982(340 mm), 1985(322 mm). Whereas nearly 23 years received 25% more rainfall than the mean rainfall especially the following years received rainfall more than 950 mm viz., 1977(977 mm), 1978(985 mm), 1979(1039 mm), 2005(1247mm), 2008 (981 mm). The maximum rainfall 1247 mm recorded in the year of 2005, as well as the low amount of rainfall recorded in the year of 227 mm, recorded in the year of 1976 (Fig 4). Tiruchirappalli district is part of the Cauvery Delta Zone (CDZ) in Tamil Nadu out of seven Agro climatic zones. In twentieth century Cauvery River basin has faced insignificant decrease in annual rainfall.11
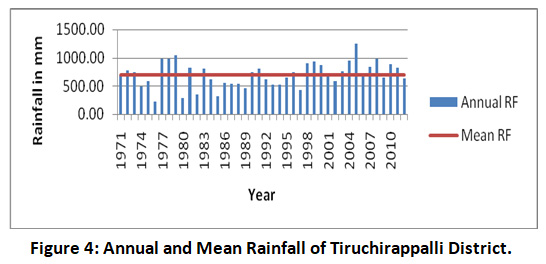 |
Figure 4: Annual and Mean Rainfall of Tiruchirappalli District. Click here to view Figure |
Mean NEM Rainfall
The mean NEM rainfall of the district was 358 mm. From 1980 to 2012, the rainfall received 31 % less than the mean north east monsoon rainfall for 18 years. During this period, the following years received rainfall less than 200 mm viz., 1974(151 mm), 1980 (189mm), 1982(197 mm), 1985(170 mm), 1988(112 mm), 1994(180 mm), 1995(181 mm). From 1980 to 2012, 24 years received 27% more rainfall than the mean. Out of which 1977 (542 mm), 1978(641 mm), 1999(624 mm), 2005(858 mm), 2008(561 mm) years received rainfall more than 500 mm (Fig 5).
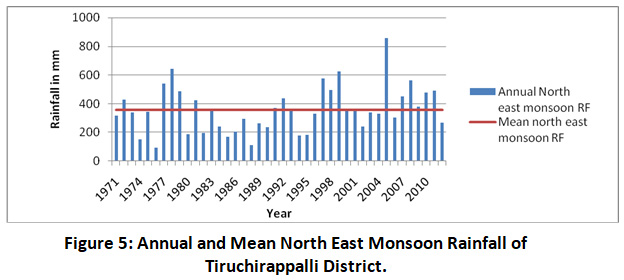 |
Figure 5: Annual and Mean North East Monsoon Rainfall of Tiruchirappalli District. Click here to view Figure |
Mean South West Monsoon Rainfall
The annual and mean SWM precipitation of Tiruchirappalli district is illustrated in Fig 6. The mean South West Monsoon rainfall is 264 mm. From 1980 to 2012, in 20 years rainfall received was 23% less than the mean. In this, the following years received rainfall less than 150 mm viz., 1980(42 mm), 1993(148 mm), 1997(106 mm). From 1980 to 2012, 22 years received (22%) more rainfall than the mean. In this, 4 years received rainfall more than 350 mm viz., 1979(472 mm), 1988(403 mm), 1991(378 mm) and 1998(358 mm).
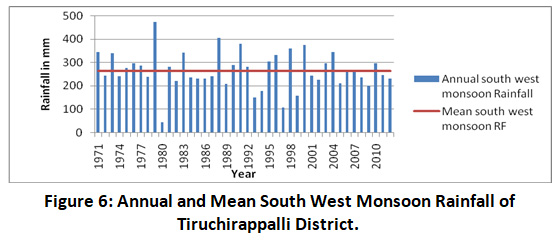 |
Figure 6: Annual and Mean South West Monsoon Rainfall of Tiruchirappalli District. Click here to view Figure |
Mean Summer Rainfall
The mean summer rainfall is 104 mm. From 1980 to 2012, in 19 years the rainfall received (41%) less than the mean summer rainfall. During this period of years received rainfall less than 50 mm viz., 1985(27 mm), 1987(37 mm), 1989(41 mm), 1992(27 mm), 1993(22 mm), 2009(48 mm). From 1980 to 2012, 23 years received more (35%) rainfall than the mean summer rainfall. Out of which the following years received rainfall more than 150 mm viz., 1972(206 mm), 1995(162 mm), 2004(252 mm), 2005(196 mm), 2008(189 mm) (Fig 7).
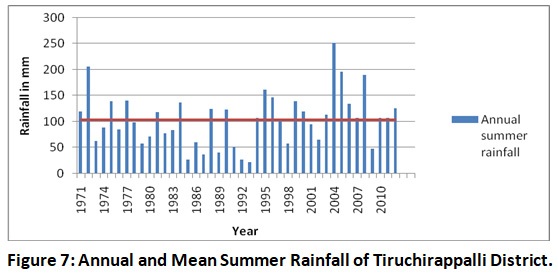 |
Figure 7: Annual and Mean Summer Rainfall of Tiruchirappalli District. Click here to view Figure |
Mean Winter Rainfall
The annual and mean winter rainfall of the Tiruchirappalli district is illustrated in Fig 8. The mean winter rainfall is 23 mm. From 1980 to 2012, the rainfall received less than the mean winter rainfall for 31 years and 11 years received more rainfall than the mean winter rainfall.
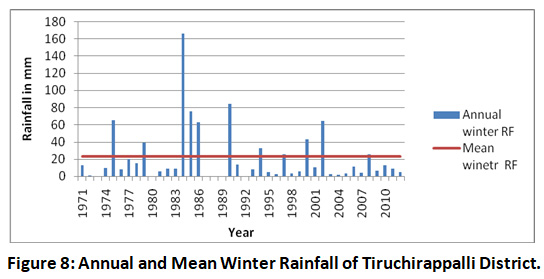 |
Figure 8: Annual and Mean Winter Rainfall of Tiruchirappalli District. Click here to view Figure |
Season Wise Distribution of Mean Rainfall (1971-2010)
Tiruchirappalli district received 48% rainfall during NEM; 35% during SWM; 14% during summer and 3% in the course of winter season out of annual rainfall (Fig 9). North East Monsoon contributed more in rainfed agricultural areas of the district followed by SWM.
Spatial Spread of Rainfall
The spatial spread of rainfall map was generated using Kriging interpolation technique of ArcGIS software. The ordinary Kriging method is one of the interpolation technique widely used, which plays an important role in interpolation and mapping precipitation data in any region.12
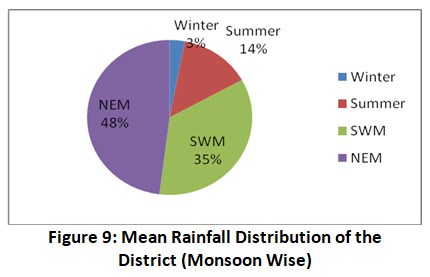 |
Figure 9: Mean Rainfall Distribution of the District (Monsoon Wise) Click here to view Figure |
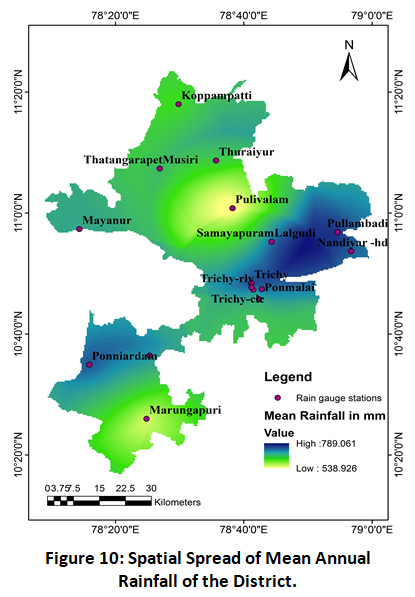 |
Figure 10: Spatial Spread of Mean Annual Rainfall of the District. Click here to view Figure |
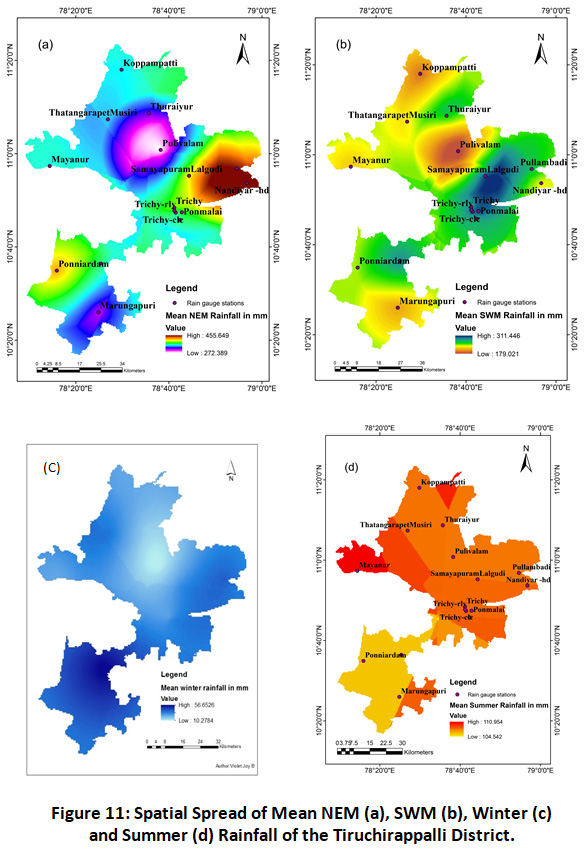 |
Figure 11: Spatial Spread of Mean NEM (a), SWM (b), Winter (c) and Summer (d) Rainfall of the Tiruchirappalli District. Click here to view Figure |
Spatial distribution of mean annual rainfall map clearly indicated that the North East part of Tiruchirappalli district received maximum rainfall compared to South West parts of Tiruchirappalli. While South East and central part of Trichy received moderate to low rainfall during the period 1971-2012 (Fig 10). Spatial map of distribution of rainfall (season wise) is illustrated in Fig 11. During NEM and SWM, North East part of Tiruchirappalli district such as pullambadi, Lalgudi and nearby area received maximum rainfall. In winter season Manappaarai and Vaiyampatti region received more rainfall where as Thottiam and Mayanur area received more rainfall in summer season.
Percentage Departure of Annual Rainfall
Percentage departure can be calculated through difference between the observed (annual rainfall) and predicted value (normal annual rainfall) and then divided by predicted value. If the percentage departures from normal is 20% to 59% it is under the category of excess. If the percentage departures from normal ranging from -19% to 19% it is under the category of Normal and more than 60% means it is large excess category. During the years 2003-2012 the percentage departure of annual rainfall was under the category of excess in 2004, 2007, 2008, 2010 and 2011, normal was in 2003, 2006, 2009, 2012 while only year 2005 was under the category of Large excess (Fig12). Out of 10 years, there is no year was under deficient category. Percentage mean departure from normal was 25 during 2003 -2012 in the district.
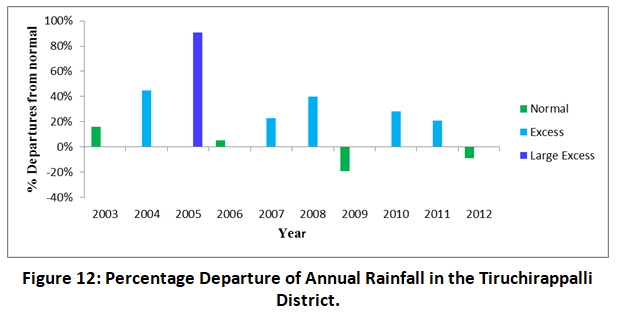 |
Figure 12: Percentage Departure of Annual Rainfall in the Tiruchirappalli District. Click here to view Figure |
Conclusion
Rainfall characteristics of Tiruchirappalli district were analyzed in the present study with the help of spatial and temporal data of GIS. It has the maximum rainfall of 1247 mm recorded in the year of 2005 while minimum rainfall of 227 mm recorded in the year of 1976. Tiruchirappalli district has the mean areal precipitation of 695 mm. The mean north east monsoon rainfall was 358 mm, which is 26% more than the mean south west monsoon rainfall (264 mm). Tiruchirappalli district secured with 48%, 35%, 14% and 3% of rainfall in the four seasons like NEM, SWM, summer and winter season respectively out of annual rainfall. The north east parts of Tiruchirappalli received maximum rainfall compared to south west parts of Tiruchirappalli. The south east and central part of Tiruchirappalli receives only moderate to low rainfall. The percentage departure of annual rainfall of the district is falling under the categories of normal, excess and large excess. The developed spatial distribution rainfall maps will be helpful to form a crop plan to increase the agricultural productivity of Tiruchirappalli district.
Acknowledgment
The authors are grateful to Water Technology Centre, Tamil Nadu Agricultural University for carrying out this study. The data provided by the State Ground and Surface Water Resources Data Centre, WRD, PWD, Go TN is hereby acknowledged.
Funding Source
There is no funding or financial support for this research work and it is part of the student research project.
Conflict of Interest
All authors are not having any conflict of interest.
Reference
- Precipitation. In: Subramanya K. Engineering Hydrology. 3rd edition. The McGraw Hill companies; 2008. 13-58.
- Alaka Gadagil. Annual and weekly analysis of rainfall and temperature for Pune: a multiple time series approach. Inst. Indian Geographers. 1986; 8(1).
- Khadeeja Priyan. Spatial and Temporal Variability of Rainfall in Anand District of Gujarat State. Aquatic Procedia. 2015; 4:713 – 720.
CrossRef - Tripathi S. K. Rainfall Analysis for Cropping Planning: A Lesson from Uttarakhand, Journal of Applied Hydrology. 2009; XXII (I):42-54.
- Alaguraja Palanichamy. Assessment of Rainfall and Groundwater for Agriculture of Tiruchirappalli District, Tamil Nadu, using Geospatial Technology. International Journal of Latest Technology in Engineering, Management & Applied Science. 2016; V (VIII):40-52.
- Julie Earls and Barnali Dixon. Spatial Interpolation of Rainfall Data Using ArcGIS:
A Comparative Study. Proceedings ESRI, University of south Florida St. Petersburg. 2007. - Yadav B.P, Ashok Kr. Das, Singh K.V and Manik S.K. Rainfall Statistics of India. Hydromet Division, India Meteorological Department, Ministry of Earth Sciences, Government of India. 2017.
- Hofstede R, Segarra P, Mena P.V. Los Paramos del Mundo. Global Peatland Initiative/NC-IUCN/EcoCiencia, Quito.2003.
- Luteyn J.L. Paramos: A Checklist of Plant Diversity, Geographical Distribution and Botanical Literature. The New York Botanical Garden Press, New York.1999.
- Sarmiento G. Ecological features of climate in high tropical mountains.
In: Vuilleumier, F., Monasterio, M. (Eds.), High Altitude Tropical Biogeography. Oxford University Press, Oxford. 1986:11–45. - Sushant S, Balasubramani K, Kumaraswamy K. Spatio-temporal Analysis of Rainfall Distribution and Variability in the Twentieth Century, Over the Cauvery Basin, South India. In: Ramkumar M., Kumaraswamy K., Mohanraj R. (Eds) Environmental Management of River Basin Ecosystems. Springer Earth System Sciences. Springer, Cham (2015). https://doi.org/10.1007/978-3-319-13425-3_2.
CrossRef - Huseyin cagan kilinc. Estimation of Rainfall Distribution Map of Turkey By IDW And Kriging Interpolation Method. American Journal of Engineering Research (AJER). 2018; 7(6): 238-241.


