The Determination of Indoor Air Quality and Thermal Comfort with Different Space and Ventilation in the Teracce and Bungalow Houses
Nur Baitul Izati Rasli1
*
 , Nor Azam Ramli1
and Mohd Rodzi Ismail2
, Nor Azam Ramli1
and Mohd Rodzi Ismail2
http://dx.doi.org/10.12944/CWE.16.3.11
Copy the following to cite this article:
Rasli N. B. I, Ramli N. A, Ismail M. R. The Determination of Indoor Air Quality and Thermal Comfort with Different Space and Ventilation in the Teracce and Bungalow Houses. Curr World Environ 2021;16(3). DOI:http://dx.doi.org/10.12944/CWE.16.3.11
Copy the following to cite this URL:
Rasli N. B. I, Ramli N. A, Ismail M. R. The Determination of Indoor Air Quality and Thermal Comfort with Different Space and Ventilation in the Teracce and Bungalow Houses. Curr World Environ 2021;16(3). Available From; https://bit.ly/3u6S5EA
Download article (pdf) Citation Manager Publish History

Introduction
Indoor air quality needs always be within the acceptable limit because, with the current situation of the pandemic, people spend most of their time indoors to avoid the spread of diseases (CoV-19). Poor indoor air pollution quality could lead to morbidity and mortality in developing countries. It could contribute to the vital risk factor for respiratory health, especially among mothers and children1 due to dust and dirt2. The sources of pollutants that contributed to poor indoor air quality: include the type of cooking and heating, occupants’ activities, smoking, tobacco smoke, building material, fabrics, biological sources, the combustion of substances for heating or fuel, emission from building materials, and can also be a by-product of the activities within the buildings3, 4. Besides that, cooking activities could promote indoor air contaminants, reduce indoor air quality, and affect the occupants’ health5, 6. It produces a complex mixture of air contaminants (inorganic gases) containing carbon monoxide (CO), nitrogen dioxide (NO2), particulate matter (PM), sulfur dioxide (SO2), volatile organic compounds (i.e., benzene, toluene, and xylene), hydrocarbons and free radicals7-9.
In addition, carbon dioxide is one of the indicators used to determine the ventilation performance indicator and the acceptability of the indoor air quality10. It corresponds to the number of people within an indoor environment11. Human metabolism could influence the high CO2 level of 0.3 L/min of exhale rate for the light work12, 13. The symptoms of nausea, dizziness, vomiting, and loss of consciousness caused the high CO and CO213. Indrie et al.2 reported that low temperature and high air humidity could stimulate the growth of microorganisms and mould. Therefore, sufficient air ventilation is prudent for indoor buildings. The ventilation system is functional to introduce the circulating of fresh air throughout the building by eliminating the indoor air contaminants to achieve good indoor air quality, to lower the health risk problems among the occupants14 and to lower the indoor temperature15. Besides that, natural ventilation could improve IAQ, thermal comfort, reduce energy consumption, and provide comfort for building occupants16. The lack of ventilation rate could worsen the indoor air quality. Therefore, a system needs to be designed to supply fresh air based on the occupants’ needs17. Hesaraki et al.18 had suggested having flexibility in ventilation levels based on the number of people and ventilation demand. The study found a ventilation rate of 0.3 ach is sufficient for two adults and one infant in a house compared to the recommended ventilation rate of 0.5 ach for acceptable indoor air quality. Energy consumption could be saved at 43 %. Furthermore, the energy consumption would decrease by decreasing the outdoor air ventilation rates. Meanwhile, increasing the outdoor air ventilation rate to lower the indoor air contaminants is not significant when the outdoor air contaminants are high and could pose an increased risk of carcinogenicity to the occupants19.
There are three natural forces of ventilation (i.e., buoyancy force (stack ventilation), wind force (cross ventilation), and their combination) that could transmit airborne contaminants vertically and horizontally20. Cross ventilation is the movement of air flows introduced by the wind-induced pressure difference between two sides of a building envelope16. Meanwhile, stack ventilation is the movement of airflow introduced by the buoyancy-induced pressure between the difference in the height of lower and upper openings and when indoor air is warmer than outdoor air21. The variations of air density occur when the outdoor air is cooler than the indoor air. The hot indoor air will rise and leave through the upper opening, and consequently, the cooler from outdoor air replaces it via, the lower entrance. Besides that, single-sided ventilation occurs from the effects of both wind and buoyancy-induced pressures at the opening for cooling purposes22. However, airborne contaminants could be mainly dominated by the direction of the wind and the location of the sources23, 24. For example, Lai et al.25 found that the transmission of PM2.5 from neighbouring apartments on the lower floors is significantly through the natural ventilation of the stack effect.
Methodology
Sampling Location
This research was conducted in bungalow and terrace houses within the Pulau Pinang and Melaka areas, respectively. The bungalow house is located in Seberang Perai Utara with a latitude of 5°33'32.9"N and longitude 100°30'13.8"E whereas the terrace house is located in Ayer Keroh with a latitude of 2°14'45.8"N and longitude 102°19'00.4"E.
Selection of Monitoring Instruments
An Indoor Air Quality probe (IQ-610) was used to measure total volatile organic compound (TVOC), carbon dioxide (CO2), carbon monoxide (CO), ozone(O3), temperature (T), relative humidity (RH), whereas formaldehyde (CH2O) was monitored by using a Formaldehyde Multi-Mode Monitor (FM-801). Airspeed (AS) was measured by using an airspeed probe (AS-201). The instruments used were from the Graywolf Model. Besides that, the Airborne Particle Counter (Handheld 3016 IAQ) Light House Model was used to measure particulate matter (PM10).
Sampling Method
The measurements for both houses (i.e., bungalow and terrace houses) were conducted at three (3) sessions; (1) morning session (6.00 a.m. – 9.00 a.m.), (2) morning-evening session (11.00 a.m. – 2.00 p.m.), and (3) evening-night session (5.00 p.m. – 8.00 p.m.). The monitoring had been conducted for three (3) hours each session for four days in the bungalow house (1 day) and terrace house (3 days). The sessions were selected based on the changing phase of time of the day, which is focusing on the existence of the sun as a source of heat (sunrise), whereas after sunset, then no more source of heat or heat comes from the outside. The bungalow house has the application of cross and stack ventilation (i.e., it has lower and upper openings at both sides). In contrast, the terrace house has single-sided ventilation (it only has the lower entrance). The movements of the airflow were shown in Section 2.5 (Home Layout). The home profiling of the bungalow and terrace houses (i.e., Façade 1, Façade 2, Façade 3, and Façade 4) drawn by using the Microsoft Word Software.
The instruments were placed at the living room centre and followed the ICOP on indoor air quality guidelines10. The one minute average data recorded three (3) hours for each session (i.e., N= 3 x 60 minutes; N=180). However, when the instruments delay to fully stabilised (i.e., N< 180), the data recorded was late. The monitoring schedule of the bungalow and terrace houses is as shown in Table 1. All of the home activities were recorded based on the time. Upon completing the monitoring, the Origin Pro Software plot all the graphs.
Table 1: Sampling Schedule and Exampled of Home Activities in the Bungalow and Terrace Houses.
|
Session |
Activities |
Parameters Monitored |
|
Session 1: Morning (6.00 a.m. – 9.00 a.m.) Session 2: Morning-evening (11.00 a.m. – 2.00 p.m.) Session 3: Evening-night (5.00 p.m. – 8.00 p.m.) |
|
CO, CO2, O3,TVOC, CH2O, PM10,T, RH, & AS |
|
||
|
c) Gathering |
||
|
d) Going to work by motorcycle e) Sweeping |
Monitoring IAQ for Different Ventilation Approaches at the Terrace House
The IAQ monitoring (i.e., CO, CO2, O3, TVOC, & PM10) continues at the terrace house for different ventilation approaches to measure indoor air quality and study the effects of cooking on different ventilation approaches. The experiments have three conditions; 1) without any ventilation (i.e., windows, door, fan and ventilator are closed); 2) the combination of mechanical and natural ventilation (i.e., windows, door, fan and ventilator opened); 3) mechanical ventilation only (i.e., the fan on; extractor on), natural ventilation only (i.e., the door opened; the windows opened). The cooking activities (i.e., frying egg) were carried out for 10 minutes each, and when the IAQ parameters were back to baseline level, the next session starts. The amount and type of food and oil used for frying the egg are the same for each session. Table 2 shows cooking activities with the different ventilation approaches for each session.
Table 2: The Cooking Activities with the Different Ventilation Approaches.
|
Time |
Types of Ventilation Approaches |
Parameters Monitored |
|
|
Session 1 |
CO, CO2, O3, TVOC, CH2O, PM10 |
|
09:30 – 14:30 |
- Without any ventilation |
|
|
09:40 – 09:50 |
- Cooking (i.e., frying egg) |
|
|
|
Session 2 |
|
|
14:30 – 15:30 |
- Combination of mechanical and natural ventilation |
|
|
14:40 – 14:50 |
- Cooking (i.e., frying egg) |
|
|
|
Session 3 |
|
|
15:30 – 18.30 |
- Mechanical ventilation (Opened fan only) |
|
|
15:40 – 15:50 |
- Cooking (i.e., frying egg) |
|
|
|
Session 4 |
|
|
09:30 – 10:00 |
- Mechanical ventilation (Opened ventilator only) |
|
|
09:40 – 09:50 |
- Cooking (i.e., frying egg) |
|
|
|
Session 5 |
|
|
10:00 – 12:00 |
- Natural ventilation (Opened door only) |
|
|
10:10 – 10:20 |
- Cooking (i.e., frying egg) |
|
|
|
Session 6 |
|
|
12:00 – 14:00 |
- Natural ventilation (Opened window only) |
|
|
12:10 – 12:20 |
- Cooking (i.e., frying egg) |
Home Layout
The home layout of bungalow and terrace houses were divided into 4 (four) facades which are Façade 1, Façade 2, Façade 3, and Façade 4. The plan layouts of bungalows and terrace houses are shown in Figure 1. The bungalow house has a dimension of an area of 46.525 m2 and a volume of 151.202 m3, which is about the double space of the terrace house, with an area of 18.997 m2 and a volume of 58.055 m3. The bungalow house has the lower and upper openings (i.e., windows at Façade 2 and Façade 4), allowing the stack and cross ventilation to occur. Meanwhile, the terrace house has only a bigger window at the Façade 3, allowing one-sided ventilation.
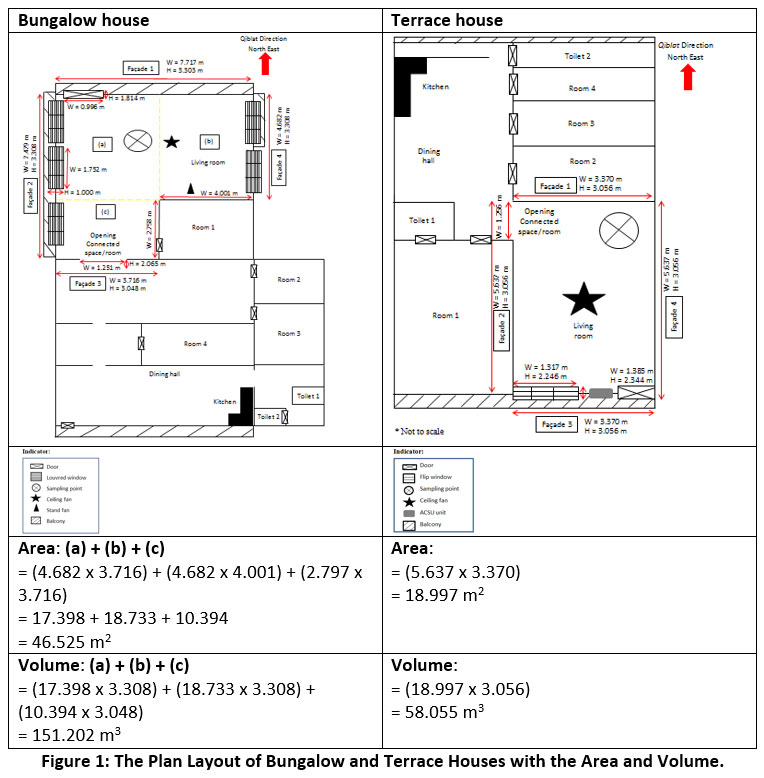 |
Figure 1: The Plan Layout of Bungalow and Terrace Houses with the Area and Volume. Click here to view Figure |
The home profiling and the illustrations movements of the outdoor air penetrate indoor and going back through outdoor for the bungalow and terrace houses are shown in Figure 2. The bungalow house has a stack and cross ventilation, whereas the terrace house has single-sided ventilation. Meanwhile, Table 3 shows the area, glass area, and window to wall ratio (WWR) for each façade for both houses. The bungalow house has a glass area at the Façades 2 and 4, totalling 22.45 % and 14.66 % of WWR, respectively. The terrace house only has the 28.72 % of WWR at the Façade 3.
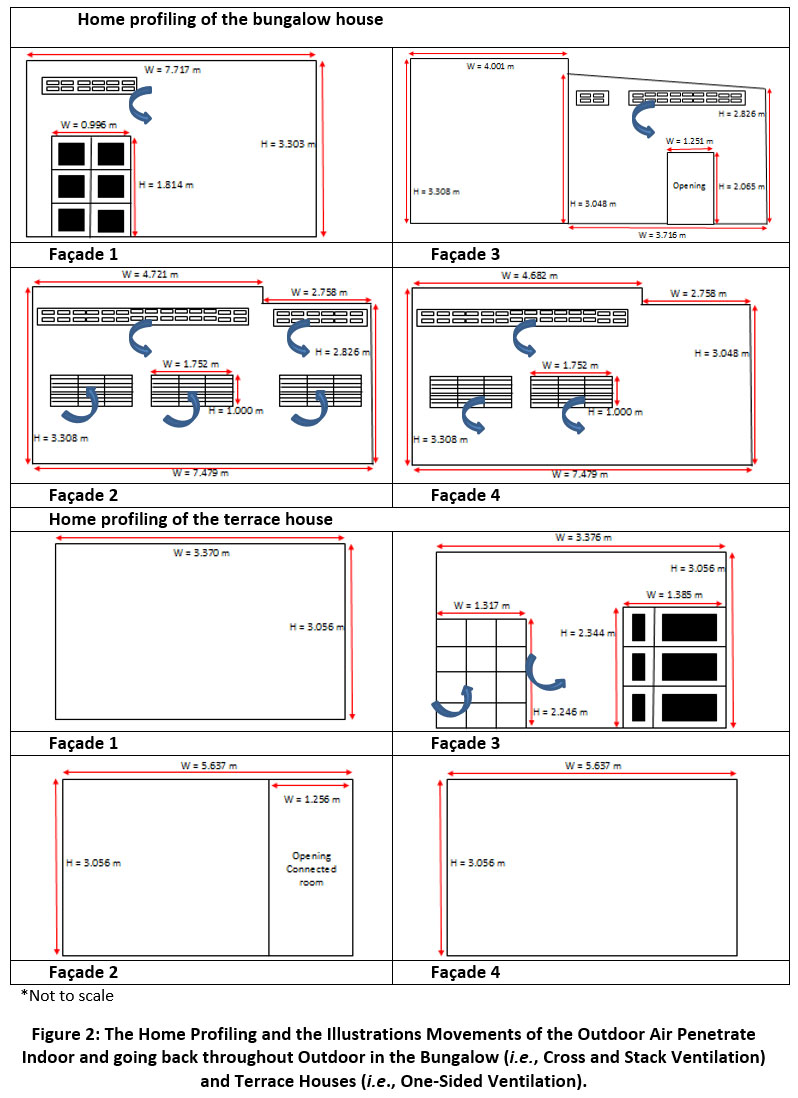 |
Figure 2: The Home Profiling and the Illustrations Movements of the Outdoor Air Penetrate Indoor and going back throughout Outdoor in the Bungalow (i.e., Cross and Stack Ventilation) and Terrace Houses (i.e., One-Sided Ventilation). Click here to view Figure |
Table 3: The Area, Glass Area, and Window to Wall Ratio (WWR) for each Façade for the Bungalow and Terrace Houses.
|
Façade |
Façade 1 |
Façade 2 |
Façade 3 |
Façade 4 |
|
|
Home profiling of the bungalow house (Availability of stack and cross ventilation) |
|||
|
Area |
= 7.717 x 3.303 |
= (4.721 x 3.308) + (2.758 x 2.826) |
= ½ x (3.048 + 2.826) x (3.716) + (3.308 x 4.001) |
= (4.682 x 3.308) + (2.758 x 3.048) |
|
Glass area |
= 0 m2 |
= (1.752 x 1.000) x 3 |
= 0 m2 |
= (1.752 x 1.000) x 2 |
|
WWR |
= 0% |
= (5.256/23.411) x 100 |
= 0 % |
= (3.504/23.894) x 100 |
|
Home profiling of the terrace house (Availability of one-sided ventilation) |
||||
|
Area |
= 3.370 x 3.056 |
= 5.637 x 3.056 |
= 3.370 x 3.056 |
= 5.637 x 3.056 |
|
Glass area |
= 0 m2 |
= 0 m2 |
= 1.317 x 2.246 m2 |
= 0 m2 |
|
WWR |
= 0% |
= 0% |
= (2.958/10.299) x 100 |
= 0% |
Results and Discussion
Indoor Air Contaminant
Table 4 shows that the obtained results of indoor air quality for specific physical parameters (T, RH, & AS), chemical air contaminants (TVOC, O3, CO, PM10, and CH2O), and ventilation performance indicator (CO2) of the bungalow house for the morning session, morning-evening session, and evening-night session on Day 1. For specific physical parameters, the mean temperature for all the sessions exceeded the recommended acceptable limit of ICOP (23-26°C), whereas relative humidity was within the allowable limit of ICOP (40-70 %). Meanwhile, the means of airspeed were below than acceptable limit of the ICOP (0.15-0.5 m/s). Besides that, the mean for chemical air contaminants (TVOC, O3, CO, PM10, and CH2O) and ventilation performance indicator (CO2) were within the acceptable limit of ICOP.
Table 4: Descriptive Analysis of the Specific Physical Parameters, Chemical Air Contaminants, and Ventilation Performance Indicator of the Bungalow House in the Morning Session, Morning-Evening Session, and the Evening-Night Session on Day 1.
|
Morning Session |
|||||
|
|
N total |
Mean ± SD |
Minimum |
Maximum |
ICOP Limit |
|
|
Specific Physical Parameters |
||||
|
Temperature (°C) |
164 |
26.71 ± 0.30 |
26.20 |
27.30 |
23 – 26 |
|
Relative Humidity (%) |
164 |
66.41 ± 1.06 |
64.80 |
68.90 |
40 – 70 |
|
Air Speed (m/s) |
164 |
0.02 ± 0.02 |
0.00 |
0.14 |
0.15 - 0.5 |
|
|
Chemical Air Contaminants |
||||
|
TVOC (ppb) |
164 |
431.04 ± 34.50 |
396.00 |
712.00 |
3000 |
|
Ozone (ppm) |
164 |
0.00 ± 0.00 |
0.00 |
0.00 |
0.05 |
|
Carbon Monoxide (ppm) |
164 |
0.57 ± 0.15 |
0.40 |
2.10 |
10 |
|
PM 10 (µg/m3) |
163 |
32.80 ± 12.44 |
20.44 |
52.68 |
150 |
|
Formaldehyde (ppb) |
170 |
1.04 ± 0.19 |
1.00 |
2.00 |
100 |
|
|
Ventilation Performance Indicator |
||||
|
Carbon Dioxide (ppm) |
164 |
476.38 ± 15.85 |
444.00 |
526.00 |
1000 |
|
Morning-Evening Session |
|||||
|
|
N total |
Mean |
Minimum |
Maximum |
|
|
|
Specific Physical Parameters |
||||
|
Temperature (°C) |
180 |
31.22 ± 0.89 |
29.70 |
32.70 |
23 – 26 |
|
Relative Humidity (%) |
180 |
54.68 ± 2.23 |
50.80 |
58.90 |
40 – 70 |
|
Air Speed (m/s) |
180 |
0.06 ± 0.04 |
0.01 |
0.16 |
0.15 - 0.5 |
|
|
Chemical Air Contaminants |
||||
|
TVOC (ppb) |
180 |
439.70 ± 13.19 |
417.00 |
471.00 |
3000 |
|
Ozone (ppm) |
180 |
0.01 ± 0.01 |
0.00 |
0.02 |
0.05 |
|
Carbon Monoxide (ppm) |
180 |
0.51 ± 0.05 |
0.40 |
0.70 |
10 |
|
PM 10.0 (µg/m3) |
180 |
27.25 ± 6.09 |
21.63 |
40.70 |
150 |
|
Formaldehyde (ppb) |
180 |
1.07 ± 0.26 |
1.00 |
2.00 |
100 |
|
|
Ventilation Performance Indicator |
||||
|
Carbon Dioxide (ppm) |
180 |
479.06 ± 22.18 |
448.00 |
541.00 |
1000 |
|
Evening-Night Session |
|||||
|
|
N total |
Mean |
Minimum |
Maximum |
|
|
|
Specific Physical Parameters |
||||
|
Temperature (°C) |
180 |
31.55 ± 0.47 |
30.70 |
32.30 |
23 – 26 |
|
Relative Humidity (%) |
180 |
58.23 ± 1.52 |
55.20 |
60.30 |
40 – 70 |
|
Air Speed (m/s) |
180 |
0.02 ± 0.02 |
0.00 |
0.08 |
0.15 - 0.5 |
|
|
Chemical Air Contaminants |
||||
|
TVOC (ppb) |
180 |
507.25 ± 17.55 |
464.00 |
554.00 |
3000 |
|
Ozone (ppm) |
180 |
0.02 ± 0.00 |
0.01 |
0.03 |
0.05 |
|
Carbon Monoxide (ppm) |
180 |
0.68 ± 0.21 |
0.40 |
1.50 |
10 |
|
PM 10.0 (µg/m3) |
180 |
83.20 ±41.66 |
36.50 |
152.84 |
150 |
|
Formaldehyde (ppb) |
180 |
1.00 ± 0.00 |
1.00 |
1.00 |
100 |
|
|
Ventilation Performance Indicator |
||||
|
Carbon Dioxide (ppm) |
180 |
510.63 ± 10.08 |
497.00 |
538.00 |
1000 |
Meanwhile, Figure 3 shows the fluctuations of indoor air contaminants of the bungalow house in the morning session, morning-evening session, and evening-night session on Day 1. In the morning session, the TVOC concentration increased to about 712 ppb because of the heating food, the CO and TVOC concentrations also increased because of the exhaust from the motorcycle, and the PM10 concentration also was slightly increased because of the sweeping activity indoors. In the morning-evening session, the CO2 concentration increased somewhat at 1300 hours because the occupants (5-6 people) were gathered in the living room to watch the television. Meanwhile, in the evening-night session, there was indoor cooking activity at about 17:30 hours. From the observation, the PM10, TVOC and CO concentrations increased after the cooking activities. This finding supports Rumchev et al. 1 who stated that cooking activities might influence the worst indoor air contaminants. The increased and persisted indoor air contaminants (i.e., HONO) might be because of the slow desorption from indoor surface reservoirs26.
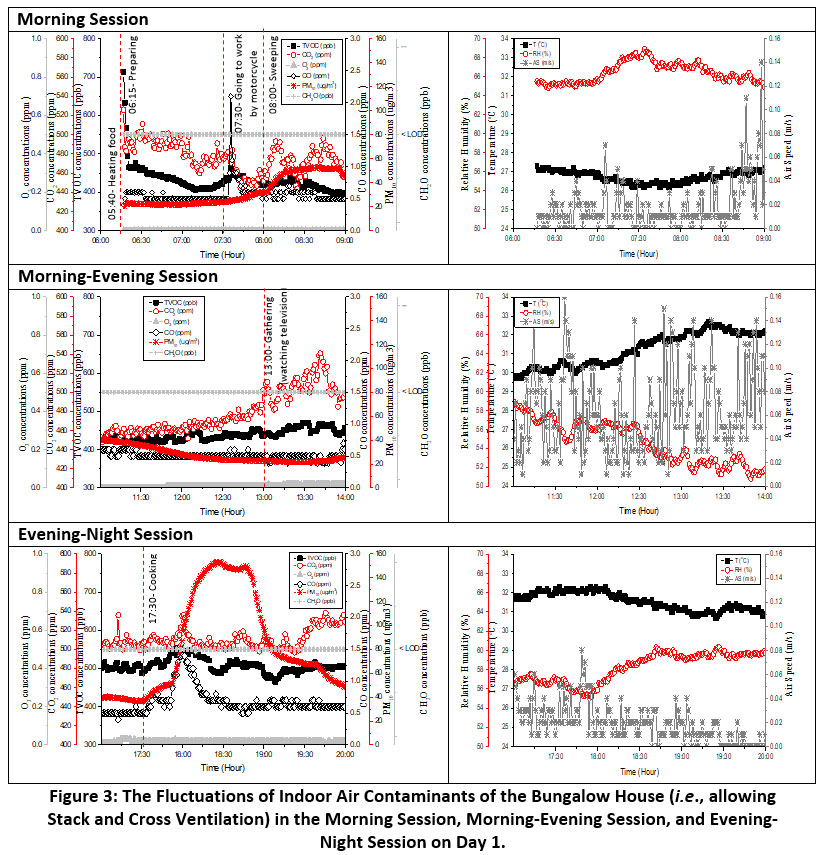 |
Figure 3: The Fluctuations of Indoor Air Contaminants of the Bungalow House (i.e., allowing Stack and Cross Ventilation) in the Morning Session, Morning-Evening Session, and Evening-Night Session on Day 1. Click here to view Figure |
Tables 5, 6, and 7 show the descriptive analysis of the specific physical parameters, chemical air contaminants, and ventilation performance indicator of the terrace house in the morning session, morning-evening session, and evening-night session on Day 1 Day 2, and Day 3, respectively. The mean temperature of the specific physical parameters for all the sessions on Day 1, Day 2, and Day 3 were exceeded the recommended acceptable limit of ICOP (23-26 °C), whereas relative humidity was within the acceptable limit of ICOP (40-70 %). The means airspeeds were below than acceptable limit of the ICOP (0.15-0.5 m/s). Besides that, the mean for chemical air contaminants (TVOC, CO, PM10, and CH2O) and ventilation performance indicator (CO2) on Day 1, Day 2, and Day 3 were within the acceptable limit of ICOP except for O3 concentrations at Day 2 in the evening-night session (0.08 ppm) and Day 3 in the morning-evening (0.069 ppm) and evening night sessions (0.07 ppm), respectively.
Table 5: Descriptive Analysis of the Specific Physical Parameters, Chemical Air Contaminants, and Ventilation Performance Indicator of the Terrace House in the Morning Session, Morning-Evening Session, and Evening-Night Session on Day 1.
|
Morning Session |
|||||
|
|
N total |
Mean ± SD |
Minimum |
Maximum |
ICOP Limit |
|
|
Specific Physical Parameters |
||||
|
Temperature (°C) |
145 |
28.03 ± 0.36 |
27.20 |
28.80 |
23 – 26 |
|
Relative Humidity (%) |
145 |
68.15 ±0.45 |
64.90 |
69.10 |
40 – 70 |
|
Air Speed (m/s) |
145 |
0.11 ± 0.03 |
0.04 |
0.18 |
0.15 - 0.5 |
|
|
Chemical Air Contaminants |
||||
|
TVOC (ppb) |
145 |
465.39 ± 28.74 |
430 |
546.00 |
3000 |
|
Ozone (ppm) |
145 |
0.01 ± 0.00 |
0.00 |
0.02 |
0.05 |
|
Carbon Monoxide (ppm) |
145 |
0.66 ± 0.16 |
0.40 |
1.50 |
10 |
|
PM 10.0 (µg/m3) |
145 |
48.06 ± 6.51 |
32.17 |
56.69 |
150 |
|
Formaldehyde (ppb) |
145 |
1.00 ± 0.00 |
1.00 |
1.00 |
100 |
|
|
Ventilation Performance Indicator |
||||
|
Carbon Dioxide (ppm) |
145 |
529.46 ± 69.98 |
452 |
755.00 |
1000 |
|
Morning-Evening Session |
|||||
|
|
N total |
Mean |
Minimum |
Maximum |
|
|
|
Specific Physical Parameters |
||||
|
Temperature (°C) |
180 |
29.87 ± 0.48 |
28.60 |
30.50 |
23 – 26 |
|
Relative Humidity (%) |
180 |
62.36 ± 1.66 |
59.90 |
66.10 |
40 – 70 |
|
Air Speed (m/s) |
180 |
0.11 ± 0.03 |
0.04 |
0.22 |
0.15 - 0.5 |
|
|
Chemical Air Contaminants |
||||
|
TVOC (ppb) |
180 |
423.07 ± 9.50 |
399.00 |
440.00 |
3000 |
|
Ozone (ppm) |
180 |
0.03 ± 0.01 |
0.02 |
0.05 |
0.05 |
|
Carbon Monoxide (ppm) |
180 |
0.36 ± 0.05 |
0.30 |
0.50 |
10 |
|
PM 10.0 (µg/m3) |
180 |
43.49 ± 3.66 |
38.56 |
48.30 |
150 |
|
Formaldehyde (ppb) |
180 |
1.07 ± 0.26 |
1.00 |
2.00 |
100 |
|
|
Ventilation Performance Indicator |
||||
|
Carbon Dioxide (ppm) |
180 |
468.87 ± 11.03 |
447.00 |
514.00 |
1000 |
|
Evening-Night Session |
|||||
|
|
N total |
Mean |
Minimum |
Maximum |
|
|
|
Specific Physical Parameters |
||||
|
Temperature (°C) |
180 |
30.71 ± 0.15 |
30.30 |
30.90 |
23 – 26 |
|
Relative Humidity (%) |
180 |
62.27 ± 2.71 |
57.70 |
66.80 |
40 – 70 |
|
Air Speed (m/s) |
180 |
0.11 ± 0.03 |
0.04 |
0.22 |
0.15 - 0.5 |
|
|
Chemical Air Contaminants |
||||
|
TVOC (ppb) |
180 |
429.08 ±13.69 |
417.00 |
467.00 |
3000 |
|
Ozone (ppm) |
180 |
0.03 ±0.01 |
0.02 |
0.04 |
0.05 |
|
Carbon Monoxide (ppm) |
180 |
0.52 ±0.10 |
0.40 |
0.70 |
10 |
|
PM 10.0 (µg/m3) |
180 |
42.44 ±9.89 |
29.51 |
70.74 |
150 |
|
Formaldehyde (ppb) |
180 |
1.00 ± 0.00 |
1.00 |
1.00 |
100 |
|
|
Ventilation Performance Indicator |
||||
|
Carbon Dioxide (ppm) |
180 |
499.38 ±48.09 |
455.00 |
664.00 |
1000 |
Table 6: Descriptive Analysis of the Specific Physical Parameters, Chemical Air Contaminants, and Ventilation Performance Indicator of the Terrace House for the Morning Session, Morning-Evening Session, and Evening-Night Session on Day 2.
|
Morning Session |
|||||
|
|
N total |
Mean ± SD |
Minimum |
Maximum |
ICOP Limit |
|
|
Specific Physical Parameters |
||||
|
Temperature (°C) |
177 |
28.70 ± 0.46 |
27.70 |
29.40 |
23 – 26 |
|
Relative Humidity (%) |
177 |
66.60 ± 1.42 |
64.70 |
69.80 |
40 – 70 |
|
Air Speed (m/s) |
177 |
0.11 ± 0.03 |
0.04 |
0.22 |
0.15 - 0.5 |
|
|
Chemical Air Contaminants |
||||
|
TVOC (ppb) |
177 |
467.48 ±48.17 |
397.00 |
740.00 |
3000 |
|
Ozone (ppm) |
177 |
0.02 ±0.01 |
0.01 |
0.04 |
0.05 |
|
Carbon Monoxide (ppm) |
177 |
0.94 ±1.82 |
0.40 |
16.30 |
10 |
|
PM 10.0 (µg/m3) |
177 |
33.69 ±9.68 |
20.88 |
46.30 |
150 |
|
Formaldehyde (ppb) |
177 |
6.61 ± 1.41 |
1.00 |
7.00 |
100 |
|
|
Ventilation Performance Indicator |
||||
|
Carbon Dioxide (ppm) |
177 |
559.58 ±105.81 |
451.00 |
938.00 |
1000 |
|
Morning-Evening Session |
|||||
|
|
N total |
Mean |
Minimum |
Maximum |
|
|
|
Specific Physical Parameters |
||||
|
Temperature (°C) |
180 |
30.70 ± 0.64 |
29.40 |
32.00 |
23 – 26 |
|
Relative Humidity (%) |
180 |
61.87 ±1.66 |
57.30 |
64.20 |
40 – 70 |
|
Air Speed (m/s) |
180 |
0.11 ±0.03 |
0.04 |
0.22 |
0.15 - 0.5 |
|
|
Chemical Air Contaminants |
||||
|
TVOC (ppb) |
180 |
423.33 ± 81.08 |
376.00 |
747.00 |
3000 |
|
Ozone (ppm) |
180 |
0.03 ± 0.01 |
0.02 |
0.07 |
0.05 |
|
Carbon Monoxide (ppm) |
180 |
0.75 ± 0.79 |
0.40 |
3.90 |
10 |
|
PM 10.0 (µg/m3) |
180 |
43.21 ± 10.49 |
33.37 |
76.92 |
150 |
|
Formaldehyde (ppb) |
180 |
1.07 ± 0.26 |
1.00 |
2.00 |
100 |
|
|
Ventilation Performance Indicator |
||||
|
Carbon Dioxide (ppm) |
180 |
511.83 ± 48.66 |
447.00 |
697.00 |
1000 |
|
Evening-Night Session |
|||||
|
|
N total |
Mean |
Minimum |
Maximum |
|
|
|
Specific Physical Parameters |
||||
|
Temperature (°C) |
180 |
31.31 ± 0.37 |
30.90 |
32.50 |
23 – 26 |
|
Relative Humidity (%) |
180 |
65.01 ± 3.56 |
56.60 |
71.70 |
40 – 70 |
|
Air Speed (m/s) |
180 |
0.11 ± 0.03 |
0.04 |
0.22 |
0.15 - 0.5 |
|
|
Chemical Air Contaminants |
||||
|
TVOC (ppb) |
180 |
967.61 ± 1058.88 |
404.00 |
4339.00 |
3000 |
|
Ozone (ppm) |
180 |
0.08 ±0.06 |
0.04 |
0.33 |
0.05 |
|
Carbon Monoxide (ppm) |
180 |
1.91 ±2.49 |
0.50 |
11.60 |
10 |
|
PM 10.0 (µg/m3) |
180 |
89.67 ±85.07 |
42.94 |
341.30 |
150 |
|
Formaldehyde (ppb) |
180 |
1.59 ± 1.46 |
1.00 |
7.00 |
100 |
|
|
Ventilation Performance Indicator |
||||
|
Carbon Dioxide (ppm) |
180 |
608.05 ±267.57 |
461.00 |
1741.00 |
1000 |
Table 7: Descriptive Analysis of the Specific Physical Parameters, Chemical Air Contaminants, and Ventilation Performance Indicator of the Terrace House for the Morning Session, Morning-Evening Session, and Evening-Night Session on Day 3.
|
Morning Session |
|||||
|
|
N total |
Mean ± SD |
Minimum |
Maximum |
ICOP Limit |
|
|
Specific Physical Parameters |
||||
|
Temperature (°C) |
180 |
29.37 ± 0.21 |
28.60 |
29.80 |
23 – 26 |
|
Relative Humidity (%) |
180 |
67.37 ± 2.53 |
64.60 |
71.90 |
40 – 70 |
|
Air Speed (m/s) |
180 |
0.11 ± 0.03 |
0.04 |
0.22 |
0.15 - 0.5 |
|
|
Chemical Air Contaminants |
||||
|
TVOC (ppb) |
180 |
1077.63 ± 1062.20 |
436.00 |
5101.00 |
3000 |
|
Ozone (ppm) |
180 |
0.04 ±0.04 |
0.01 |
0.12 |
0.05 |
|
Carbon Monoxide (ppm) |
180 |
2.48 ±2.63 |
0.50 |
8.10 |
10 |
|
PM 10.0 (µg/m3) |
180 |
9.59 ±6.65 |
4.72 |
23.37 |
150 |
|
Formaldehyde (ppb) |
180 |
1.09 ±0.41 |
1.00 |
3.00 |
100 |
|
|
Ventilation Performance Indicator |
||||
|
Carbon Dioxide (ppm) |
180 |
807.27 ±134.93 |
554.00 |
1132.00 |
1000 |
|
Morning-Evening Session |
|||||
|
|
N total |
Mean |
Minimum |
Maximum |
|
|
|
Specific Physical Parameters |
||||
|
Temperature (°C) |
180 |
31.42 ± 0.76 |
30.10 |
32.70 |
23 – 26 |
|
Relative Humidity (%) |
180 |
65.04 ± 2.19 |
60.40 |
69.10 |
40 – 70 |
|
Air Speed (m/s) |
180 |
0.11 ± 0.03 |
0.04 |
0.22 |
0.15 - 0.5 |
|
|
Chemical Air Contaminants |
||||
|
TVOC (ppb) |
180 |
1121.79 ± 1069.17 |
415.00 |
5938.00 |
3000 |
|
Ozone (ppm) |
180 |
0.069 ± 0.04 |
0.02 |
0.17 |
0.05 |
|
Carbon Monoxide (ppm) |
180 |
2.689 ±2.13 |
0.50 |
8.00 |
10 |
|
PM 10.0 (µg/m3) |
180 |
20.06 ± 19.44 |
8.53 |
78.13 |
150 |
|
Formaldehyde (ppb) |
180 |
1.07 ± 0.26 |
1.00 |
2.00 |
100 |
|
|
Ventilation Performance Indicator |
||||
|
Carbon Dioxide (ppm) |
180 |
729.339 ± 135.21 |
535.00 |
1110.00 |
1000 |
|
Evening-Night Session |
|||||
|
|
N total |
Mean |
Minimum |
Maximum |
|
|
|
Specific Physical Parameters |
||||
|
Temperature (°C) |
180 |
31.85 ± 0.24 |
31.40 |
32.50 |
23 – 26 |
|
Relative Humidity (%) |
180 |
61.06 ±1.02 |
58.50 |
63.60 |
40 – 70 |
|
Air Speed (m/s) |
180 |
0.11 ±0.03 |
0.04 |
0.22 |
0.15 - 0.5 |
|
|
Chemical Air Contaminants |
||||
|
TVOC (ppb) |
180 |
1651.33 ±2996.72 |
401.00 |
14539.00 |
3000 |
|
Ozone (ppm) |
180 |
0.07 ±0.04 |
0.03 |
0.19 |
0.05 |
|
Carbon Monoxide (ppm) |
180 |
2.66 ±4.03 |
0.30 |
17.00 |
10 |
|
PM 10.0 (µg/m3) |
180 |
90.75 ±13.12 |
65.63 |
106.48 |
150 |
|
Formaldehyde (ppb) |
180 |
1.00 ± 0.00 |
1.00 |
1.00 |
100 |
|
|
Ventilation Performance Indicator |
||||
|
Carbon Dioxide (ppm) |
180 |
729.18 ±299.61 |
479.00 |
1501.00 |
1000 |
Figures 4, 5, and 6 show the fluctuations of indoor air contaminants of the terrace house in the morning, morning-evening, and evening-night sessions on Day 1, Day 2, and Day 3, respectively. From the observation, cooking was the significant activity in the terrace house that contributed to high TVOC, CO2, CO, O3, and PM10 concentrations on Day 1, Day 2, and Day 3.
In the morning session on Day 1, the CO2 concentrations were high at 0630 hours because during that time, and the occupants were preparing for Morning Prayer. In the morning-evening session, the sweeping activity did not contribute to the increases in indoor air contaminants. Meanwhile, in the evening-night session, the cooking activity increased CO2, PM10, TVOC, and CO concentrations. However, the maximum concentrations of indoor air contaminants on Day 1 did not exceed the recommended ICOP limit.
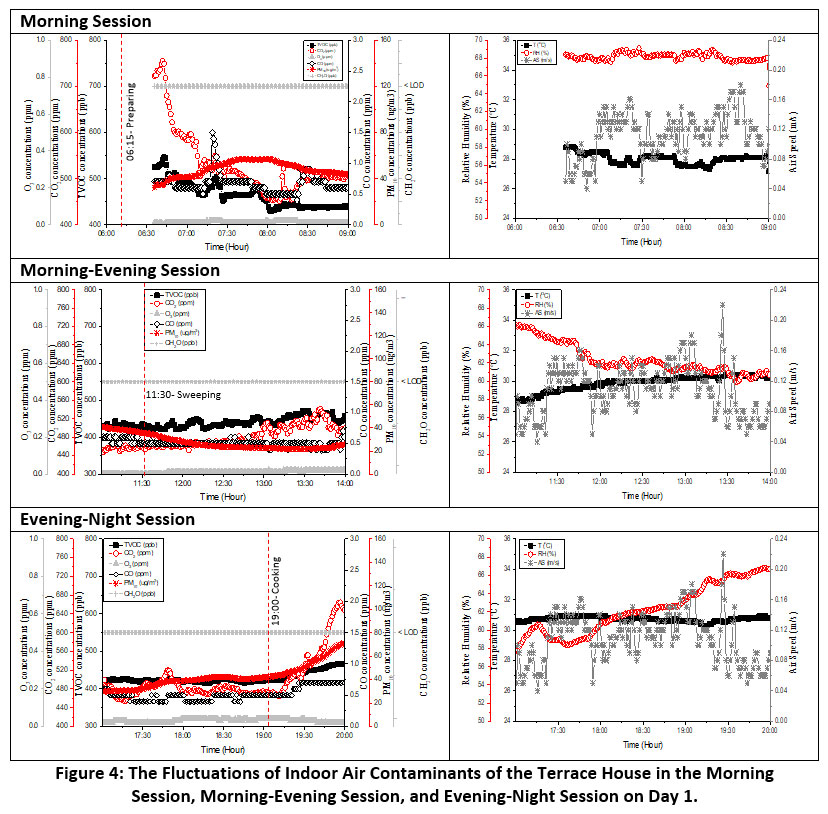 |
Figure 4: The Fluctuations of Indoor Air Contaminants of the Terrace House in the Morning Session, Morning-Evening Session, and Evening-Night Session on Day 1. Click here to view Figure |
The maximum concentration of CO (16.30 ppm) and O3 (0.07 ppm) on Day 2 were exceeded the ICOP limit at 10 ppm and 0.05 ppm in the morning and morning-evening sessions, respectively, due to the cooking activities. Meanwhile, in the evening-night session, the TVOC (4339.00 ppb), O3 (0.33 ppm), CO (11.6 ppm), PM10 (341.30 µg/m3), and CO2 (1741.00 ppm) concentrations were also exceeded the acceptable limit of 3000 ppb, 0.05 ppm, 10 ppm, 150 µg/m3, and 1000 ppm respectively because of the cooking activities.
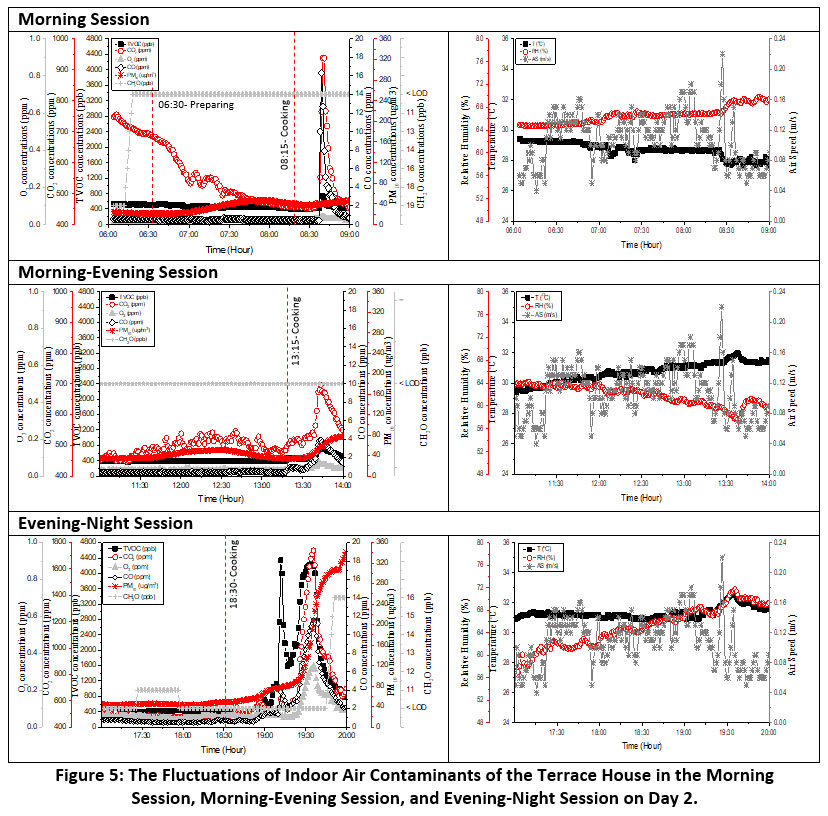 |
Figure 5: The Fluctuations of Indoor Air Contaminants of the Terrace House in the Morning Session, Morning-Evening Session, and Evening-Night Session on Day 2. Click here to view Figure |
Besides that, on Day 3, the TVOC, O3, and CO2 concentrations were exceeded the recommended acceptable limit of ICOP in the morning and morning-evening sessions. TVOC concentrations were exceeded the recommended ICOP limit at 5101.00 ppm, O3 at 0.12 ppm, CO2 at 1132.00 ppm in the morning session, whereas TVOC at 5938.00 ppm, O3 at 0.17 ppm, and CO2 at 1110.00 ppm in the morning-evening session. Meanwhile, in the evening-night session, the TVOC (14539.00 ppb), O3 (0.19 ppm), CO (17.00 ppm), and CO2 (1501.00 ppm) concentrations also were exceeded the acceptable recommended ICOP limit. The exceeded maximum concentration of the indoor air contaminants in the morning, morning-evening, and evening-night sessions were due to the cooking activities inside the terrace house (i.e., single sided ventilation).
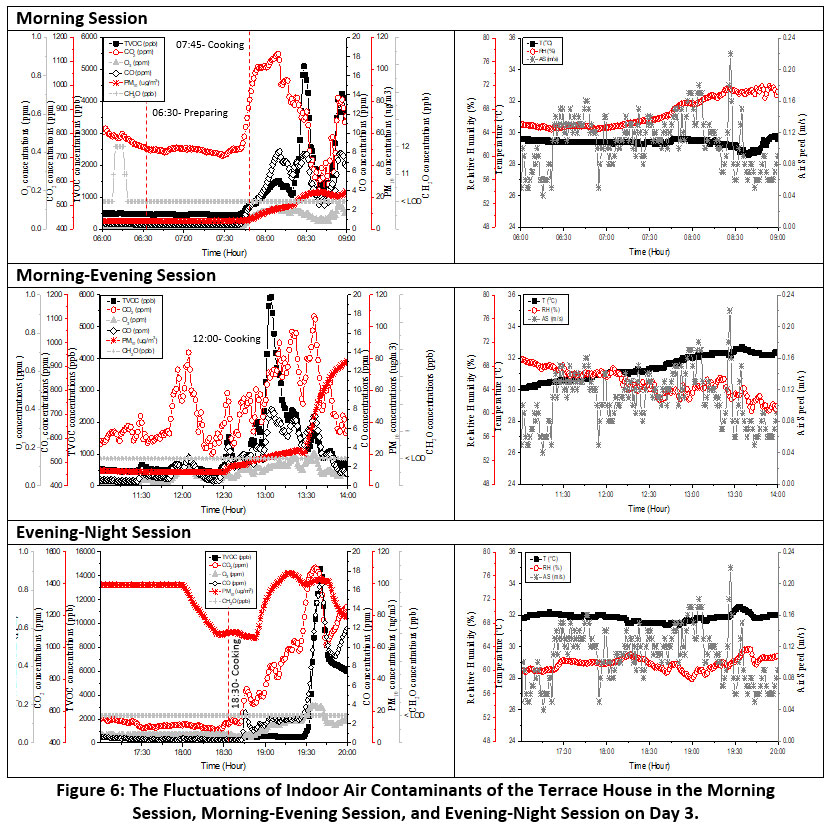 |
Figure 6: The Fluctuations of Indoor Air Contaminants of the Terrace House in the Morning Session, Morning-Evening Session, and Evening-Night Session on Day 3. Click here to view Figure |
From the result obtained, indoor activities (i.e., praying, cooking, gathering to watch television, and sweeping) and outdoor activity (i.e., exhaust from the motorcycle) could increase the indoor air contaminants in the bungalow and terrace houses. However, cooking activities were the primary and significant activities that contributed to the highest of indoor air contaminants, and they exceeded the recommended ICOP limit compared to others activities. The cooking activities increased TVOC, CO, O3, PM10, and CO2 concentrations inside the house. The high IAQ concentration is influenced by the cooking's types (i.e., frying, boiling & baking), insufficient ventilation system, the fuel’s types, the devices’ cook, and cooking material6, 27. In this study, the particulate matter in the evening-night session on Day 2 had exceeded the ICOP limit and increased about 3.8 times during the cooking activities. This result was similar to See and Balasubramanian28, which had found that the stir-frying activity increased the particulate matter concentration about 3.7 times. The particulate matter and volatile organic compounds (VOCs) from the cooking emissions may contribute to the harmful health effects29.
Besides that, it shows that the insufficient ventilation system in the terrace house (i.e., single-sided ventilation) because the CO2 exceeded the ICOP limit on Day 2 at 74.1 % (evening-night session) and Day 3 at 13.2 % (morning session), 11% (morning-evening session), and 50.1 % (evening-night session). CO2 concentrations that represented the ventilation performance indicator showed that the cooking activities worsen the ventilation indoor. Hesaraki et al.18 also found that the lack of ventilation rate in the indoor buildings might cause high IAQ.
Moreover, although the air movements were lower than the recommended acceptable limit of ICOP (0.15-0.5 m/s) for both bungalow and terrace houses, the cooking activities contributed the higher indoor air contaminants (i.e., TVOC, CO, O3, and PM10 concentrations) in the terrace house compared to the bungalow house. The indoor air contaminants in the terrace house were exceeded the acceptable limit of ICOP, whereas the bungalow house did not. This could be due to: 1) the bungalow house has the application of the stack and cross ventilation which might promote outdoor air to replace with the indoor air quickly compared to the application of the single sided ventilation in the terrace house; 2) the double area (46.525 m2) of the bungalow house compared to the terrace house (18.997 m2), and 3) the long pathway of indoor air contaminants from the cooking area to the living room in the bungalow house compared to the terrace house (refer Figure 2).
Figure 7 shows the fluctuation of indoor air contaminants influenced by the cooking activities with different ventilation approaches in the terrace house (i.e., single sided ventilation). The results prove that the cooking activities increased the TVOC, CO2, O3, CO and PM10 concentrations. The results showed that the indoor air contaminants take the longest (5 hours) to disperse to the basic level with the ventilation approach without ventilation (i.e., windows, door, fan, and ventilator are closed). Meanwhile, the mechanical ventilation (i.e., opened fan only) take 3 hours longer to disperse, followed by 2 hours of the natural ventilation only (i.e., opened door only; opened windows only), and followed by 1 hour of the combination of mechanical and natural ventilation (i.e., windows, door, fan, and ventilator on). Despite that, using a ventilator that can directly suck off the indoor air contaminants from the cooking activities was the best way because it only takes 30 minutes to disperse. However, not all houses provide a ventilator.
Therefore, the combination of mechanical and natural ventilation was the best way to remove the indoor air contaminants (i.e., TVOC, CO2, O3, CO and PM10) quickly with the condition of the lack of air movement inside the dwelling area. Besides that, a study by Gonzalez28 had also reported that natural ventilation is the most efficient system to control particles and CO2 concentrations produced by cooking activities compared to non-ventilation.
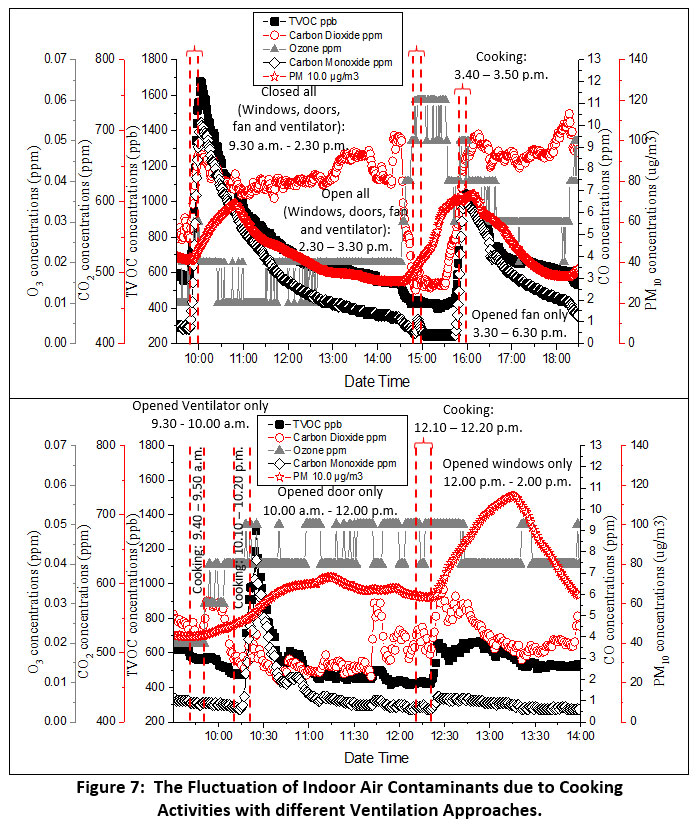 |
Figure 7: The Fluctuation of Indoor Air Contaminants due to Cooking Activities with different Ventilation Approaches. Click here to view Figure |
Thermal Comfort
Figure 8 shows the 10-minutes average of two indoor and two outdoor temperatures (i.e., indoor Qiblat, outdoor Qiblat, indoor opposite Qiblat, and outdoor opposite Qiblat) of the bungalow and terrace houses in the morning session, morning-evening session, and evening-night session.
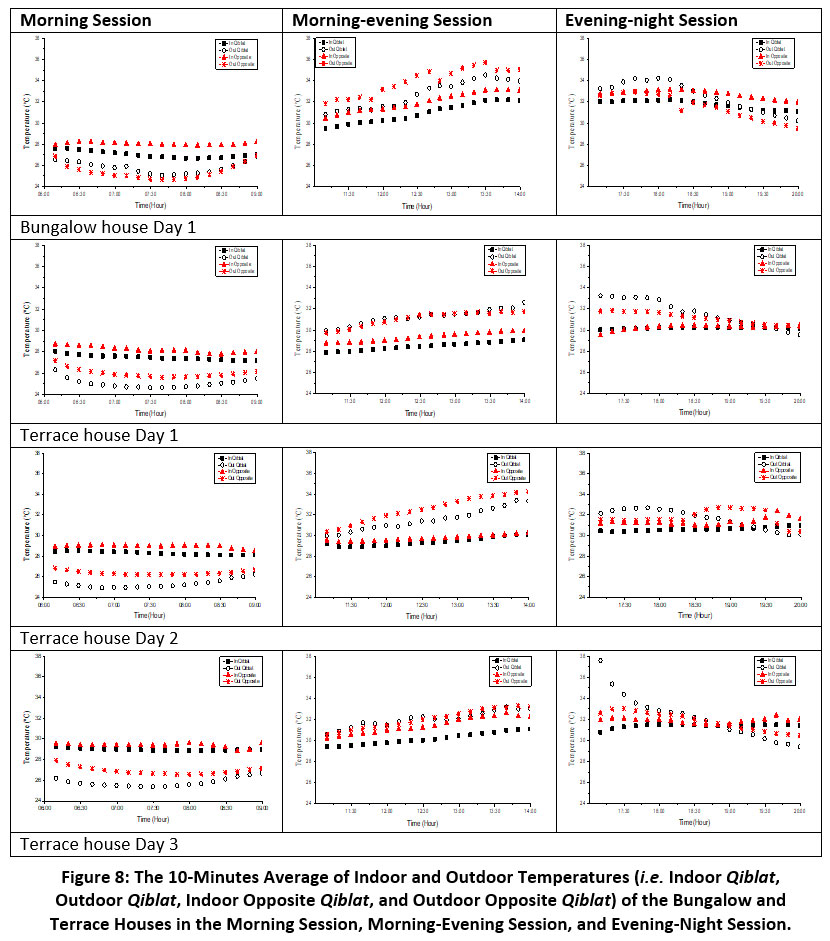 |
Figure 8: The 10-Minutes Average of Indoor and Outdoor Temperatures (i.e. Indoor Qiblat, Outdoor Qiblat, Indoor Opposite Qiblat, and Outdoor Opposite Qiblat) of the Bungalow and Terrace Houses in the Morning Session, Morning-Evening Session, and Evening-Night Session. Click here to view Figure |
The indoor temperatures (i.e., indoor Qiblat and opposite indoor Qiblat) at both bungalow and terrace houses were high than the outdoor temperatures (i.e. outdoor Qiblat and opposite outdoor Qiblat) in the morning session. Meanwhile, in the morning-evening session, the outdoor temperatures were higher than indoor temperatures. In the evening-night session, there were intersections between indoor temperatures and outdoor temperatures. From the observation, the outdoor temperatures were lowering; meanwhile, the indoor temperatures were beginning to increase in the bungalow house at 18:30 hours. The same pattern goes for the terrace house. The indoor temperatures start to increase, and the outdoor temperature starts to decrease at 19:00 hours. This could be the released of heat from the wall building due to the collected heat from the solar energy system. There were two types of solar energy systems31. The collected solar heat from the sun energy outside was transported into inside by mechanical devices is categorised as the active solar energy system. Meanwhile, collected solar heat based on the design, orientation, and building components (i.e., windows, walls, and floor) of the house could be considered the passive solar energy system. The wall surface temperature as high as the wall had absorbed more solar radiation from the solar energy system. The convection of the flux caused it due to increased air temperature in the sunspace and increased heat flux through the wall32.
The indoor mean temperature of the bungalow and terrace house in the morning session was 26.71 °C and 27.03-29.37 °C, respectively, in the morning-evening session were 31.22 °C and 29.87-31.42 °C, respectively, and in the evening-night session were 31.55 °C and 30.71-31.85 °C, respectively. The mean indoor temperatures of the bungalow and terrace houses were almost the same. However, the mean indoor temperature in the bungalow house was expected to lower because of the availability of the stack and cross ventilation compared to the terrace house (i.e., single sided ventilation). The high indoor temperature for both bungalow and terrace houses that exceeded the recommended ICOP limit could be due to: (1) high outdoor air temperature; and (2) lower indoor air movement inside the dwelling area.
Conclusion
This paper presents the impact of different types of ventilation between stack and cross ventilations (i.e., bungalow house) and one-sided ventilation (i.e., terrace house) on indoor activities in the high and humid country of Malaysia. The aim is to access the IAQ and indoor thermal comfort by the real-time monitoring technique. The obtained results found that the TVOC, CO, PM10, O3, and CO2 concentrations were highly increased during the indoor cooking activities for both different ventilations. The indoor air contaminants did not exceed the ICOP limit in the bungalow house (i.e., stack and cross ventilation). This might be due to the bungalow house's application of stack and cross ventilation (i.e., the air changing between upper and lower openings), double area, and long pathway of indoor air contaminants movements. Besides that, it is proved the lack of ventilation system (i.e., CO2 exceeded the ICOP limit) caused the temperatures were exceeded the ICOP limit of 23-26°C for both bungalow and terrace houses could be due to the lower indoor air movement, which less than the ICOP limit of 0.15-0.5 m/s and high outdoor air temperature. The combination of mechanical and natural ventilation (i.e., opened all doors, windows, fan) is the best way to apply in the house without a cooking ventilator, with lower indoor air movement to improve ventilation to achieve an acceptable IAQ and thermal comfort in the family house and can be studied for future research.
Acknowledgement
The personal EACAR funding has supported this research to carry out this work.
Funding Source
There is no funding or financial support for this research work.
Conflict of Interest
The authors agree that this research was conducted in the absence of any self-benefits, commercial or financial conflicts and declare absence of conflicting interests with the funders.
References
- Rumchev K., Zhao Y., Spickett J. Health Risk Assessment of Indoor Air Quality, Socioeconomic and House Characteristics on Respiratory Health Among Women and Children of Tirupur, South India. International Journal of Environmental Research and Public Health. 2017; 14(4): 429.
CrossRef - Indrie L., Oana D., Ilie? M., Ilie? D. C., Lincu A., Ilie? A., ... &Oana I. Indoor Air Quality of Museums and Conservation of Textiles Artworks. Case study: Salacia Museum House, Romania. Industria Textile. 2019. 70(1): 88-93.
- United States Department of Health and Human Services (USDHHS). The Health Consequences of Involuntary Exposure to Tobacco Smoke: A Report of the Surgeon General. Available online: https://health.gov/healthypeople/tools-action/browse-evidence-based-resources/health-consequences-involuntary-exposure-tobacco-smoke-report-surgeon-general (Accessed on 15 June 2021).
- Azuma K., Jinno H., Tanaka-Kagawa T., Sakai S. Risk Assessment Concepts and Approaches for Indoor Air Chemicals in Japan. International Journal of Hygiene and Environmental Health. 2020; 225: 1-9.
CrossRef - Bruce N., Perez-Padilla R., Albalak R. The Health Effects of In-Door Air Pollution Exposure in Developing Countries. World Health Organization: Geneva, Switzerland. 2002; 11.
- Nazli S. N. Analysis of the Effect of Cooking Activities and Ventilation System on IAQ and Perceived Symptoms among Workers at SMEs Food Industry. 2020. (Doctoral dissertation, Universiti Teknologi MARA).
- Lodhi M.A., Zain-al-Abdin A. Indoor Air Pollutants Produced from Fossil Fuel and Biomass. Energy Conversion and Management. 1999; 40(3):243-8.
CrossRef - Kumar R., Nagar J. K., Raj N., Kumar P., Kushwah A. S, Meena M., Gaur S. N. Impact of Domestic Air Pollution from Cooking Fuel on Respiratory Allergies in Children in India. Asian Pacific Journal of Allergy and Immunology. 2008; 26(4):213.
- Khalequzzaman M., Kamijima M., Sakai K., Hoque B. A., Nakajima T. Indoor Air Pollution and Children's Health In Biomass-and Fossil-Fuel Users of Bangladesh: A Situation in Two Different Seasons. Environmental Health and Preventive Medicine. 2010; 15(4):236.
CrossRef - Department of Occupational Safety and Health (DOSH). 2010; Malaysia's Industrial Code of Practice on Indoor Air Quality. Putrajaya: DOSH, Ministry of Human Resources
- Cichowicz R., Sabiniak H., &Wielgosi?ski G. The Influence of a Ventilation on the Level of Carbon Dioxide in a Classroom at a Higher University. EcolChemEng S. 2015;22(1): 61-71.
CrossRef - Mahyuddin N., Awbi H. A review of CO2 Measurement Procedures in Ventilation Research. International Journal of Ventilation. 2012; 10(4): 353-370.
CrossRef - NIOSH. National Institute for Occupational Safety and Health. ‘Indoor Air Quality Assessor’ [PowerPoint Presentation]. NIOSH-PDD-CS-IAQ. 2016.
- Dimitroulopoulou C. Ventilation in European dwellings: A review. Building and Environment, 2012; 47: 109-125.
CrossRef - Rasli N. B. I., Ramli N. A., Ismail M. R., Faizah N., Yusof F. M., Shith, S. ... Nazir A. U. M. Smoke Flow Visualisation Testing on Window Panel at Various Wind Speed and Pores: A Wind Tunnel Study. Journal of Sustainability Science and Management. 2019; 14(6): 51-64.
- Gupta D., Khare V. R. Natural Ventilation Design: Predicted and Measured Performance of a Hostel Building in Composite Climate of India. Energy and Built Environment. 2021; 2(1): 82-93.
CrossRef - Mysen M., Rydock J. P., Tjelflaat P. O. Demand Controlled Ventilation for Office Cubicles—Can it Be Profitable? Energy and Buildings. 2003; 35: 657–662.
CrossRef - Hesaraki A., Myhren J. A., Holmberg S. Influence of Different Ventilation Levels on Indoor Air Quality and Energy Savings: A Case Study of a Single-Family House. Sustainable Cities and Society. 2015; 19: 165-172.
CrossRef - Ng L., Poppendieck D., Dols W. S., Emmerich S. J. Evaluating Indoor Air Quality and Energy Impacts of Ventilation in a Net-Zero Energy House Using a Coupled Model. Science and Technology for The Built Environment. 2018; 24(2): 124-134.
CrossRef - Mao J. C., Gao N. P. The Airborne Transmission of Infection between Flats in High-Rise Residential Buildings: A Review. Building Environment. 2005; 94: 516–531.
CrossRef - Chindavanig T. Effectiveness of Stack Ventilation in a Two-Storey House in Hot and Humid Climate. In IOP Conference Series: Materials Science and Engineering.2019; 471(6). IOP Publishing.
CrossRef - Irving, S., Etheridge D., Ford. B. Natural Ventilation in Non-domestic Buildings CIBSE AM10. CIBSE. 2005; ISBN 1903287561.
- Mu D., Gao, N. P., Zhu T. Wind Tunnel Tests of Inter-Flat Pollutant Transmission Characteristics in a Rectangular Multi-Storey Residential Building, Part A: Effect of Wind Direction. Building Environment. 2016; 108: 159–170.
CrossRef - Mu D., Shu C., Gao N., Zhu T. Wind Tunnel Tests of Inter-Flat Pollutant Transmission Characteristics in a Rectangular Multi-Storey Residential Building, Part B: Effect of Source Location. Building and Environment. 2017; 114: 281-292.
CrossRef - Lai Y., Ridley I. A., Brimblecombe P. Effects of Neighboring Units on the Estimation of Particle Penetration Factor in a Modeled Indoor Environment. Urban Science. 2021; 5(2): 1-21.
CrossRef - Wang C., Bottorff B., Reidy E., Rosales C. M. F., Collins D. B., Novoselac A., ... Abbatt J. P. Cooking, Bleach Cleaning, and Air Conditioning Strongly Impact Levels of HONO in a House. Environmental Science & Technology. 2020; 54(21): 13488-13497.
CrossRef - Kim K. H., Pandey S. K., Kabir E., Susaya J., Brown R. J. The Modern Paradox of Unregulated Cooking Activities and Indoor Air Quality. Journal of Hazardous Materials. 2011; 195:1-0.
CrossRef - See S. W., Balasubramanian R. Physical Characteristics of Ultrafine Particles Emitted from Different Gas Cooking Methods. Aerosol Air Quality Res. 2006; 6(1):82-92.
CrossRef - Zeng J., Yu Z., Mekic M., Liu J., Li S., Loisel G., ... & Li X. Evolution of Indoor Cooking Emissions Captured by Using Secondary Electrospray Ionization High-Resolution Mass Spectrometry. Environmental Science & Technology Letters. 2020; 7(2): 76-81.
CrossRef - Gonzalez A., Boies A., Swanson J., Kittelson D. Measuring the Effect of Ventilation on Cooking in Indoor Air Quality by Low-Cost Air Sensors. International Journal of Environmental and Ecological Engineering. 2019; 13(9): 568-576.
- Price S., Holmes L., Denner S. Passive solar heating--residential. 1981.
- Mottard J. M., Fissore, A. Thermal Simulation of an Attached Sunspace and Its Experimental Validation. Solar Energy. 2007; 81(3): 305-315.
CrossRef


