Estimation of Nitrogen Dioxide (NO2) due to Burning of Household Biomass Fuel and Assessment of Health Risk among Women in Rural West Bengal
Deep Chakraborty
*
 and Naba Kumar Mondal
http://dx.doi.org/10.12944/CWE.16.Special-Issue1.04
Copy the following to cite this article:
Chakraborty D, Mondal N. K. Estimation of Nitrogen Dioxide (NO2) due to Burning of Household Biomass Fuel and Assessment of Health Risk among Women in Rural West Bengal. Curr World Environ 2021; SI1. DOI:http://dx.doi.org/10.12944/CWE.16.Special-Issue1.04
Copy the following to cite this URL:
Chakraborty D, Mondal N. K. Estimation of Nitrogen Dioxide (NO2) due to Burning of Household Biomass Fuel and Assessment of Health Risk among Women in Rural West Bengal. Curr World Environ 2021; SI1. Available From : https://bit.ly/2R9w74Y
Download article (pdf) Citation Manager Publish History

Introduction
The predominant cause of indoor air emissions globallyand in most developed countries is incomplete burning of biomass; it is burnt open and creates a lot of smoke1,2.The biomass smoke contains a wide range of high-risk pollutants, such as coarse, small, and ultrafine particulate matter, carbon monoxide, nitrogen and sulfur oxide, transitional metals, polycyclic, aromatic, and bio-aerosol compounds3. Recent studiesin rural home revealed that the main sources of indoor air pollution were burning of biomass fuels in poorly designed stoves4,5. However, wood stove emissions in different developed countries are the major cause of indoor air pollution in several poor homes6.Biomass is really the only origin that creates a great deal of contaminants that are detrimental to human health and impact climate change as well7.Many gaseous contaminants such as NO2, CO, CO2 and O3, including relative humidity and temperature, are generated during biomass burning8. Due to inefficient burning in traditional stove, pollutants likeoxides of nitrogen, PM2.5, organic hydrocarbons are usually emitted6. However, Begum et al.figured out that the estimated concentration varies on spatio-temporal monitoring and the difference may present room to room9.To the best of our knowledge there are scarsstudy on nitrogen dioxide concentration estimation in rural indoor environment. However, researchersstudied that, in rural household, high concentrations of NO2 are due to the use of poor combustion stoves10-13.In fact, peak occurrences of NO2are closely correlated with the use of gas and solid fuel stoves, during cook practices14.Due to greater heating usage, reduced ventilation rates and higher outside concentrations, indoor concentration are usually higher in winter than in any other seasons.
NO2 has the ability to reduce antioxidant tissue defences and thus, as revealed in a number of vitro test systems, induce damage and inflammation.Findings also have demonstrated that the progression of chronic diseases, such as infections and obstructive pulmonary disease, can affect individuals by prolonged exposure to NO2.Short-term NO2 toxicity that had negligible human harmful effects was smaller than 0.2 mg/m3 and 0.9 mg/m315,16.Exposure to reported high NO2 concentrations caused respiratory damage. Furthermore, it can cause irritation when you touch the skin or eye. Analysis has also demonstrated that extended exposures to elevated NO2 levels may be responsible for asthma production and the potential rise in respiratory sensitivity17.To the best of our knowledge there are no study on specifically NO2 and health risk among the rural women in West Bengal. Many study has been done on the cumulative effects on health of the women. Keeping in view of diverse nature and effects of nitrogen dioxide this study aims to determine theconcentrations of indoor NO2in rural households and to predict human health risks associated with NO2 exposure in rural West Bengal, India.
Materials and Methods
Study Area and Research Design
The adjoining rural area of the Purulia town, West Bengal, a state in Eastern India was selected for the study. Informed consent of the each participants was acquired prior to the study.
Ethical Approval
Ethical approval (No. IEC/BU (2016/1)) was taken from the Ethical Committee Board of the University of Burdwan, West Bengal, India.
Indoor Air Quality Measurements
Nitrogen dioxide (NO2)was measuredaccording to Mondal and Chakraborty5 by APM 821 (Envirotechmade).During cooking times in both the kitchen and living room, the concentration of NO2 was monitored. Sampling was performed mostly in the evening when most of the villagers cooked their meals for night. All the instruments were charged and calibrated prior to sampling. The instruments were positioned 1.5 m away from the stove and kept at breathing height of the women in sitting condition.
Quality Assurance and Control
APM 821 can maintain flow rate from 0.5 to 1 LPM up to 7 ± 1 h. Standardization of the instrument was done by the following method approved by CPCB, GoI. A constant flow rate of 1 LPM were maintained during sampling.Repeated data taken in laboratory and field condition showed >95% efficiency in both place.
Human Health Risk Assessment
Exposure Assessment
The non-carcinogenic exposure assessment from NO2 were done by the following equation 18.
AHD = C× IR/BW Eq. 1
Where, AHD = average hourly dose for inhalation (µg/kg/hour),
IR = inhalation rate (m3/hour)
C = concentration of NO2(µg/m3), and
BW = body weight (kg).
For exposure to non-carcinogenic pollutants (NO2), the chronic exposure equation19 was used for the inhalation exposure route:
ADD = (C×IR×ED)/ (BW×AT) Eq. 2
Where, ADD = average daily dose of the pollutant of interest (µg/kg/day),
C= concentration in air (µg/m3),
ED = exposure duration (days),
IR = inhalation rate (m3/ day),
AT = averaging time (days),
BW =body weight of the women (kg)
Risk Characterization by Hazard Quotient (HQ)
Here, the hazard quotient (HQ) is used to quantify potential non-carcinogenic consequences from exposure to a known pollutant. It represents the risk of a possible adverse result for people who are stable and/or receptive. Both acute and chronic exposure cases, non-cancer likelihoods were estimated as:
Chronic HQ = ADD/REL Eq. 3
Acute HQ = AHD/REL Eq. 4
Where, REL (reference exposure level), as adopted from WHO.
An HQ of 1.0 is known as the protection benchmark. An HQ < 1.0 suggests a marginal risk, i.e. the carcinogen under investigation, even for a susceptible human, is not likely to cause adverse health consequences. An HQ >1.0 suggests that as a result of exposure, there could be certain risks to susceptible people.
Uncertainty and Sensitivity Analysis
In the process of analyses of risk there may present large quantity of uncertainty due to the fixed input values rather than the range of measured data in the NO2 risk calculations. Monte-Carlo simulation was run to estimate the uncertainty and sensitivity of the NO2 risk factors to find out their role in the measured risk certainty.
Statistical Analysis
The study results were statistically analyzed using SPSS, Minitab 16, and Crystal Ball software ver. 11.1.2.4 (Oracle) was used to run the Monte-Carlo simulation. Pair t-test, ANOVA were applied to analyse the differences between pollutant concentrations at 5% level of significance.
Results and Discussion
Indoor NO2 Concentration Monitoring in Kitchen and Living Room
Monitoring of household air pollution took place in both kitchen and living room in three different season namely, summer, monsoon and winter while the cooking activity takes place. The result has been presented in table 1. During summer season the NO2 concentration in kitchen and living room were 43.21 ± 5.72 µg/m3and 15.413 ± 0.626 µg/m3, respectively. In monsoon season the NO2 concentration in kitchen and living room were 45.062 ± 2.761µg/m3and 14.777 ± 0.591 µg/m3, respectively and in case of winter season the NO2 concentration in kitchen and living room were 75.502 ± 1.423 µg/m3and 20.353 ± 0.852 µg/m3, respectively. Study showed that in each season there wasa significant difference (P < 0.001) present between kitchen room and living room pollutant concentration which can been defined with t-values also. Pair- t-test were conducted between kitchen and living room pollutant concentration and found t-values 26.29, 56.44 and 178.57 in summer, monsoon and winter season, respectively. Most of the studied rural households having the kitchen room adjacent to living room which may play a vital role for the higher concentration in living room. During survey smoky smell has been noticed all over the living room. Most of the kitchen room display improper ventilation which means lack of cross ventilation. Previous research also found the same kind of pattern in their study which support our recent research output21-22.The mean 24-hour nitrogen dioxide concentration was found 97 μg/m3 in a sample in Ethiopia, where biomass, crop residue and animal dung were the major household fuels23. The dominance of outside sources (mainly diesel generators and traffic) responsible for elevated level of indoor nitrogen dioxide concentrations was found in a study in Agra, India24.
Table 1: Concentration of Nitrogen Dioxide (NO2) in Kitchen and Living Room and Statistical Analysis.
|
Monitoring site and season |
Mean ± SD |
t- value |
P value |
|
NO2-KS |
43.21 ± 5.72 |
26.29 |
P < 0.001 |
|
NO2-LS |
15.413 ± 0.626 |
||
|
NO2-KM |
45.062 ± 2.761 |
56.44 |
P < 0.001 |
|
NO2-LM |
14.777 ± 0.591 |
||
|
NO2-KW |
75.502 ± 1.423 |
178.57 |
P < 0.001 |
|
NO2-LW |
20.353 ± 0.852 |
KS-kitchen/summer, KM- kitchen/monsoon, KW-kitchen/winter; LS-living/summer, LM-living/monsoon, LW-living/winter.
One-Way ANOVA Analysis of Indoor NO2 Concentration in Different Season
Table 2 and 3 presented the ANOVA result of NO2 in three season in kitchen and living room respectively. From table 2 the F value found 698.49 and table 3 the F value was 571.34 which both were found significant (P < 0.001). Moreover, the result revealed that there were significant variation in NO2 concentration present in three seasons in both kitchen room and living room. Similar variation of results has been found by few previous studies25,26.Zota et al.10, conducted study in the kitchen, living room, and outdoors during one year period, andfound the highest concentration in the kitchenwas during the summer season.It is general that windows are generally kept open during other season than winter season which allow the exit of NO2. Sometime outdoor to indoor transmission of NO2 also may cause of higher concentration in indoor.
Table 2: ANOVA Results for Nitrogen Dioxide (NO2) Concentrations among the Three Seasons in Kitchen Room.
|
Source |
DF |
SS |
MS |
F |
P |
|
Season |
2 |
19727.8 |
9863.9 |
698.49 |
P < 0.001 |
|
Error |
87 |
1228.6 |
14.1 |
||
|
Total |
89 |
20956.4 |
Table 3: ANOVA Results for Nitrogen Dioxide (NO2) Concentrations among the Three Seasons in Living Room.
|
Source |
DF |
SS |
MS |
F |
P |
|
Season |
2 |
558.9 |
279.45 |
571.34 |
P < 0.001 |
|
Error |
87 |
42.552 |
0.489 |
||
|
Total |
89 |
601.452 |
Health Risk Assessment from Indoor NO2
Kitchen and living room NO2 concentrations of three season were used to calculate HQ. The HQ calculated for acute exposures showed no immediate adverse health effects for women(HQ<1.0). Moreover, chronic exposure to NO2 was found to be higher (HQ>1.0) for women who cook with biomass fuel (shown in table 4) which suggested an adverse health condition may appear in near future. From table 4 it was found that in all the seasons both in kitchen and living room the acute exposure were found to be safe e.g. for kitchen; 2.36E-02, 2.46E-02, 4.12E-02 in summer, monsoon and winter, respectively and for living room these were; 8.41E-03, 8.06E-03, 1.11E-02 in summer, monsoon and winter, respectively. It is important to note that chronic health risk only found from kitchen room NO2 i.e. 1.04E+00, 1.09E+00, and 1.83E+00 in summer, monsoon and winter, respectively. However, no significant chronic health risks were found from living room NO2 concentration. Evidence from the recent risk assessment showeda low risk from acute exposure to indoorNO2.However, some recent studies have found that low levels of NO2exposure can lead to acute and obstructive lung diseases28,29.Some studies also found an association between NO2concentration and acute ischaemic stroke27, 30.However, there were some studies that did not find any significant associations between exposure to NO2 and human health31-32.
Table 4: Hazard Quotients for Acute and Chronic Exposure from Nitrogen Dioxide (NO2) at Different Season.
|
Monitoring site and season |
Acute HQ |
Chronic HQ |
|
NO2-KS |
2.36E-02 |
1.04E+00 |
|
NO2-KM |
2.46E-02 |
1.09E+00 |
|
NO2-KW |
4.12E-02 |
1.83E+00 |
|
NO2-LS |
8.41E-03 |
3.73E-01 |
|
NO2-LM |
8.06E-03 |
3.57E-01 |
|
NO2-LW |
1.11E-02 |
4.92E-01 |
KS-kitchen/summer, KM- kitchen/monsoon, KW-kitchen/winter; LS-living/summer, LM-living/monsoon, LW-living/winter.
Monte Carlo Probabilistic Simulation of Toxicological Risk of NO2
It is generally evident that uncertainty will exist in the monitoring of the pollutants, different exposure variables, toxicity potential of different pollutants, duration of exposure, etc. As from table 3 it was observed that concentration of kitchen room NO2 showed the chronic health effects because of thatMonte-Carlo simulation model has been run only for chronic HQ values of the kitchen room. In the simulation model, the lognormal curve was fitted to the frequency distribution of the forecast values. HQ of NO2during summer exposure showed the median value of 1.04E+00 and there was 56.60% of certainty that the women having the chronic health risk from NO2with the HQ values > 1 (Fig. 1A). In case of monsoon season exposure showed the median value of 1.09E+00 and there was 69.34% of certainty that the women having the chronic health risk from NO2 with the HQ values > 1 (Fig. 1B). Moreover, In case of winter season exposure showed the median value of 1.82E+00 and there was 99.42% of certainty that the women having the chronic health risk from NO2 with the HQ values > 1 (Fig. 1C). Sensitivity analysis indicates the most robust influential input parameters of risk assessment. In the case of summer season (HQ of NO2) kitchen NO2 concentration emerges as the highest contributing factors (43.7%) whereas, duration of exposure (18.2%) is the second most risk contributor (Fig 2A). However, in monsoon season duration of exposure (27.8%) emerges as the highest contributing factor followed by second highest exposure time (27.6%) (Fig 2B). Moreover, in winter season exposure time (31.3%) emerges as the highest contributing factor followed by second highest duration of exposure (31.1%) (Fig 2C).From the study results it was clear that in winter season the rural women who habituated to cooking with biomass fuel are more prone to higher health risk due to NO2 emitted from burning during cooking process.
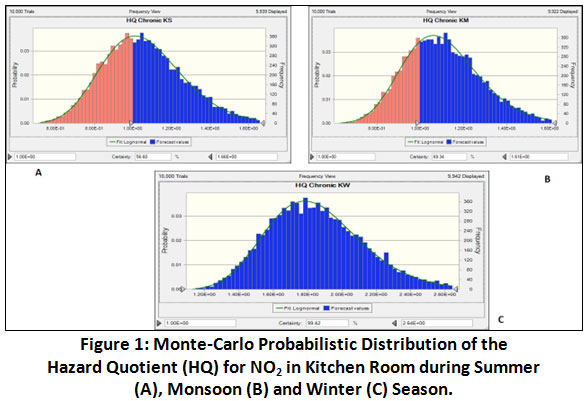 |
Figure 1: Monte-Carlo Probabilistic Distribution of the Hazard Quotient (HQ) for NO2 in Kitchen Room during Summer (A), Monsoon (B) and Winter (C) Season. Click here to view Figure |
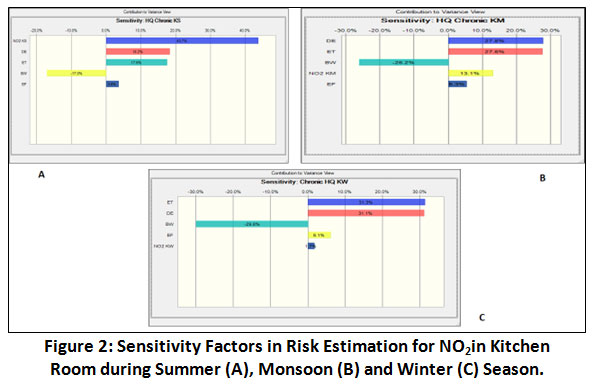 |
Figure 2: Sensitivity Factors in Risk Estimation for NO2in Kitchen Room during Summer (A), Monsoon (B) and Winter (C) Season. Click here to view Figure |
Conclusion
This study found women health risk from gaseous NO2 arises from burning of biomass fuel while cooking. There was significantly higher concentration of NO2 found irrespective of all seasons. This study found probable health hazards from NO2 as assessed through the human health risk modelling. This study will keep significant contributions toexposure assessment researchers, governmentand investors while taking more concrete steps to improve and protect human lives for long-term basis. Additionally, thefindings will helplegislators in modificationof existing system. Implementation of Pradhan MantriUjjalaYojona (PMUY) should be more rigidly in deep sector of rural West Bengal and also in India. For more clean and sustainable healthy indoor environment more awareness needed among rural population in India. In this respect local body like NGO, society can play an important role along with government bodies.
Acknowledgment
The authors acknowledge their sincere thanks to the funding agency, UGC F. No. 42–434/2013(SR), dated 12 March 2013 and DST-SERB F. No. [CRG/2019/004506, Dated 14.01.20120] for providing necessary funds for conducting the present research.
References
- WHO. Indoor Air Pollution and Health, 2011; Fact sheet 292.
- Akunne, A.F., Louis, V.R., Sanon, M., Sauerborn, R. Biomass solid fuel and acute respiratory infections: The ventilation factor. International Journal of Hygiene Environmental Health, 2006; 209: 445–450.
CrossRef - Smith, K. R. Indoor air pollution in developing countries: recommendations for research. Indoor Air, 2002; 12: 198–207.
CrossRef - Mondal, N.K., Bhaumik, R., Das, C.R., et al. Assessment of indoor pollutants generatedfrom bio and synthetic fuels in selected villages of Burdwan, West Bengal. Journal of Environmental Biology, 2013; 34: 963–966.
- Mondal, N.K., Chakraborty, D. Vulnerability of rural health exposed by indoor pollution generated from biomass and fossil fuels. Morrocan Journal of Chemistry, 2015; 3N°1: 83-98.
- Huboyo, H.S., Tohno. S., Lestari, P., Mizohata, A., Okumura, M. Characteristics of indoor air pollution in rural mountainous and rural coastal communities in Indonesia. Atmospheric Environment, 2014; 82: 343-350.
CrossRef - Arbex, M.A., Martins, L.C.,Oliveire, R.C., et al. Air pollution from biomass burning and asthma hospital admission in a sugarcane plantation area. Brazilian Journal of Epidemiological Communication and Health, 2007; 61:395–400.
CrossRef - Andreae, M.O., Merlet, P. Emission of trace gases and aerosols from biomass burning. Global Biogeochemical Cycle, 2001; 15 (4): 955–966.
CrossRef - Begum, B.A., Paul, S.K., Hossain, M.D., Biswas, S.K., Hopke, P.K. Indoor air pollution from particulate matter emissions in different households in rural areas of Bangladesh. Building and Environment, 2009; 44: 898–903.
CrossRef - Zota, A., et al. Ventilation in public housing: implications for indoor nitrogen dioxide concentrations. Indoor Air, 2005; 15: 393–401.
CrossRef - Dutton, S., Hannigan, M., Miller, S. Indoor pollutant levels from the use of unvented natural gas fireplaces in Boulder, Colorado. Journal of the Air & Waste Management Association, 2001; 51:1654–1661.
CrossRef - Basu, R., Samet, J. A review of the epidemiological evidence on health effects of nitrogen dioxide exposure from gas stoves. Journal of Environmental Medicine, 1999; 1:173–187.
CrossRef - Spengler, J.D., Sexton, K. Indoor air pollution: a public health perspective. Science, 1983; 221: 9–17.
CrossRef - Dennekamp, M., et al. Ultrafine particles and nitrogen oxides generated by gas and electric cooking. Occupational and Environmental Medicine, 2001; 58:511–516.
CrossRef - Lambert, W.E., et al. Nitrogen dioxide and respiratory illness in children. Part II. Assessment of exposure to nitrogen dioxide. Research Report, Health Effects Institute, 1993; 58:33–50.
- Simoni, M., et al. The Po River Delta (north Italy) indoor epidemiological study: effects of pollutant exposure on acute respiratory symptoms and respiratory function in adults. Archives of Environmental Health, 2002; 57:130–136.
CrossRef - Shima, M., Adachi, M. Effect of outdoor and indoor nitrogen dioxide on respiratory symptoms in schoolchildren. International Journal of Epidemiology, 2000; 29:862–870.
CrossRef - World Health Organization. Principles for the assessment of risks to human health from exposure to chemicals. Environmental HealthCriteria 210. 1999. Geneva, Switzerland,
- US Environmental Protection Agency. Human health risk assessment protocol for hazardous waste combustion facilities, 1988. http://www.epa.gov/epaoswer/hazwaste/combust/risk.htm
- US Environmental Protection Agency. Risk assessment guidance for superfund, Vol 1: human health evaluation manual (Part A), 1989.http://www.epa.gov/superfund/programs/risk/ragsa/
- Chakraborty, D., Mondal, N.K. Assessment of Health Risk of Children from traditional Biomass Burning in Rural Households. Exposure and Health, 2017; DOI 10.1007/s12403-017-02421.
CrossRef - Chakraborty, D., Mondal, N.K., Datta, J.K. Indoor pollution from solid biomass fuel and rural health damage: a micro-environmental study in rural area of Burdwan, West Bengal. Int J Sustain Environ, 2014, 3(2): 262–271.
CrossRef - Kumie, A., et al. Magnitude of indoor NO2 from biomass fuels in rural settings of Ethiopia. Indoor Air, 2008; 19:14–21.
CrossRef - Lawrence, A.J., Masih, A., Taneja, A. Indoor/outdoor relationships of carbon monoxide and oxides of nitrogen in domestic homes with roadside, urban and rural locations in a central Indian region. Indoor Air, 2005; 15:76–82.
CrossRef - Chakraborty, D., Mondal, N. K. Hypertensive and toxicological health risk among women exposed to biomass smoke: A rural Indian scenario. Ecotoxicology and Environmental Safety, 2018; 161: 706–714.
CrossRef - Mondal, N. K., Saha, S.K., Datta, J.K., Banerjee, A. Indoor air pollution: a household study in the village Faridpur and Ranchi colony, Durgapur, Burdwan District, West Bengal. Environmental Pollution, 2011; 1(1): 5–7.
- Andersen, Z. J., Kristiansen, L.C., Andersen, K. K., et al. Stroke and long-term exposure to outdoor air pollution from nitrogen dioxide: a cohort study. Stroke, 2012; 43:320–325.
CrossRef - Chen, R., Samoli, E., Wong, C. M., et al. Associations betweenshort-term exposure to nitrogen dioxide and mortality in 17 Chinese cities: the China Air Pollution and Health Effects Study (CAPES). Environment International, 2012; 45:32–38.
CrossRef - Santus, P., Russo, A., Madonini, E., et al. How air pollution influences clinical management of respiratory diseases. A case-crossover studyin Milan. Respir Res, 2012; 13:95.
CrossRef - Vidale, S., Bonanomi, A., Guidotti, M., et al. Air pollution positively correlates with daily stroke admission and in hospital mortality: astudy in the urban area of Como, Italy. NeurolSci, 2010; 31:179–82.
CrossRef - Linaker, C. H., Chauhan, A. J., Inskip, H. M, et al. Personal exposures of children to nitrogen dioxide relative to concentrations in outdoor air.Occup Environ Med, 2000;57:472–476.
CrossRef - Sarnat, J. A., Schwartz, J., Catalano, P. J., et al. Gaseous pollutants in particulate matter epidemiology: confounders or surrogates? EnvironHealth Perspect, 2001; 109:1053–1061.
CrossRef


