Spatio-Temporal Variation of Atmospheric Gaseous and Particulate Reactive Nitrogen over Northern India
Manisha Mishra
and Umesh Kulshrestha
*

http://dx.doi.org/10.12944/CWE.16.Special-Issue1.05
Copy the following to cite this article:
Mishra M, Kulshrestha U. Spatio-Temporal Variation of Atmospheric Gaseous and Particulate Reactive Nitrogen over Northern India. Curr World Environ 2021; SI1. DOI:http://dx.doi.org/10.12944/CWE.16.Special-Issue1.05
Copy the following to cite this URL:
Mishra M, Kulshrestha U. Spatio-Temporal Variation of Atmospheric Gaseous and Particulate Reactive Nitrogen over Northern India. Curr World Environ 2021; SI1. Available From : https://bit.ly/3dbQfu8
Download article (pdf) Citation Manager Publish History

Introduction
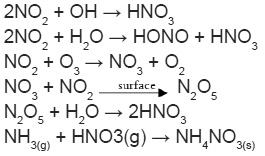
When the neo-Malthusians were busy in predicting the impending food crisis across the world due to burgeoning levels of population, little did they conceive of a situation where the food production would outstrip the rate of population growth. This has been made possible in large measure due to the increased production of the variegated nitrogenous inputs that have served to amplify the levels of food production1. A direct consequence of this has been the intensification in nitrogen (N) cycles across the world which, in turn, has spawned a host of environmental problems ranging from deterioration in air quality levels to aquatic scares such as eutrophication and acidification2,3. Nitrogenous components are one of the key players of atmospheric multi-phase chemistry, which significantly alters biogeochemical N cycle4. Studies have shown rising concern over multi-fold increase in the emission of reactive N gases, mainly NH3 and NOx, which undergo multiple transformations due to various atmospheric processing. Most of the primary emissions of oxidized component of N (NOx) are in the form of nitric oxide (NO), which soon gets oxidized into nitrogen dioxide (NO2) through gas phase photochemistry. Photochemical oxidation reactions dominate the atmospheric chemistry of N compounds. Major atmospheric oxidants include OH, O3, NO3, HO2 and Cl, which play a crucial role in the gas to particle conversion of atmospheric N. The magnitude and abundance of reactive particulate N are dependent on the number of conditions such as availability of precursor gases such as NH3, NO2, VOCs, ozone, etc., light availability, temperature and relative humidity (RH).
Due to the polar nature, gaseous N compounds get dissolved into the aqueous phase present in the atmosphere in the form of cloud, fog or water droplets5,6. However, unlike NH3 which is highly soluble gas, NO2 is not readily soluble in water and its particle phase conversion depends on the kinetics of the reactants. If the reactant concentration gets lowered, NOx oxidation from gas to particle get slowdown dramatically due to its lower range of Henry’s law constant7. It was found that insoluble gases have values around 10-3 mol L-1 atm-1 and highly soluble is in the order of 105 mol L-1 atm-1. The rate of aqueous phase oxidation of NOx drops off steeply with the concentration of the gases involved, even in the highly polluted areas and not significantly contributing to the aqueous phase acidity8. In short, NOx uptake by water droplets in the atmosphere is not believed to contribute to particulate N formation rather its photochemical oxidation into gaseous HNO3 become the major source of particulate nitrate in the atmosphere9. NH3 as a major gaseous base in the atmosphere effectively neutralizes NOx components and undergoes to both wet and dry deposition. Since neutralization is an equilibrium reaction, it does not necessarily imply to the permanent removal from the atmosphere and remain in gas-particle-gas equilibrium, thus it degrades air quality and visibility.


Nitrogen oxides also readily react with atmospheric organic compounds, primarily VOCs and get reduced. VOCs/NOx ratio strongly affects the gas particle partitioning of atmospheric reactive N and led to the formation of organic nitrates10.
Organic nitrogenous aerosols are mostly produced by the photochemical oxidation of VOCs by NOx and NOy species. Final products of such reactions include the formation of peroxy acetyl nitrates (PANs), alkyl nitrates (RONO2), amines (RNH2), hydrazines (RNHNH2), etc. However, the rate of formation and decomposition of such products highly dependent on the dynamics of NO and NO2. Aliphatic amines are also emitted from a variety of sources, including sewage treatment, waste dumping, industrial activities, etc., along with NH3 11. However, most of the other organic N aerosols are product of VOCs - NOx photochemical interactions.
Organic nitrogen (ON), as one of the important sub-component, is known to play a crucial role in the atmospheric chemistry and global N cycle, which have been significantly altered by human activities12. Due to the slower scavenging process of organic N as compared to inorganic N compounds (NH4+ and NO3-), they tend to be transported through long distances and hence are the key agents in the global N transport system13–15. Through dry and wet deposition, inputs of total N plays a crucial role in soil acidification, nutrient enrichment, eutrophication and tropospheric ozone formation on land and aquatic environments. Over the urban areas nitrogenous compounds also help in the haze and smog formation, especially during winters, causing the visibility reduction and severe health implications16. However, observations of total atmospheric N through dry and wet depositions, published in the last few years have presented the relative significance of ON in the atmosphere and thus its importance has been globally recognized12. Therefore, it can be inferred that the present estimate of the atmospheric reactive N budgets underestimates the total soluble reactive N in the atmosphere by virtue of their singular focus on the inorganic N viz. NH4+, NO3- and NO2- 17. This requires a comprehensive study of reactive N, inclusive of both inorganic as was well as its organic forms, and spatial and temporal variation in the scavenging process to enhance the scientific understanding of this aspect of the N cycle. Thus, the present study focuses one year long observation of NH3 and NO2 along with particulate water soluble total nitrogen (pWSTN) over the densely populated IGP region of the northern India.
Methodology
Sampling Sites
Being a major hotspot of air pollutants, Indo-Gangetic plain (IGP) is known for their very high population density and stationary sources of N emission in the atmosphere, which explains its selection as the spatial focus of this study18. IGP region can be categorized under humid subtropical climate. Within IGP three different sites were selected based on the differential local sources and land use pattern (Figure 1). Prayagraj (25°54′N, 81°85′E) as an urban site, formerly known as Allahabad, is located in the southeastern part of Uttar Pradesh and central part of IGP region. Due to continuous development of its suburbs, in 2011, it was ranked the world's 130th fastest-growing city. Local brick kiln units, unregulated solid waste burning, vehicular exhausts from diesel powered and old vehicles are the major emission sources. Madhupur village (25°54′N, 82°00′E) in Pratapgarh district, which is adjacent to the Prayagraj district, was selected as rural site. Madhupur site located is 70 km away in the north eastern side of Prayagraj. The city comes under one of the most backward districts of India. Primarily, as an agrarian district, Pratapgarh has risen in ranks as the top producer of Aonla or Amla fruit, which is used as herbal medicine. The village is poorly developed as hardly any roads pass across the area, having a very low vehicle density and high vegetation cover. Biomass burning, soil re-suspension and the agricultural activities are the main source of the pollution in the area. Delhi, representing megacity characteristics, is located at the upwind side of the IGP. Thus, it is highly affected by the long range transportation of pollutants. Vehicular emission, soil re-suspension, construction activities, bioaerosols and roadside dust are the major local sources. The sampling was conducted approximately at 15 meters above the ground, on the rooftop of the residential buildings at each site.
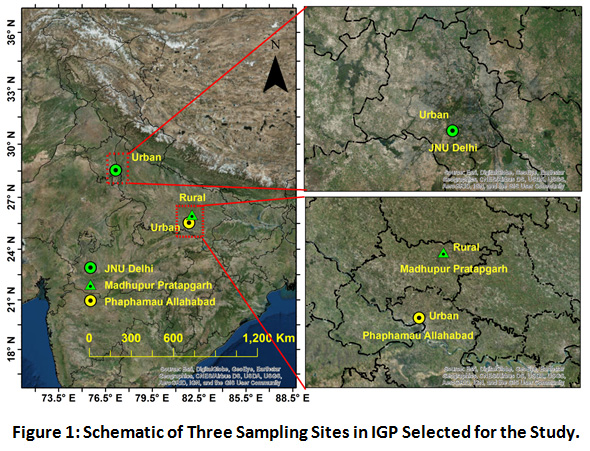 |
Figure 1: Schematic of Three Sampling Sites in IGP Selected for the Study. |
Sampling Procedure
Eight hourly sampling (daytime) was conducted on every third day at the sampling sites for a year, starting from 1st December, 2016 to 30th November, 2017. The collection of gaseous (NH3 and NO2) and fine particulates sampling were conducted using a low volume sampling (LVS) unit, operated at a flow rate of 30 L min-1 (and regulated separately for gases at a flow rate of 1 L min-1). The unit consisted a low volume vacuum pump which used to suck the ambient air through an open front at the another end. The particulates were filtered and collected on a 47mm (dia) Pallflex Tissuequartz 2500QAT –UP microfiber filters using 47 mm filter holder at the open front side. The filtered air directly drawn to the impingers carrying absorbing solution for NH3 and NO2. NH3 samples were collected in a 20 ml of 2.5 mM H2SO4 absorbing solution and NO2 samples were collected using 20 ml absorbing solution of sodium hydroxide and sodium arsenite mixture. The collected gaseous samples were transferred in polyproylene bottles and analyzed colorimetrically where the collection efficiency was observed to be 85% for NH3 and 68% for NO2. The detailed sampling protocol along with the collection efficiency has been elaborated by Kulshrestha and coworkers19,20. Both gaseous and particulate samples were stored in cool ( Ì´ 4oC) and dark place until the analysis. One field blank from each month was also analyzed in order to avoid over/under estimation during the sampling and analysis. A total of 102, 65 and 107 samples were collected from the Prayagraj, Madhupur (less number of filters due to the shortage of power supply in the village) and Delhi sites, respectively, for one year covering all the four seasons viz. Winter (Dec-Feb), Summer (Mar-Jun), Monsoon (Jul-Sep) and Post-Monsoon (Oct-Nov).
Analysis
Analysis of nitrogenous gaseous samples of NH3 and NO2 was performed using colorimetric method on UV–visible spectrophotometer (Perkin Elmer, USA). Gaseous NH3 was analyzed using indo-phenol blue method where (NH4)2SO4 used as a standard for the calibration. Calibration curve was plotted using serially diluted solution of blank, 0.5ppm, 1 ppm, 2.5 ppm, 5 ppm, 10 ppm standard with a regression coefficient (r2) value of 0.998 at 630nm wavelength. The similar calibration curve was also plotted for gaseous NO2 samples at 540nm wavelength using Jacob and Hochheiser method. For NO2 analysis, standards were prepared using blank, 0.25 ppm, 0.5 ppm, 1 ppm and 2 ppm solution of NaNO2.
TOC/TN analyzer (Shimadzu model-TOC-LCPH E200 ROHS) was used for the analysis of WSTN. About one fourth of each filter (∼3.14 cm2 area) was soaked in 25ml MilliQ water for nearly 6–8 h, which was followed by ultrasonic treatment to disintegrate the soluble species from the filters. Then it was filtered through a Nylon fiber syringe filter (diameter: 25 mm) and transferred to a new vial for the analysis. The analytical procedure starts with injecting the sample into the furnace, which is maintained at a temperature of 720oC for TN analysis and followed by its oxidation using platinum catalyst. The evolved nitrogen monoxide (NO) was measured through oxidative combustion-chemiluminescence method. Potassium nitrate (KNO3) standards (1, 10 and 50ppm) were used to calibrate WSTN in the samples. In order to get a coefficient of variation below 2% each analysis of WSTN was repeated two to three times.
Results and Discussion
Spatio-Temporal Variation of Ambient NH3
Large scale variation in NH3 concentrations was recorded at all the three sampling sites, as shown in Figure 2. NH3 concentration at Prayagraj site was found to be the highest ranging from 0.19 to 232.0 µg m-3 with an annual mean value of 72.0±6.5µg m-3. It was followed by Madhupur site where NH3 concentration ranged from 3.5 to 245.4 µg m-3 with an annual mean of 57.7 µg m-3. Its concentration was recorded lowest at the Delhi site ranging from 7.8 to 285 µg m-3 with an annual mean of 35.8 µg m-3. The concentrations of NH3 at Prayagraj and Madhupur sites is quite high since none of the previous studies have reported such a high value as shown in Table 1. However, in an annual observation conducted in 2013 by Singh and Kulshrestha (2014), the annual mean concentration was reported to be 50.5 µg m-3 at a rural site within IGP which stands closest to the present reported value of the Madhupur rural site. The agriculture activities, including both NH3 based fertilizers application and animal husbandry being the largest source of NH3 emission, makes the abundance of NH3 in rural areas quite distinct22. However, despite having urban character, Prayagraj site has shown exceptionally high mean values, which can be attributed to the abundance of mixed sources such as high vehicular density, biomass burning, agriculture activities, waste dumping sites within the vicinity of sampling area, large scale local cattle rearing, etc. Additionally, microbial emission might also be accounted for NH3 emission due to improper sewer drainage and subsequent pollution of river Ganges and Yamuna, flowing across the city22. Also by virtue of being a growing urban centre, the city of Prayagraj has a very high population density, which in a way leads to a greater generation of human excreta thereby causing greater amounts of NH3 emission in the region23,24. Such kind of mixed sources was not observed around the sampling site of Delhi, where the dominant sources are vehicular emissions, industrial activity and other biogenic emissions. Wang et al. have found a positive relationship between NH3 concentrations and vehicular density and reported that vehicular density contributes up to 25% of total NH3 emission in urban areas25. A study conducted in 2010-11 at the same site in Delhi (JNU campus) have also reported an annual mean of 29.4 μg m−3 19. Sharma at al. (2014) have also reported a mean concentration of NH3 as low as 21.0 μg m−3 at an urban residential site of Delhi26.
Table 1: Reported Concentrations of Gaseous Nitrogen Species at Different Sites.
|
Site |
Duration |
NH3 (μg m−3) |
NO2 (μg m−3) |
References |
|
Manhattan, US |
Winter |
3.7 |
- |
27 |
|
Lahore, Pakistan |
Winter |
50.1 |
19.6 |
28 |
|
Singapore |
Annual |
2.5 |
1.7 |
29 |
|
Barcelona, Spain |
Annual |
6.9 |
- |
30 |
|
Beijing, China |
Annual |
21.5 |
54.3 |
31 |
|
China |
Summer |
39.2 |
32.5 |
32 |
|
Pune (Urban) |
Summer |
2.0 |
1.9 |
33 |
|
Raichur (Nonurban) |
Winter |
0.9 |
3.8 |
33 |
|
Sarni (Industrial) |
Summer |
1.2 |
3.8 |
33 |
|
Delhi (Urban) |
Annual |
35.4 |
- |
34 |
|
Rampur, UP (Rural) |
Annual |
6.7 |
7.3 |
35 |
|
Agra (Suburban) |
Annual |
10.5 |
5.4 |
36 |
|
Kanpur (urban) |
Annual |
17.1 |
21.3 |
37 |
|
Delhi (Urban) |
Annual |
29.4 |
- |
19 |
|
Mai, UP (Rural) |
Annual |
50.5 |
24.4 |
21 |
|
Delhi (Industrial) |
Annual |
40.7 |
18.8 |
21 |
|
Delhi (Urban) |
Annual |
21.0 |
17.1 |
26 |
|
Delhi (Industrial) |
Annual |
- |
26.0 |
38 |
|
Delhi (Urban) |
Annual |
19.6 |
19.7 |
39 |
|
Delhi (Urban) |
Winter |
35.4 |
15.8 |
20 |
|
Rohtak (Urban background) |
Winter |
14.6 |
6.1 |
20 |
|
Faridabad (Industrial) |
Winter |
39.2 |
24.9 |
20 |
|
Prayagraj, UP (Urban) |
Annual |
72.0 |
9.4 |
Present Study |
|
Madhupur, UP (Rural) |
Annual |
57.7 |
3.1 |
Present Study |
|
Delhi (Urban) |
Annual |
35.8 |
13.4 |
Present Study |
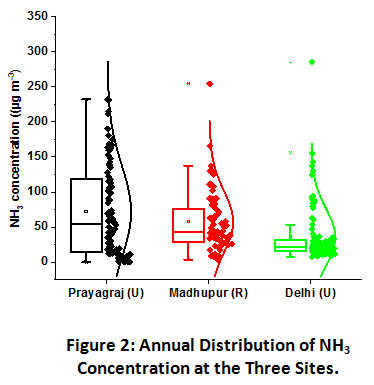 |
Figure 2: Annual Distribution of NH3 Concentration at the Three Sites. Click here to view Figure |
(box plots are showing 25th and 75th percentile with the horizontal line inside representing the median value and the small square point stating the mean value. The vertically clustered dots are showing the concentrations of each sample along with their distribution curve corresponding to y-axis) (U =urban, R = rural).
Seasonal contribution in the total annual NH3 emission at Prayagraj site was in the order of winter (41%) ≥ post-monsoon (40%) > monsoon (11%) > summer (8%). Contribution at Madhupur village was in the order of Post-monsoon (43%) > monsoon (24%) > winter (21%) > summer (12%). At the Delhi site, the observed order is Post-monsoon (49%) > winter (24%) > monsoon (15%) > summer (12%). Despite having higher volatilization rates in hot summers, NH3 concentrations were recorded lowest in the summer months as compared to other seasons at all three sites. Previous studies carried out over IGP also reported higher ambient NH3 levels in winters as compared to summers21,39. This anomaly can be explained by the higher mixing height and wind speed, which allows diffusion and dispersion of the atmospheric components, leading to their lower ambient levels. However, in the monsoon season, additional NH3 emission might be contributed by decay and decomposition of organic matter under wet conditions.
Spatio-Temporal Variation of NO2
Variation in NO2 concentrations at all the three sites has been shown in Figure 3. NO2 levels were recorded the highest in Delhi, where it varied from 0.2 to 94.5 µg m-3 with an annual mean of 13.4 µg m-3. It was followed closely by Prayagraj with values ranging from 0.4 to 45.2 µg m-3 with an annual mean of 9.4 µg m-3. The Madhupur site predictably, owing to its rural character, reported lowest concentrations of NO2 with the least variation ranging from 0.6 to 16.1 µg m-3 and an annual mean of 3.1 µg m-3.
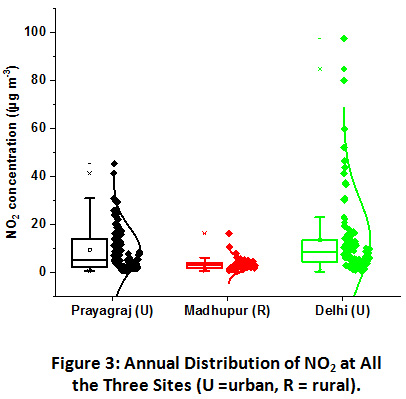 |
Figure 3: Annual Distribution of NO2 at All the Three Sites (U =Urban, R =Rural). Click here to view Figure |
NO2 concentrations were recorded low at all the three sampling sites and much below the prescribed limits of National Ambient Air Quality Standards (NAAQS) by CPCB, which is 80 µg m-3 annual for residential areas. An annual mean of 26 µg m-3 was also reported previously at a site near the industrial area in Delhi38. Light-duty vehicles are the primary sources of NO2 in urban areas. Being the megacity and national capital region (NCR) the vehicular density is increasing manifold in the Delhi, which probably lead to the higher concentration of NO2 in Delhi as compared to Prayagraj urban site20,21,39. However, as compared to previous studies carried out in Delhi, as shown in Table 1, the present study has shown the lowest value, which might be due to the relatively less number of vehicle movement in the vicinity of the JNU sampling site. Prayagraj site was dominated by both light-duty and heavy-duty vehicles contributing to the NO2 emission. In contrast, rural areas are primarily characterized by lower vehicular movement due to poor road construction and infrastructure in the villages. No major roads were constructed around the 5 km2 area of the sampling site, except a narrow one-lane road, which connects the village with the city. The biomass burning sources, primarily, can be attributed to the abundance of NO2 in the rural site.
At these sites, the sources of NO2 emissions are primarily vehicular exhausts and remains more or less constant throughout the year. In such conditions, changing meteorological conditions could be the major factor affecting their ambient levels. Seasonal contribution in the total annual NO2 emission at Prayagraj site was in the order of winter (47%) ≥ post-monsoon (32%) > summer (13%) > monsoon (8%) and at Delhi was in the order of Post-monsoon (58%) > winter (24%) > summer (12%) > monsoon (6%). Higher contribution in winter and post-monsoon season at both these urban locations can be corroborated with NH3 abundance pattern owing to the calm weather conditions and the lower mixing height and vice-versa for summer lower concentrations35,40. Exceptionally, higher values in post-monsoon season at Delhi can also be attributed to the crop residue burning incidents in the northwestern region of IGP and its transportation to the downwind regions, since none of the other local activity changes were observed41. Seasonal contribution at Madhupur village was totally different from the urban locations. The pattern was in the order of Summer (41%) > monsoon (24%) > post-monsoon (23%) > winter (12%), suggesting the local factors which might be impacting the distribution pattern. One of the major causes of the higher NO2 emission in summers is the use of diesel-powered generators in the villages, particularly due to the shortage of electricity supply and relatively larger social gatherings for local ceremonies in summers. This ultimately leads to the frequent use of diesel generators and causes a spike in NO2 values during the summer. However, the lowest concentration in winter season could be attributed to higher rates of gas to particle conversion in humid conditions, which will be further investigated by its relation with particulate WSTN.
Spatio-Temporal Variation of Particulate Water-Soluble Total Nitrogen (pWSTN)
Studies have reported that Asian aerosols contribute up to 40% of nitrogenous compounds, which exists in water-soluble phase42,43. Due to their polar characteristics, nitrogenous compounds are highly reactive in nature and also dominate the atmospheric chemistry and aerosol formation. Thus, we investigated the annual distribution of water soluble total nitrogen in the particle phase (pWSTN) in ambient air at all th selected sites as shown in Figure 4.
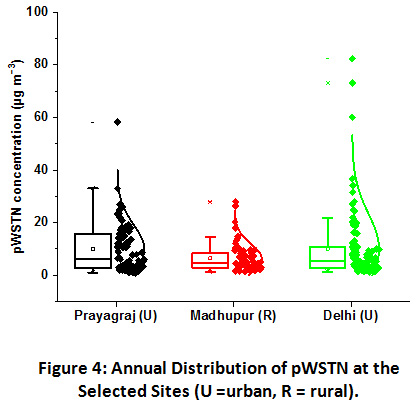 |
Figure 4: Annual Distribution of pWSTN at the Selected Sites (U =Urban, R =Rural). Click here to view Figure |
As the figure clearly shows, the large scale variation was observed at both the urban sampling sites as compared to the rural site. The pWSTN concentration in fine aerosols found highest at the Delhi site, ranging from 1.3 to 82.4 μg m−3 with an annual mean of 10.1 μg m−3. It was closely followed by Prayagraj site, where the values ranged from 1.1 to 58.2 μg m−3 with an annual mean of 10.0 μg m−3. Concentration varied within smaller scale at the Madhupur, ranging from 1.3 to 27.9 μg m−3 with the lowest annual mean value of 6.4 μg m−3. The pWSTN contribution to the total particulates was found highest at Delhi, about 7% annually. It is followed by Prayagraj, where pWSTN contributed annually about 6%. The lowest contribution was observed at the Madhupur rural site, with an annual mean of 5%. Reports have shown that inorganic N aerosols contribute up to 90% of total atmospheric N in the polluted urban atmosphere. Some of the studies over South Asia have attempted to characterize the total atmospheric N deposition42,44–49. A strong correlation between WSON and NH4+ in fine mode marine aerosols over the western North Pacific and East China Sea were observed, thereby, suggesting their contribution from anthropogenic sources44. The results of total N at 32 monitoring sites in China have shown that ON contributes, significantly, from 7% to 67% of WSTN46. Similar results were also observed by Srinivas et al. in the study of PM2.5 and PM10 over Bay of Bengal47. Significant concentrations of gaseous and particulate nitrogen species were also reported over north India, suggesting the IGP as a major hotspot of N emission21,50–52. NH4+ and NO3- contribute about 91% of total N at a coastal site in South India, despite the least influence of local anthropogenic sources43. This primarily attributed to the transportation of their precursor gases from distant sources. NH3 and NO2 are the primary precursors of these aerosols and their gas to particle conversion highly influence the distribution and abundance pattern of nitrogenous aerosols.
Seasonal contribution of the annual pWSTN concentration at Prayagraj site was in the order of winter (49%) ≥ post-monsoon (25%) > summer (17%) > monsoon (9%) and at Delhi was in the order of Post-monsoon (56%) > winter (23%) > summer (12%) > monsoon (9%). Higher moisture content in winters provides for heterogeneous chemical reactions in the troposphere leading to the higher rate of particle conversion. The fog droplets processing significantly increase the particulate N compounds during winters over IGP53. Since most of the particulate N comes from agriculture activities, harvesting period in November and its coincidence with lower mixing height abruptly increase the aerosol ambient concentrations54. Same seasonal pattern at both the urban sites was also recorded for NO2. This also suggests that NO2 plays important role in particle formation at both the urban sites. However, the seasonal distribution was found insignificant at the Madhupur rural site and it was in the order of summer (28%) > post-monsoon (27%) > winter (26%) > monsoon (19%). Indiscriminately, lowest value of pWSTN was recorded in monsoon season at all the three sites owing to the washout effect in monsoon season. Polar as well as the reactive nature of nitrogenous compounds lead to the wet removal of the aerosols and ultimately lowering of their ambient concentrations55. Unlike urban sites, rural site has shown highest concentration of pWSTN in summer months. The formation of WSON significantly increases ambient levels of pWSTN in the absence of rain events and contribute highest during summers owing to the greater photochemical oxidation and dust storms/ soil re-suspension influence56.
Phase Partitioning of Gaseous and Particulate N Along with their Relation with Meteorological Parameters
Scatter matrix and frequency distribution plot of gaseous and particulate N was used to analyze the phase partitioning of reactive N. There interlinkages and correlation with meteorological factors at the Prayagraj, Madhupur and Delhi sites have been shown in the Figure 5, 6 and 7, respectively.
Prayagraj
A good correlation was observed between N gases viz. NH3 and NO2 (r = 0.59), showing their common emission from biomass and fossil fuel burning in the urban areas. Alongside pWSTN has showed stronger correlation with NH3 (r =0.60) as compared to NO2 (r = 0.58), indicating the higher contribution of NH3 in the phase partitioning as compared to NO2. However, very close correlation (r) values of both the primary gases with pWSTN concentration, showing their simultaneous conversion into particle phase preferentially NH4NO3.
This phase conversion is highly dependent on the precursor gases concentration and impact of meteorological parameters such as relative humidity (RH) and temperature. The frequency distribution of RH suggests that the value was less than a deliquescence point (<75%) for more than 75% of the sampling period. This indicates that NH3 mostly remained in the gaseous phase for most of the days, which is substantiated by its positive correlation with RH. Unlike the previous studies, NH3 has shown a negative correlation with temperature and wind speed, which is indicating that higher temperature and wind speed inhibiting the gaseous NH3 concentrations. A similar case was also observed for NO2 and pWSTN. This can be explained by the positive correlation of temperature and wind speed which might be allowing greater dispersion of the atmospheric pollutants and leading to their lower concentrations.
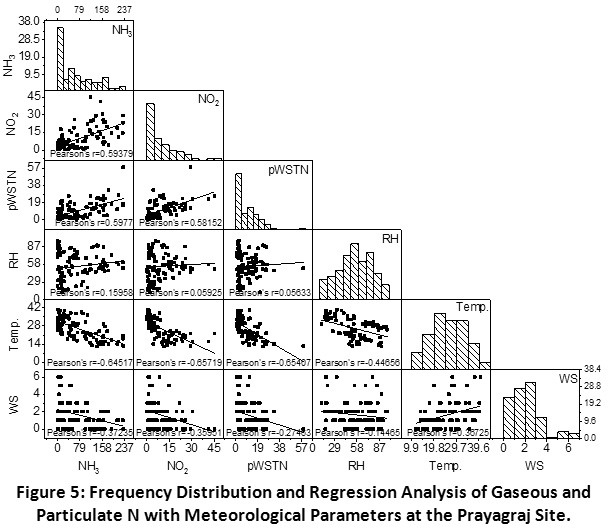 |
Figure 5: Frequency Distribution and Regression Analysis of Gaseous and Particulate N with Meteorological Parameters at the Prayagraj Site. Click here to view Figure |
Madhupur
At the rural site, as shown in Figure 6, negative correlation between NH3 and NO2 (r = -0.16) was observed, showing their different emission sources. No correlation was found between gaseous and particulate nitrogen, indicating the gas phase oxidation of NH3 and NO2. This is confirmed by the positive correlation of NH3 and RH (r = -0.41), indicating dominance of NH3 even at higher RH values. This anomaly can also be explained by their gas phase oxidation and least contribution in particulate N formation. In contrast, NO2 was negatively correlated with the RH and positively correlated with temperature, indicating towards their frequent oxidation at higher RH values and cooler atmosphere. However, insignificant correlation of pWSTN with RH and temperature is showing its independent formation with least impact of meteorological parameters at the rural site.
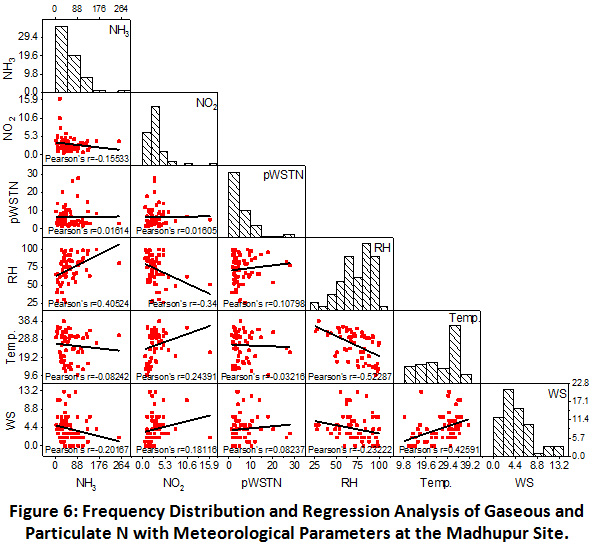 |
Figure 6: Frequency Distribution and Regression Analysis of Gaseous and Particulate N with Meteorological Parameters at the Madhupur Site. Click here to view Figure |
Delhi
As shown in Figure 7, least but positive correlation between NH3 and NO2 (r = 0.11) was observed at this urban site, which shows that mostly their sources remain different throughout the year. A strong correlation was found between NO2 and pWSTN (r = 0.78), indicating towards the oxidation of NO2 playing key role in the particulate formation during the sampling period over urban site. Similar to the previous sites, gaseous and particulate N abundance was found independent of RH. However, their negative correlation with temperature and wind speed, showing greater dispersion of atmospheric components in hot and windy weather conditions at Delhi site also.
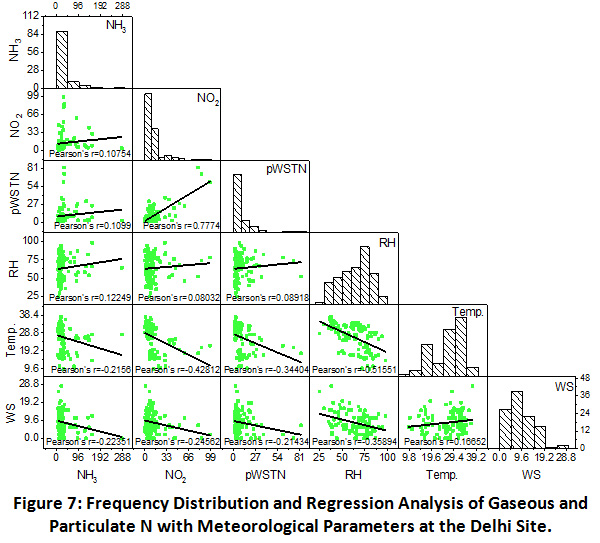 |
Figure 7: Frequency Distribution and Regression Analysis of Gaseous and Particulate N with Meteorological Parameters at the Delhi Site. Click here to view Figure |
Relative Contribution of Atmospheric Gaseous and Particulate N
Figure 8 shows the relative contribution of NH3, NO2 and particulate N in the ambient air at the selected sampling sites. Gas phase reactive N contributed upto 90% of total atmospheric N. NH3 was found to contribute maximum and more than 60%, annually, of total atmospheric N at all the three sites with highest contribution at the rural site Madhupur (86%) followed by urban sites, Prayagraj (79%) and Delhi (60%). Agriculture emission, cattle rearing and biomass burning are the primary sources of NH3 at the rural site and microbial emission, human excreta and combustion generated emissions are primary sources at the urban sites. In contrast, NO2 was found to contribute higher at both the urban sites as compared to rural site, with highest percentage in Delhi (23%) followed by Prayagraj (10%) and lowest at Madhupur (5%). Vehicular emissions (both gasoline and diesel) are the primary source of NO2 in the urban areas. Furthermore, the order of pWSTN contribution was observed higher at Delhi (17%) and Prayagraj (11%) and lower at Madhupur (10%) which can be corroborated with NO2 distribution pattern and its strong correlation with particulate N abundance at the urban sites57. Seasonal meteorology has also shown its impact in the relative abundance of particulate N in ambient air at all the three sites. While, geographically, closely located sites, Prayagraj and Madhupur, have shown a similar seasonal abundance pattern, slightly a different pattern was observed at Delhi, which can be attributed to the influence of long range transport of pollutants from upwind regions, which could be additionally affecting the relative abundance of atmospheric reactive N at the Delhi site.
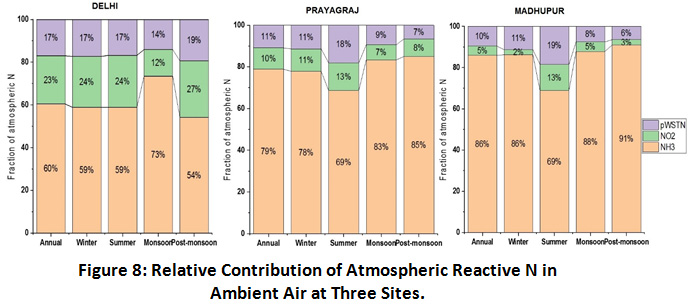 |
Figure 8: Relative Contribution of Atmospheric Reactive N in Ambient Air at Three Sites. Click here to view Figure |
Conclusion
Increasing emissions of atmospheric reactive N are considered as an important player in altering the N cycle. In this context, the present study conducted over highly populated IGP region has shown alarming levels of NH3 with very high concentrations over the fast growing urban sprawls of Prayagraj. It was followed by Madhupur rural site owing to the livestock and agriculture sources, which are considered as the biggest source of NH3 emissions in India. However, Delhi having urban megacity characteristics has shown to have least concentration of NH3. In contrast, due to less vehicular emission Madhupur has shown the lowest NO2 concentrations followed by Prayagraj and highest at Delhi. Growing vehicular density and industrial emission are the primary sources of NO2 over the urban areas. Similarly, particulate N was also observed to be lowest at Madhupur followed by Prayagraj and highest in Delhi. Seasonal distribution pattern of gaseous and particulate N have shown similar trends at both the urban sites where post-monsoon and winter months were found to contribute to the highest annual emissions. This can be attributed to the significant impact of changing meteorology on the abundance of atmospheric reactive N since the local sources over urban areas generally remain same throughout the year. However, the different trend of NH3, NO2 and particulate N were recorded at the rural site, which suggests more impact of local emission sources as compared to meteorology such as fertilizer application, biomass burning, microbial emission etc. A strong correlation of NO2 with pWSTN has confirmed the role of NO2 oxidation in the atmospheric nitrogenous aerosol formation over urban sites. Whereas, no correlation between NH3, NO2 and pWSTN at rural site could be attributed to the least NOx concentrations or alternatively organic N compounds might be contributing to the particulate N formation. Due to high levels, NH3 was found to be actively involved in the particulate formation at the Prayagraj site. However, no correlation at Madhupur and Delhi has shown the gas phase oxidation of NH3. Seasonal meteorology has also shown its impact in the relative abundance of particulate N in ambient air at all three sites. The present study will be helpful in reducing uncertainties while assessing the effects of atmospheric N aerosols in degrading air quality, impacting regional climate and sensitive ecosystems.
Acknowledgement
We sincerely thank the financial support received from CSIR, DST-PURSE and CIF Facility in School of Environmental Sciences, Jawaharlal Nehru University, New Delhi to conduct this research work.
References
- Galloway JN. Nitrogen mobilization in Asia. Nutr Cycl Agroecosystems. 2000;57(1):1-12. doi:10.1023/A:1009832221034
CrossRef - Gruber N, Galloway JN. An Earth-system perspective of the global nitrogen cycle. Nature. 2008;451(7176):293-296. doi:10.1038/nature06592
CrossRef - Russell KM, Galloway JN, MacKo SA, Moody JL, Scudlark JR. Sources of nitrogen in wet deposition to the Chesapeake bay region. Atmos Environ. 1998;32(14-15):2453-2465. doi:10.1016/S1352-2310(98)00044-2
CrossRef - Kanakidou M, Myriokefalitakis S, Tsigaridis K. Aerosols in atmospheric chemistry and biogeochemical cycles of nutrients. Environ Res Lett. 2018;13(6). doi:10.1088/1748-9326/aabcdb
CrossRef - Schwartz SE, White WH. Solubility equilibria of the nitrogen oxides and oxyacids in dilute aqueous solution. Adv Environ Sci Eng. 1981;4:1-45. https://inis.iaea.org/search/search.aspx?orig_q=RN:14755115. Accessed August 4, 2020.
- Pathak RK, Wu WS, Wang T. Summertime PM 2.5 ionic species in four major cities of China: nitrate formation in an ammonia-deficient atmosphere. Atmos Chem Phys. 2009;9(5):1711-1722. doi:10.5194/acp-9-1711-2009
CrossRef - Finlayson-Pitts B, Jr JP. Chemistry of the upper and lower atmosphere. Choice Rev Online. 2000;37(10):37-5725-37-5725. doi:10.5860/choice.37-5725
CrossRef - Schwartz SE. Gas- and aqueous-phase chemistry of HO2 in liquid water clouds ( Henry’s law). J Geophys Res. 1984;89(D7):11589-11598. doi:10.1029/jd089id07p11589
CrossRef - Crutzen PJ. The role of NO and NO2 in the chemistry of the troposphere and stratosphere. Annu Rev earth Planet Sci Vol 7. 1979;7:443-472. doi:10.1146/annurev.ea.07.050179.002303
CrossRef - Olszyna KJ, Bailey EM, Simonaitis R, Meagher JF. O3 and NOy relationships at a rural site. J Geophys Res. 1994;99(D7). doi:10.1029/94jd00739
CrossRef - Schade GW, Crutzen PJ. Emission of aliphatic amines from animal husbandry and their reactions: Potential source of N2O and HCN. J Atmos Chem. 1995;22(3):319-346. doi:10.1007/BF00696641
CrossRef - Cornell SE, Jickells TD, Cape JN, Rowland AP, Duce RA. Organic nitrogen deposition on land and coastal environments: A review of methods and data. Atmos Environ. 2003;37(16):2173-2191. doi:10.1016/S1352-2310(03)00133-X
CrossRef - Gorzelska K, Galloway JN. Amine nitrogen in the atmospheric environment over the North Atlantic Ocean. Global Biogeochem Cycles. 1990;4(3):309-333. doi:10.1029/GB004i003p00309
CrossRef - Neff JC, Holland EA, Dentener FJ, McDowell WH, Russell KM. The origin, composition and rates of organic nitrogen deposition: A missing piece of the nitrogen cycle? In: Biogeochemistry. Vol 57-58. ; 2002:99-136. doi:10.1023/A:1015791622742
CrossRef - Matsumoto K, Uematsu M. Free amino acids in marine aerosols over the western North Pacific Ocean. Atmos Environ. 2005;39(11):2163-2170. doi:10.1016/j.atmosenv.2004.12.022
CrossRef - Harrison RM, Yin J. Particulate matter in the atmosphere: Which particle properties are important for its effects on health? Sci Total Environ. 2000;249(1-3):85-101. doi:10.1016/S0048-9697(99)00513-6
CrossRef - Cape JN, Cornell SE, Jickells TD, Nemitz E. Organic nitrogen in the atmosphere - Where does it come from? A review of sources and methods. Atmos Res. 2011;102(1-2):30-48. doi:10.1016/j.atmosres.2011.07.009
CrossRef - Phoenix GK, Hicks WK, Cinderby S, et al. Atmospheric nitrogen deposition in world biodiversity hotspots: The need for a greater global perspective in assessing N deposition impacts. Glob Chang Biol. 2006;12(3):470-476. doi:10.1111/j.1365-2486.2006.01104.x
CrossRef - Singh S, Kulshrestha UC. Abundance and distribution of gaseous ammonia and particulate ammonium at Delhi, India. Biogeosciences. 2012;9:5023-5029. doi:10.5194/bg-9-5023-2012
CrossRef - Tiwari R, Kulshrestha U. Wintertime distribution and atmospheric interactions of reactive nitrogen species along the urban transect of Delhi – NCR. Atmos Environ. 2019;209:40-53. doi:10.1016/j.atmosenv.2019.04.007
CrossRef - Singh S, Kulshrestha UC. Rural versus urban gaseous inorganic reactive nitrogen in the Indo-Gangetic plains (IGP) of India. Environ Res Lett. 2014;9(12). doi:10.1088/1748-9326/9/12/125004
CrossRef - Behera SN, Sharma M, Aneja VP, Balasubramanian R. Ammonia in the atmosphere: A review on emission sources, atmospheric chemistry and deposition on terrestrial bodies. Environ Sci Pollut Res. 2013;20(11):8092-8131. doi:10.1007/s11356-013-2051-9
CrossRef - Bouwman AF, Lee DS, Asman WAH, Dentener FJ, Van Der Hoek KW, Olivier JGJ. A global high-resolution emission inventory for ammonia. Global Biogeochem Cycles. 1997;11(4):561-587. doi:10.1029/97GB02266
CrossRef - Vet R, Artz RS, Carou S, et al. A global assessment of precipitation chemistry and deposition of sulfur, nitrogen, sea salt, base cations, organic acids, acidity and pH, and phosphorus. Atmos Environ. 2014;93:3-100. doi:10.1016/j.atmosenv.2013.10.060
CrossRef - Wang R, Ye X, Liu Y, et al. Characteristics of atmospheric ammonia and its relationship with vehicle emissions in a megacity in China. Atmos Environ. 2018;182:97-104. doi:10.1016/j.atmosenv.2018.03.047
CrossRef - Sharma SK, Kumar M, Rohtash, et al. Characteristics of ambient ammonia over Delhi, India. Meteorol Atmos Phys. 2014;124(1-2):67-82. doi:10.1007/s00703-013-0299-8
CrossRef - Bari A, Ferraro V, Wilson LR, Luttinger D, Husain L. Measurements of gaseous HONO, HNO3, SO2, HCl, NH3, particulate sulfate and PM2.5 in New York, NY. Atmos Environ. 2003;37(20):2825-2835. doi:10.1016/S1352-2310(03)00199-7
CrossRef - Biswas KF, Ghauri BM, Husain L. Gaseous and aerosol pollutants during fog and clear episodes in South Asian urban atmosphere. Atmos Environ. 2008;42(33):7775-7785. doi:10.1016/j.atmosenv.2008.04.056
CrossRef - Balasubramanian R, Behera SN, Betha R. Insights into chemical coupling among acidic gases, ammonia and secondary inorganic aerosols. Aerosol Air Qual Res. 2013;13(4):1282-1296. doi:10.4209/aaqr.2012.11.0328
CrossRef - Reche C, Viana M, Karanasiou A, et al. Urban NH3 levels and sources in six major Spanish cities. Chemosphere. 2015;119:769-777. doi:10.1016/j.chemosphere.2014.07.097
CrossRef - Ding MM, Zhou JN, Liu BX, et al. Pollution Characteristics of NH4+,NO3-,SO42- in PM2.5and Their Precursor Gases During 2015 in an Urban Area of Beijing. Huanjing Kexue/Environmental Sci. 2017;38(4):1307-1316. doi:10.13227/j.hjkx.201607005
- Meng Z, Lin W, Zhang R, Han Z, Jia X. Summertime ambient ammonia and its effects on ammonium aerosol in urban Beijing, China. Sci Total Environ. 2017;579:1521-1530. doi:10.1016/j.scitotenv.2016.11.159
CrossRef - Khemani LT, Momin GA, Singh G. Variations in trace gas concentrations in different environments in India. Pure Appl Geophys PAGEOPH. 1987;125(1):167-181. doi:10.1007/BF00878620
CrossRef - Kapoor RK, Singh G, Tiwari S. Ammonia concentration vis-a-vis meteorological conditions at Delhi, India. Atmos Res. 1992;28(1):1-9. doi:10.1016/0169-8095(92)90002-R
CrossRef - Gupta A, Kumar R, Kumari KM, Srivastava SS. Measurement of NO2, HNO3, NH3 and SO 2 and related particulate matter at a rural site in Rampur, India. Atmos Environ. 2003;37(34):4837-4846. doi:10.1016/j.atmosenv.2003.07.008
CrossRef - Kumar R, Gupta A, Maharaj Kumari K, Srivastava SS. Simultaneous measurements of SO2, NO2, HNO 3 and NH3: Seasonal and spatial variations. Curr Sci. 2004;87(8):1108-1115.
- Behera SN, Sharma M. Investigating the potential role of ammonia in ion chemistry of fine particulate matter formation for an urban environment. Sci Total Environ. 2010;408(17):3569-3575. doi:10.1016/j.scitotenv.2010.04.017
CrossRef - Sharma A, Singh S, Kulshrestha UC. Aerosol-trace gases interactions and their role in air quality control of Delhi city (India). Arab J Geosci. 2018;11(13). doi:10.1007/s12517-018-3695-z
CrossRef - Saraswati, Sharma SK, Saxena M, Mandal TK. Characteristics of gaseous and particulate ammonia and their role in the formation of secondary inorganic particulate matter at Delhi, India. Atmos Res. 2019;218:34-49. doi:10.1016/j.atmosres.2018.11.010
CrossRef - Reddy S.K. B, Raghavendra Kumar K, Balakrishnaiah G, et al. Analysis of diurnal and seasonal behavior of surface ozone and its precursors (NOx) at a semi-arid rural site in southern India. Aerosol Air Qual Res. 2012;12(6):1081-1094. doi:10.4209/aaqr.2012.03.0055
CrossRef - Mishra M, Kulshrestha UC. Extreme air pollution events spiking ionic levels at urban and rural sites of Indo-Gangetic plain. Aerosol Air Qual Res. 2020;20(6):1266-1281. doi:10.4209/aaqr.2019.12.0622
CrossRef - Kawamura K, Kobayashi M, Tsubonuma N, Mochida M, Watanabe T, Lee M. Organic and inorganic compositions of marine aerosols from East Asia: Seasonal variations of water-soluble dicarboxylic acids, major ions, total carbon and nitrogen, and stable C and N isotopic composition. Geochemical Soc Spec Publ. 2004;9(C):243-265. doi:10.1016/S1873-9881(04)80019-1
CrossRef - Hegde P, Kawamura K. Chemical Constituents of Carbonaceous and Nitrogen Aerosols over Thumba Region, Trivandrum, India. Arch Environ Contam Toxicol. 2017;73(3):456-473. doi:10.1007/s00244-017-0426-5
CrossRef - Nakamura T, Ogawa H, Maripi DK, Uematsu M. Contribution of water soluble organic nitrogen to total nitrogen in marine aerosols over the East China Sea and western North Pacific. Atmos Environ. 2006;40(37):7259-7264. doi:10.1016/j.atmosenv.2006.06.026
CrossRef - Zhang Y, Liu XJ, Fangmeier A, Goulding KTW, Zhang FS. Nitrogen inputs and isotopes in precipitation in the North China Plain. Atmos Environ. 2008;42(7):1436-1448. doi:10.1016/j.atmosenv.2007.11.002
CrossRef - Zhang Y, Song L, Liu XJ, et al. Atmospheric organic nitrogen deposition in China. Atmos Environ. 2012;46:195-204. doi:10.1016/j.atmosenv.2011.09.080
CrossRef - Srinivas B, Sarin MM, Sarma VVSS. Atmospheric dry deposition of inorganic and organic nitrogen to the Bay of Bengal: Impact of continental outflow. Mar Chem. 2011;127(1-4):170-179. doi:10.1016/j.marchem.2011.09.002
CrossRef - Violaki K, Sciare J, Williams J, Baker AR, Martino M, Mihalopoulos N. Atmospheric water-soluble organic nitrogen (WSON) over marine environments: A global perspective. Biogeosciences. 2015;12(10):3131-3140. doi:10.5194/bg-12-3131-2015
CrossRef - Bikkina S, Kawamura K, Sarin M. Stable carbon and nitrogen isotopic composition of fine mode aerosols (PM2.5) over the Bay of Bengal: Impact of continental sources. Tellus, Ser B Chem Phys Meteorol. 2016;68(1). doi:10.3402/tellusb.v68.31518
CrossRef - Kulshrestha UC, Sarkar AK, Srivastava SS, Parashar DC. Investigation into atmospheric deposition through precipitation studies at New Delhi (India). Atmos Environ. 1996;30(24):4149-4154. doi:10.1016/1352-2310(96)00034-9
CrossRef - Singh S, Sharma A, Kumar B, Kulshrestha UC. Wet deposition fluxes of atmospheric inorganic reactive nitrogen at an urban and rural site in the Indo-Gangetic Plain. Atmos Pollut Res. 2017;8(4):669-677. doi:10.1016/j.apr.2016.12.021
CrossRef - Singh N, Banerjee T, Raju MP, et al. Aerosol chemistry, transport and climatic implications during extreme biomass burning emissions over Indo-Gangetic Plain Aerosol chemistry, transport, and climatic implications during extreme biomass burning emissions over the Indo-Gangetic Plain. Atmos Chem Phys. 2018;18:14197-14215. doi:10.5194/acp-2018-446
CrossRef - Rajput P, Singh DK, Singh AK, Gupta T. Chemical composition and source-apportionment of sub-micron particles during wintertime over Northern India: New insights on influence of fog-processing. Environ Pollut. 2018;233:81-91. doi:10.1016/j.envpol.2017.10.036
CrossRef - Pichlmayer F, Schöner W, Seibert P, Stichler W, Wagenbach D. Stable isotope analysis for characterization of pollutants at high elevation alpine sites. Atmos Environ. 1998;32(23):4075-4085. doi:10.1016/S1352-2310(97)00405-6
CrossRef - Kulshrestha UC, Sarkar AK, Srivastava SS, Parashar DC. Investigation into atmospheric deposition through precipitation studies at New Delhi (India). Atmos Environ. 1996;30(24):4149-4154. doi:10.1016/1352-2310(96)00034-9
CrossRef - Nehir M, Koçak M. Atmospheric water-soluble organic nitrogen (WSON) in the eastern Mediterranean: Origin and ramifications regarding marine productivity. Atmos Chem Phys. 2018;18(5):3603-3618. doi:10.5194/acp-18-3603-2018
CrossRef - Wang M, Kong W, Marten R, et al. Rapid growth of new atmospheric particles by nitric acid and ammonia condensation. nature.com. https://www.nature.com/articles/s41586-020-2270-4. Accessed December 30, 2020.


