Polycyclic Aromatic Hydrocarbons in Ado-Ekiti Roadside Soil, Nigeria: Distribution, Source Identification, Composition Profiles, and Toxic Potential
Olayinka Abidemi Ibigbami
*

http://dx.doi.org/10.12944/CWE.17.1.20
The study considered the level, origin with toxic potentials of PAHs in soil roadside of Ado-Ekiti, Nigeria. Gas chromatographic technique was employed for the identification of PAHs after extraction and silica gel cleanup. Average concentration of the PAHs ranged from ND – 51.6 ± 46.7µg/kg, while total polycyclic aromatic hydrocarbons (TPAHs) ranged of 61.8±32.3 - 204±28.0 µg/kg with contamination pattern of ADY ? AJI ? EKSU ? NNPC. The percentage distribution of LMW ranged from 17.3 – 54.2%, while the HMW-PAHs showed 46.0 - 82.7%. The PAHs pattern was dominated majorly by 5- and 6- ring with distribution range of 15.1 and 43.2%. The overall diagnostic ratios of the soils suggested pyrogenic, coal/wood/grass/vehicular combustion in most cases. To evaluate the toxicity of the PAHs in the samples, PAHs toxic equivalence factors (TEFs) revealed that carcinogenic PAHs contributed majorly (over 95%) to toxicity of the soil.
Copy the following to cite this article:
Ibigbami O. A. Polycyclic Aromatic Hydrocarbons in Ado-Ekiti Roadside Soil, Nigeria: Distribution, Source Identification, Composition Profiles, and Toxic Potential. Curr World Environ 2022;17(1). DOI:http://dx.doi.org/10.12944/CWE.17.1.20
Copy the following to cite this URL:
Ibigbami O. A. Polycyclic Aromatic Hydrocarbons in Ado-Ekiti Roadside Soil, Nigeria: Distribution, Source Identification, Composition Profiles, and Toxic Potential. Curr World Environ 2022;17(1).
Download article (pdf)
Citation Manager
Publish History

Introduction
Ubiquitous nature of PAHs in terrestrial and marine environment made them an important.1 PAHs are concern due to persistent nature. The EU and USEPA have prioritized PAHs due to carcinogenic and mutagenic properties.2 High and low molecular weight are the two class of PAHs. The 4 to 6 aromatic rings are HMW with less bio-degradable properties, while LMW-PAHs consists 2 to 3 rings with less carcinogen properties than HMW types.3 US Environment Protection Agency have identified sixteen (16) PAHs as priority pollutants.4 PAHs often contain elevated level of HMW and fewer LMW-PAHs.5 PAHs could be transported through the atmosphere to remote areas with increase in general background level of soils 6-7 and lake sediments 8 -11 where they accumulate due to their stability. Soils and river sediments often becomes environmental burden of these compounds.12
In Nig, composeria,13 and other countries, Australia,14 Germany,15 USA,16 Korea,17 Brazil,18 China, 19 - 22 Norway,23 Malaysia,24 Czech Republic,25 India, 26-28 , Slovakia,29 studies of PAHs in soil have been reported. Their toxicity and widespread distribution have made PAHs important globally. The number of PAHs in city soil and propinquity of the compounds in soil could lead to life exposure.30 The study, therefore, assesses the distribution, sources, make-up, and toxic potentials of PAHs in soil roadside soil of Ado-Ekiti in Nigeria.
Materials and Methods
The Study Area
Soil were sampled from various locations in Ado-Ekiti, capital city of Ekiti State in Nigeria. The State covers an estimated land area of about 6,353 km2 (Wikipedia), Ado-Ekiti the capital city covers about 732 km2 of this area and lies between latitude 7o 37’16’’ N and longitude 5o 13’17’’ E. The city is a major trade center for farm produce. The major means of transportation in Ado-Ekiti is by road. Figure 1, depicts the map of the area indicating the sampling spots.
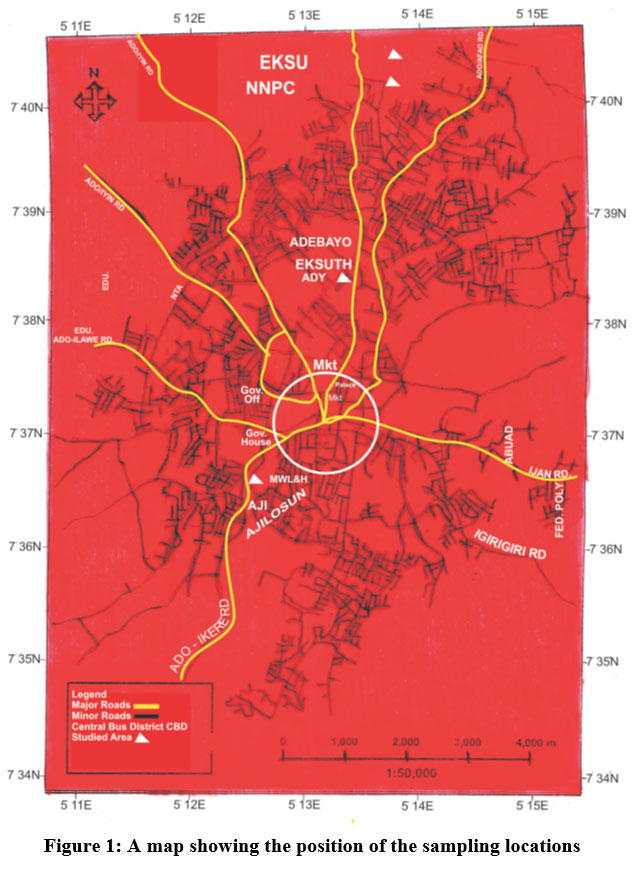 |
Figure 1: A map showing the position of the sampling locations. |
Sample Collection and Preparation
Samples of roadside soils were taken from various locations within Ado-Ekiti in June, 2017. Locations, where soil samples were collected include Adebayo (ADY), Ajilosun (AJI), Ekiti State University (EKSU) gate and Nigerian National Petroleum Corporation (NNPC) mega station roads. Table 1 showed the coordinates of the sampling sites.
Table 1: The coordinates of the sampling area.
|
Sampling area |
Geographical locations of the sampling area |
Distance between the sampling area (m) |
|
AJI |
7o 36’ 29’’ N 5o 13’17’’ E 7o 36. 19’’ N 5o 13’21’’ E |
40 |
|
ADY |
7o 38’ 53’’ N 5o 13’30’’ E 7o 38’ 30’’ N 5o 13’20’’ E |
40 |
|
EKSU |
7o 42’ 52’’ N 5o 15’38’’ E 7o 42’ 55’’ N 5o 15’40’’ E |
40 |
|
NNPC |
7o 40’ 44’’ N 5o 14’40’’ E 7o 40’ 49’’ N 5o 14’44’’ E |
40 |
AJI = Ajilosun Road; ADY = Adebayo Road; EKSU = Ekiti State University Road; NNPC = Nigerian National Petroleum Corporation Road.
Two composite samples were collected at each site with about 40 m between them. Composite soil samples were representative of four different spots within each area. These samples (four) were polled together to form a composite one. Soil samples were taken at 15cm depth. The soil samples collected from each area were placed appropriately in labeled glass sample bottles. Samples were later air-dried in the laboratory, ground in an agate mortar, and sieved with mesh size 2 mm. The sieved samples were later stored in glass bottles.
Extraction of PAHs in the sample with Clean-Up Procedure
Sample extraction and cleanup were done according to USEPA (method 3550C). 31 Twenty gramme each of dried soil sample and anhydrous Na2SO4 (1:1 g/g) was ultrasonically extracted using 50 mL mixture of 1:1 v/v of n-hexane: acetone for 45 min. The supernatants were collected and extraction repeated three times with fresh 50 mL mixture. The supernatants were collected together and concentrated by a rotary evaporator to about 2 mL. The extracts was dissolved in n-hexane (5 mL) and concentrated in rotary evaporator to 2 mL at 40 oC.
Clean-up column was developed by slurring about 10g of activated silica gel (about 100-200 mesh, activated at 200 oC for 16 h) with n-hexane into a chromatography column. About 1g of anhydrous Na2SO4 was added and pre-eluted with 20 mL of n-hexane. The extract were moved quantitatively to the column and eluted using 25 mL of 2:3 v/v of n-hexane/dichloromethane. The hexane/dichloromethane extract was concentrated using rotary evaporator, adjusted to 2 mL with n-hexane for gas chromatographic (GC) analysis. Table 2 depicted the operating conditions of gas chromatography.
GC Operating Condition
Table 2: Operating conditions of GC.
|
GC type |
Agilent 7890A |
|
Carrier gas |
Helium |
|
|
|
|
Carrier gas flow rate |
1.2 ml/min |
|
Inlet mode |
Split less |
|
Inlet temperature |
250 oC |
|
Column |
Fused silica HP5 (30 m x 320 µm x 0.25µm) |
|
Oven temp |
60o C for 1 minute |
|
First ramping |
12 o C/min for 15 min, continued for 2 min |
|
Second ramping |
8 0 C/min for 10 min, continued for 5 min |
|
Detector |
Flame ionization detector (FID) |
|
Detector temp. |
325 o C |
|
Total run time |
32.25 minutes |
Limit of Detection (LOD) and Limit of Quantification (LOQ)
Four concentrations (standard) ranging between 0.2 and 1 mgL-1 were used to prepare calibration graph. Linear calibration curves was gotten in the tested concentration of PAHs standard. The LOD were based on a signal- to-noise ratio of 3 and the LOQ on the signal-to-noise ratio of 10.
Quality assurance
Correlation coefficients were determined for analysed compounds. Values with ? 0.95 correlation coefficients were rejected while, those ? 0.95 were accepted. Values of correlation coefficient were between 0.9993 and 0.9999. They thus met the quality assurance standard and made the results acceptable.
Statistical analysis
Statistical analysis used includes mean, corresponding standard deviation and coefficient of variation. Data obtained were subjected to Analysis of variance (ANOVA) using Statistical Software (SPSS Version 17).
Results and Discussion
Distribution of PAHs in Soil
The PAHs (µg/kg) level in soil from the four selected roadsides in Ado-Ekiti are depicted in Table 3. The average level of PAHs ranged from ND – 51.6 ± 46.7µg/kg with the highest recorded for naphthalene in Ajilosun. The PAHs concentration (µg/kg) ranged from 1.11±0.33 (acenaphthylene) - 51.6±46.7 (naphthalene) in Ajilosun. 1.82±0.30 (benzo(a)anthracene) - 46.6±12.7 (benzo(g,h,i)perylene) in Adebayo, 1.33±1.88 (pyrene) - 13.4±4.20 (benzo(a)pyrene) in EKSU and ND - 14.5±7.44 (benzo(g,h,i)perylene) in NNPC. The TPAHs ranged from 61.8±32.3 - 204±28.0 µg/kg with contamination pattern of ADY ? AJI ? EKSU ? NNPC. The presence of carcinogenic PAHs was highly observed in the samples. The seven carcinogenic PAHs were between 34.4 ± 17.9µg/kg (NNPC) and 101 ± 20.2µg/kg (ADY). The carcinogenic PAHs in the soil was in order: EKSU (60.4%) ? NNPC (55.7%) ? ADY (49.5%) ? AJI (30.8%). A high level of spatial variation was mostly recorded for most PAHs as revealed by the coefficient of variation. Only seven PAHs exhibited low (0.20 - 26.1%) spatial variation in Ajilosun.
Table 3: PAHs (µgkg-1) concentrations of roadside soil from the study area.
|
|
AJI |
ADY |
EKSU |
NNPC |
|
Naphthalene |
51.6 ± 46.9 (90.7) |
11.4 ± 2.37 (20.8) |
10.3 ± 9.04 (90.1) |
1.90 ± 2.67(141) |
|
Acenaphthylene |
1.11 ± 0.33 (20.70 |
8.71 ± 3.00 (34.4) |
2.12 ± 0.35 (16.5) |
0.51 ± 0.71 (139) |
|
Acenaphthalene |
4.06 ± 2.18 (43.7) |
5.76 ± 3.96 (68.8) |
4.89 ± 1.88 (38.5) |
2.30 ± 1.20 (52.2) |
|
Fluorene |
5.05 ± 2.57 (50.9) |
7.02 ± 1.14 (16.2) |
5.20 ± 1.97 (37.9) |
3.10 ± 0.66 (21.3) |
|
Anthracene |
1.57 ± 0.51 (32.5) |
4.78 ± 1.22 (25.5) |
2.03 ± 1.80 (88.7) |
2.06 ± 0.16 (7.77) |
|
Phenanthrene |
1.61 ± 0.40 (26.1) |
3.20 ± 0.42 (13.1) |
3.23 ± 1.02 (31.6) |
0.80 ± 1.18 (148) |
|
Fluoranthene |
1.73 ± 0.60 (34.1) |
6.72 ± 2.39 (35.6) |
3.28 ± 3.16 (96.3) |
0.85 ± 0.16 (18.8) |
|
Pyrene |
2.53 ± 2.55 (101) |
8.92 ± 1.85 (20.7) |
1.33 ± 1.88 (141) |
1.35 ± 0.58 (43.0) |
|
Benzo(a)anthracene* |
4.07 ± 0.52 (12.8) |
1.82 ± 0.30 (16.5) |
7.80 ± 3.25 (41.7) |
2.23 ± 1.13 (50.7) |
|
Chrysene* |
1.14 ± 0.06 (5.30) |
5.19 ± 1.10 (21.2) |
1.97 ± 0.38 (19.3) |
1.56 ± 0.08 (5.13) |
|
Benzo(b)fluoranthene* |
5.33 ± 1.25 (23.5) |
19.4 ± 4.74 (24.5) |
10.1 ± 4.64 (46.0) |
6.21 ± 4.80 (77.3) |
|
Benzo(k)fluoranthene* |
3.92 ± 1.53 (39.0) |
3.79 ± 1.93 (50.9) |
6.53 ± 3.79 (50.0) |
3.30 ± 0.09 (2.73) |
|
Benzo(a)pyrene* |
7.42 ± 1.00 (13.5) |
23.6 ± 6.23 (26.4) |
13.4 ± 4.20 (31.4) |
7.81 ± 4.58 (58.6) |
|
Dibenzo(a,h)anthracene* |
1.55 ± 1.10 (71.0) |
5.63 ± 3.14 (55.8) |
7.43 ± 10.5 (141) |
ND |
|
Benzo(g, h, i)perylene |
13.8 ± 0.02 (0.20) |
46.6 ± 12.7 (27.2) |
12.2 ± 8.32 (68.3) |
14.5 ± 7.44 (51.3) |
|
Indenol (1,2,3, cd)pyrene* |
13.6 ± 2.20 (16.2) |
41.5 ± 7.17 (17.3) |
12.2 ± 7.28 (34.4) |
13.3 ± 7.40 (55.5) |
|
∑PAHs |
120 ± 61.6 (51.3) |
204 ± 28.0 (13.7) |
104 ± 39.2 (39.2) |
61.8 ± 32.3 (52.3) |
|
∑7C-PAHs |
37.0 ± 5.59 (15.1) |
101 ± 20.2 (19.9) |
68.3 ± 26.4 (38.7) |
34.4 ± 17.9 (52.1) |
|
∑LMW-PAHs |
65.0 ± 52.9 (81.4) |
40.9 ± 0.54 (1.32) |
27.7 ± 16.1 (58.4) |
10.6 ± 6.51 (61.2) |
|
∑HMW-PAHs |
55.1 ± 8.71 (15.8) |
163 ± 28.6 (17.5) |
76.2 ± 23.2 (27.2) |
51.1 ± 25.8 (50.4) |
Mean ± SD (CV%); ND = Not detected; *= Carcinogenic PAHs; ∑7C-PAHs = Total 7 carcinogenic PAHs; ∑HMW-PAHs = Total high molecular PAHs; ∑LMW-PAHs = Total molecular PAHs.
Five (Chrysene, fluorene, anthracene, fluoranthene and benzo(k)fluoranthene) in NNPC (2.73- 21.3%), three (acenaphthylene, phenanthrene and chrysene) in EKSU, while most PAHs in Adebayo exhibited moderate spatial variations. The level (0.51 – 51.6 µgkg-1) were comparably lower than those reported for soil in Nigeria (5649 µgkg-1)13, Delhi, India (41.1 – 9145 µgkg-1)28, USA (58680 µgkg-1)16, Hong kong, China (2- 554 µgkg-1)19, Malaysia (1450 µgkg-1)24, Shanghai, China (3780 µgkg-1)22, Czech Republic (860 -10840 µgkg-1)25, Australia (3300 µgkg-1)14, India (4694 ± 3028 µgkg-1,26; 6962 ± 4823 µgkg-1)27, Germany (16000µgkg-1)15, Korea (15800 µgkg-1)17, China (81820 ± 796200 µgkg-1,20 ; 3780 µgkg-1)22 , while the soil in Brazil (96 µgkg-1)18 is comparable to the present study. The concentration trends of the carcinogenic PAHs were in order: I123P ? BaP ? BbF ? BaA ? BkF ? DahA ? Chry in Ajilosun; I123P ? BaP ? BbF ? DahA ? Chry ? BkF ? BaF in Adebayo; while BaP ? I123P ? BbF ? BaA ? DahA ? BkF ? Chry in EKSU and I123P ? BaP ? BbF ? BkF ? BaA ? Chry in NNPC roadside. The percentage distribution of LMW in the study areas ranged from 17.3 – 54.2% with a concentration pattern of Ajilosun ? EKSU ? Adebayo ? NNPC, while the HMW-PAHs ranged from 46.0 – 82.7% with concentration a pattern of NNPC ? Adebayo ? EKSU ? Ajilosun. The percentage distribution of LMW-PAHs showed Ajilosun (54%), EKSU (24.3%), Adebayo (20.0%) and NNPC (17.3%), while the HMW-PAHs reflected NNPC (82.7%), Adebayo (80.0%), EKSU (75.3%) and Ajilosun (46.0%). Based on European classification system of soil contamination, 32 ∑16PAHs ? 200µg/kg showed no contamination, 200 - 600 µg/kg corresponds to weak, 600 - 1000 µg/kg revealed moderate, while ? 1000 µg/kg shows heavy contamination. All the sampling sites except Adebayo indicate no contamination, where its PAHs concentrations revealed ? 200 µg/kg and weak contamination.
One-way analysis of variance (ANOVA) revealed that the p-value = 0.005 (? 0.05 level of significant), this showed enough evidence that the parameters differs. Further analysis also revealed significant variations (p ? 0.05) in the levels of naphthalene, fluoranthene, pyrene, benzo(a)anthracene, indeno(1,2,3,cd)pyrene, benzo(b)fluoranthene,, benzo(a)pyrene, benzo(g,h,i)perylene and acenapthylene, while the other PAHs showed no significant variations among the sampling locations. The significant variations could be attributed to some factors such as physiochemical properties (soil pH, clay content and OM) of the soil which could influence the dynamics and fate of both organic and inorganic pollutants in soil. Different accumulation and distribution pattern of some of these PAHs in soil could also contribute to the significant level.
Table 4 showed the recommended guidelines of PAHs in soils. Polycyclic aromatic hydrocarbons level in the study areas was significantly lower than the National Oceanic Atmospheric Administration, NOAA33 and Canadian Council of Ministers of Environment CCME34 guidelines for the residential, community, and industrial soils.
Table 4: PAHs guidelines in soil (µgkg-1) in comparison with the present study.
|
|
Soil guidelines |
Present study |
|
|
Naphthalene |
5000 |
600 – 22000 |
1.90 – 51.6 |
|
Acenaphthylene |
- |
- |
0.51 – 8.71 |
|
Acenaphthalene |
- |
- |
2.30 - 5.76 |
|
Fluorene |
- |
- |
3.10 – 7.02 |
|
Anthracene |
- |
- |
1.57 – 4.78 |
|
Phenanthrene |
5000 |
5 × 10³ - 50 × 103 |
0.80 – 3.23 |
|
Fluoranthene |
- |
- |
0.85 – 6.72 |
|
Pyrene |
1000 |
10 × 103 - 100 × 103 |
1.33 – 8.92 |
|
Benzo(a)anthrancene |
1000 |
- |
1.82 – 7.80 |
|
Chrysene |
- |
1000 - 10 × 103 |
1.14 - 5.19 |
|
Benzo(b)fluoranthene |
1000 |
1000 - 10 × 103 |
5.33 – 19.4 |
|
Benzo(k)fluoranthene |
1000 |
1000 - 10 × 103 |
3.30 – 6.53 |
|
Benzo(a)pyrene |
1000 |
700 |
7.42 – 23.6 |
|
Dibenzo(a,h)anthracene |
1000 |
- |
ND – 7.43 |
|
Benzo(g,h,i)perylene |
- |
1000 - 10 × 103 |
12.2 – 46.6 |
|
Indeno (1,2,3-cd)pyrene |
1000 |
1000 - 10 × 103 |
12.2 – 41.5 |
The percentage distributions of PAHs compositions are depicted in Table 5. Adebayo, EKSU and NNPC exhibited a greater percentage of high molecular PAHs with a highest amount of 5- and 6- ringed PAHs. Ajilosun showed highest level of 2- and 6- ringed PAHs. Generally, the automobile smoke or exhaust is seen as the major fount or origin of high molecular PAHs. 35-36
Table 5: Percentage distribution of PAHs composition in the sampling area.
|
No of ring |
AJI |
ADY |
EKSU |
NNPC |
|
2 |
51.6 (43.0) |
11.4 (5.59) |
10.3 (9.90) |
1.93 (3.12) |
|
3 |
13.4 (11.2) |
14.5 (29.5) |
17.5 (16.8) |
8.77 (14.2) |
|
4 |
9.47 (7.89) |
22.7 (11.1) |
14.4 (13.8) |
5.99 (9.69) |
|
5 |
18.2 (15.1) |
52.4 (25.7) |
37.5 (26.1) |
17.3 (28.0) |
|
6 |
27.4 (22.8) |
88.1 (43.2 |
24.4 (23.5) |
27.8 (45.0) |
Levels (%)
The three and four-ringed PAHs ranged from 11.2% to 16.8% and 7.89% to 13.8% in Ajilosun and EKSU. The ring wise order of their concentration (%) was 6 (43.2% and 45.0%) ? 5 (25.7% and 28.0%) ? 3 (14.5% and 14.2%) ? 4 (11.1% and 9.69%) ? 2 (5.50% and 3.12%) in Adebayo and NNPC, while 5 (36.1%) ? 6 (23.5%) ? 3 (16.8%) ? 4 (13.7%) ? 2 (9.90%) in Adebayo and 2 (43.0%) ? 6 (22.8%) ? 5 (15.1%) ? 3 (11.2%) ? 4 (7.89%) in Ajilosun. This revealed that 5- and 6-ring were mostly predominant from the study areas. Sun et al.37 revealed that PAHs of high molecular weight gives rise by high-temperature combustion, while low molecular weight gives rise low combustion temperature.
Source Identification of PAHs
PAHs ratios have been used to demonstrate source identification. 38-40 A high percentage of HMW-PAHs to LMW-PAHs was observed in most cases. Higher proportion of HMW-PAHs was observed in the sampling areas except Ajilosun that showed 54.3% of LMW-PAHs. The results was characterized by the predominance of high molecular weights. The ratios of low molecular weight to high molecular weight were ? 1.0 in NNPC, EKSU, and Adebayo, while Ajilosun reflected 1.18. Isomer ratios of IcdP/(IcdP+BghP), Ant/(Ant+Phe), BaA/(BaA+Chry), Flt/(Flt/Pyr), and BaP/(BaP/BaP+Chr) was used for the source identification. Ratios for PAHs source identification were depicted in Table 6. The PAHs ratio for Ant/(Ant + Phe) and Flt/(Flt/Pyr) showed greater than 0.1 in all the sampling sites and ≥ 0.4 – 0.5 (except EKSU), this indicates pyrogenic (combustion) source of the PAHs in the sampling areas, Flt/(Flt/Pyr) in EKSU indicate combustion of biomass, wood, coal, and grass.
Table 6: Diagnostic ratio for PAHs source identification.
|
PAHs ratio |
Values |
Indication sources |
Present study AJI ADY EKSU NNPC |
Reference |
|||
|
BaP/ BghiP |
? 0.6 ? 0.6 |
Non traffic source Traffic source |
0.54 |
0.51 |
1.10 |
0.54 |
41 |
|
IcdP/ (IcdP + BghiP) |
? 0.2 0.2 - 0.5 ? 0.5 |
Petrogenic Fossil fuel (automobile) Combustion (grass, coal and wood) |
0.49 |
0.47 |
0.50 |
0.48 |
38 |
|
Flt/ (Flt/Pyr) |
? 0.4 ≥ 0.4 - 0.5 ? 0.5 |
Petrogenic Pyrogenic Biomass, coal combustion |
0.41 |
0.43 |
0.71 |
0.40 |
38 39 24 |
|
Ant/(Ant/Phe) |
? 0.1 ? 0.1 |
Petrogenic Pyrogenic (Combustion) |
0.49 |
0.60 |
0.39 |
0.72 |
38-39 |
|
BaA/(BaA + Chr) |
? 0.2 0.2 - 0.35 ? 0.35 |
Petrogenic Petroleum combustion Grass, coal and wood combustion |
0.78 |
0.26 |
0.81 |
0.59 |
38 - 39
|
The BaA/(BaA+Chry) of Adebayo and EKSU indicated grass, coal and wood combustion in most cases. IcdP/(IcdP+BghiP) were between 0.47 to 0.50, suggesting pyrogenic.38 The overall diagnostic ratios suggested that the PAHs were predominately pyrogenic.
Assessment of Soil Toxicity
To assess the soil toxicity, benzo(a)pyrene toxicity equivalents were used. Investigators have established value for individuals PAHs Toxic Equivalence Factor.42-43 It’s also alluded to as benzo(a)pyrene toxicity.42 Toxic equivalents (TEQs) were used to quantify PAHs toxic potencies of the soil. Total toxic equivalents of PAHs with respect to BaP (TEQBaP) was used to establish the carcinogenic potency.
The total benzo(a)pyrene equivalent:
TEQBaP= ∑(TEFi × Ci)
Where Ci = measured individual PAHs for (ith) compound, while TEFi = corresponding toxic equivalent factor.
Table 7: TEQBaP (µg/kg) of the soil from the study area.
|
|
TEFs |
AJI |
ADY |
EKSU |
NNPC |
|
Acenaphthalene |
0.001 |
0.0004 |
0.006 |
0.005 |
0.002 |
|
Naphthalene |
0.001 |
0.052 |
0.011 |
0.010 |
0.002 |
|
Acenaphthylene |
0.001 |
0.001 |
0.009 |
0.002 |
0.0005 |
|
Phenanthrene |
0.001 |
0.002 |
0.003 |
0.003 |
0.0008 |
|
Pyrene |
0.001 |
0.003 |
0.009 |
0.001 |
0.001 |
|
Fluorene |
0.001 |
0.005 |
0.007 |
0.005 |
0.003 |
|
Chrysene* |
0.01 |
0.011 |
0.052 |
0.020 |
0.016 |
|
Benzo(b)fluoranthene* |
0.1 |
0.533 |
1.94 |
1.01 |
0.621 |
|
Fluoranthene |
0.001 |
0.002 |
0.007 |
0.003 |
0.0008 |
|
Dibenzo(a,h)anthracene* |
1 |
1.55 |
5.63 |
7.43 |
- |
|
Benzo(a)anthrancene* |
0.1 |
0.407 |
0.182 |
0.780 |
0.223 |
|
Anthracene |
0.01 |
0.016 |
0.048 |
0.020 |
0.021 |
|
Indeno (1,2,3-cd)pyrene* |
0.1 |
1.36 |
4.15 |
1.22 |
1.33 |
|
Benzo(g,h,i)perylene |
0.01 |
0.014 |
0.047 |
0.012 |
0.013 |
|
Benzo(a)pyrene* |
1 |
7.42 |
23.6 |
13.4 |
7.81 |
|
Benzo(k)fluoranthene* |
0.1 |
0.392 |
0.379 |
0.653 |
0.330 |
|
∑16-PAHs |
2.43 |
11.8 |
36.1 |
24.6 |
10.4 |
|
∑7C-PAHs |
1.41 |
11.6 |
35.9 |
24.5 |
10.3 |
The average sum of TEQBaP (µg/kg) were 11.8 (Ajilosun), 36.1 (Adebayo), 24.6 (EKSU) and 10.4 (NNPC). The PAHs toxicity level of NNPC is double and thrice of EKSU and Adebayo. The mean TEQBaP value were lower than 650 µgBaPeq/kg, India44; 542.8µgBaPeq/kg, India27; 124µgBaPeq/kg, Spain45 and 428 µgBaPeq/kg, China.22 The sum of carcinogenic toxic potency of the soils was in the order: Adebayo (35.9) ? EKSU (24.5) ? Ajilosun (11.6) ? NNPC (10.3). The result further revealed that the carcinogenic potency of the roadside soil was the highest in Adebayo and as such contribute majorly to toxicity of the soil.
Conclusion
The study revealed low PAHs contamination and high percentage distribution of HMW-PAHs with a percentage composition of 46.0 – 82.7%. The PAHs composition was also characterized by a high 5- and 6- rings PAHs. The overall diagnostic ratio of PAHs suggested mixed pyrogenic sources. Carcinogenic PAHs level within the city soils could be toxic to human exposure. The research, therefore, suggests that PAHs pollution should be discouraged, most importantly traffic exhaust especially diesel exhaust.
Acknowledgement
The authors acknowledge the technical assistance rendered by the Nigerian Institute of Oceanography and Marine Research (NIOMR) Central Laboratory, Victoria Island, Lagos.
Conflict of interest
The author has no conflict of interest including any financial, personal, or other relationships with other people or organizations that can influence the work.
Funding Sources
The author received no financial support for the research, authorship, and/or publication of this article.
References
- Bouloubassi I., Mejanelle L., Pete R., Fillaux J., Lorre A., Point V. Transport by Sinking Particles in the Open Mediterranean Sea: A 1 Year Sediment Trap Study. Marine Pollut Bulletin. 2006; 52: 560 -571.
- USEPA. Guidelines of assessing chemical contaminant data for use in fish advisories, EPA/823/B-00/007, United States Environmental Protection Agency. 2000.
- Brown J., Peake B. Sources of Heavy Metals and Polycyclic Aromatic Hydrocarbons in Urban Storm Water Runoff. Sci Total Environ. 2006; 359: 145-155.
- United State Environment Protection Agency. Emission inventory of section 112 @ (6) pollutants: polycyclic organic matter (POM), TCDD, TCDF, PCBs, hexachlorobenzene, mercury, and alkylated lead, Final Report, 1997.
- Helfrich J., Armstrong D.E. Polycyclic Aromatic Hydrocarbons in Sediments of the Southern Basin of Lake Michigan. J Great Lakes Resea. 1986; 12(3): 192-199.
- Hartmann R. Polycyclic Aromatic Hydrocarbons (PAHs) in Forest Soils: A Critical Evaluation of a New Analytical Procedure. Inter J Environ Analy Chem. 1996; 62: 161-173.
- Wilcke W., Zech W., Kobza J. PAHs Pools in Soils along PAHs Deposition Gradient. Environ Pollut. 1996; 92: 307-313.
- Simcik M.F., Eisenreich S.J., Golden K.A., Liu S.P., Lipiayou E., Swackhamer D.L., Long D.T. Atmospheric Loading of Polycyclic Aromatic Hydrocarbons to Lake Michigan as Recorded in the Sediments. Environ Sci Technol. 1996; 30: 3039-3046.
- Fernandez P., Vilanova R., Grimalt J. O. Sediment Fluxes of Polycyclic Aromatic Hydrocarbons in European High Altitude Mountain Lakes. Environ Sci Technol. 1999; 33: 3716-3722.
- Fernandez P., Vilanova R.M., Martinez C., Appleby P., Grimalt J. O. The Historical Record of Atmospheric Pyrolitic Pollution over Europe Registered in Sedimentary PAH from Remote Mountain Lakes. Environ Sci Technol. 2000; 34: 1906-1913.
- Ibigbami O.A., Asaolu S.S., Popoola O.K., Adefemi S.O., Abodunde T.S., Idowu K., Olatoye R.O. Distribution and Source of Polycyclic Aromatic Hydrocarbons in Water and Sediments from Egbe Dam in Southwestern Nigeria. J Chromato Separ Tech. 2000; 11(1): 1-6.
- Grimalt J.O., van Drooge B.L., Ribes A., Fernandez P., Appleby P. Polycyclic Aromatic Hydrocarbon Composition in Soils and Sediments of High Altitude Lakes. Environ Pollut. 2004; 131: 13-24.
- Adedosu T.A., Adeniyi O.K., Adedosu H.O. Distribution, Sources and Toxicity Potentials of Polycyclic Aromatic Hydrocarbons in Soil around the Vicinity of Balogun-Birro Dumpsite of Oshogbo, Nigeria. Malaysian J Analyt Sci. 2015; 19(3): 636- 648.
- Yang S.Y.N., Connell D.W., Hawker D.W., Kayal S.I. Polycyclic Aromatic Hydrocarbons in Air, Soil and Vegetation in the Vicinity of an Urban Roadway. Sci Total Environ. 1991; 102: 229-240.
- Tebaay R.H., Welp G., Brummer, G.W. Gehalt an polycyclischen Aromatischen Kohlenwasserstoffen (PAK) und Deren Verteilungsmuster in Unterschiedlivh Belasteten Boden. Z Pflanzernernaehr Bodenkd, 1993; 156: 1-10.
- Rogge W.F., Hildemann L.M., Mazurek M.A., Cass G.R., Sinoneit B.R.T. Sources of Fine Organic Aerosol: 2, Road Dust, Tire Debris, Organometallic Brake Lining Dust: Roads as Sources and Sinks. Environ Sci Technol. 1993; 27: 636 – 651.
- Nam J.J., Song B.H., Eom K.C., Lee S.H., Smith A. Distribution of PAHs in Agricultural Soils in South Korea. Chemosphere. 2003; 50: 1281-1289.
- Wilcke W. Polycyclic Aromatic Hydrocarbons (PAHs) in Soil- A Review. J Plant Nutri Soil Sci. 2000; 163: 229-248.
- Chung M.K., Hu R., Cheung K.C., Wong M. H. Pollutants in Hong Kong Soils: Polycyclic Aromatic Hydrocarbons. Chemosphere. 2007; 67: 464 - 473.
- Wang Z., Chen J., Qiao X., Yang P., Tian F., Huang, L. Distribution and Sources of Polycyclic Aromatic Hydrocarbons from Urban to Rural Soils: A Case Study in Dalian, China. Chemosphere, 2007; 68: 965-971.
- Jiao W., Lu Y., Li J., Han J., Wang T., Luo W., Shi Y., Wang, G. Identification of Sources of Elevated Concentrations of Polycyclic Aromatic Hydrocarbons in an Industrial Area in Tianjin, China. Environ Monitor Assess. 2009; 158: 581-592.
- Jiang Y.F. Levels, Composition Profiles and Sources of PAHs in Urban Soil of Shanghai, China. Chemospheredoi:10.1016/j.chemosphere.2009.01.027.
- Jensen H., Reimann C., Finne T.E., Ottesen R.T., Arnoldussn A. PAH- concentrations and Compositions in the Top 2 cm of Forest Soils Along a 120 km Long Transect through Agricultural Areas, Forest and the City of Oslo, Norway. Environ Pollut. 2007; 145: 829-838.
- Fadzil M.F., Norhayati M.T., Wan M.K., Wan, M.Z. Concentration and Distribution of Polycyclic Aromatic Hydrocarbons (PAHs) in the Town of Kota Bharu, Kelantan Darul Naim. Malaysian J Analyt Sci. 2008; 12(3): 609-618.
- Placha D, Raclavska H, Matysek D, Rummeli M.H. The Polycyclic Aromatic Hydrocarbon Concentrations in Soils in the Region of Valasske Meziriei, the Czech Republic. Geochem Transaction. 2009; Doi: 10.1186/1467-4866-10-12.
- Agarwal T. Concentration Level, Pattern and Toxic Potential of PAHs in Traffic Soils of Delhi. J Hazard Material. 2009; 7: 894-900.
- Singh D.P., Gadi R., Mandal T.K. Levels, Sources and Toxic Potential of Polycyclic Aromatic Hydrocarbons in Urban Soil of Delhi, India. Human Ecologi Risk Assess: An Inter J. 2012; 18(2): 393-411.
- Kumar B., Goel G., Gaur R., Prakash D., Kumar S., Sharma C.S. Distribution, Composition Profile and Source Identification of Polycyclic Aromatic Hydrocarbons in Roadside Soil of New Delhi, India. Environ Earth Sci. 2012; 2(1): 10-19.
- Hiller E., Lachka L., Jurkovic L., Vozar J. Polycyclic Aromatic Hydrocarbons In Urban Soils from Kindergartens and Playgrounds in Bratislava, the Capital City of Slovakia. Environ Earth Sci. 2015; 73: 7147-7156.
- Mielke H.W., Wang G., Gonzales C.R., Le B., Quach V.N., Mielke P.W. PAH and Metal Mixtures in New Orleans Soils and Sediments. Sci Total Environ. 2001; 281: 217 -227.
- USEPA 2000. SW-846, test methods for evaluating solid waste, 3rd edition. Update IVB’ Chapter 4, organic analytes. USEPA, Washington.
- Maliszewska-kordybach B. Polycyclic Aromatic Hydrocarbons in Agricultural Soils in Poland: Preliminary Proposals for Criteria to Evaluate the Level of Soil Contamination. Applied Geochem. 1996; 11: 121-127.
- National Oceanic and Atmospheric Administration, NOAA, 1999. NOAA screening quick reference tables (SQuiRTs), HAZMAT REPORT 99-1, and updated Feb. 2004. Coastal Protection and Restoration Division, Seattle, Washington.
- Canadian Council of Ministers of the Environment (CCME). Summary of Existing Canadian Environmental Quality Guidelines, Summary Table-updated 2002: Winnipeg.
- Agency for Toxic Substances and Disease Registry (ATSDR), 1995. Polycyclic aromatic hydrocarbons. US Department of Health and Human Services, Public Health Service, Atlanta, GA, USA. Available at http://www.atsdr.cdc.gov/toxprofiles/phs69.html
- Tuhackova J., Cajthaml T., Novak K., Novotny C., Martelik J., Sasek V. Hydrocarbon Deposition and Soil Microflora as Affected by Highway Traffic. Environ Pollut. 2001; 113: 255-262.
- Sun F., Wen D., Kuang Y., Li J., Zuo, W. Concentrations of Heavy Metals and Polycyclic Aromatic Hydrocarbons in Needles of Masson Pine (Pinus Massoniana L.) Nearby Different Industrial Sources. J Environ Sci. 2010; 22: 1006-1013.
- 38 Yunker M.B., Macdonald R.W., Vingarzan R., Mitchell R.H., Goyette D., Sylvestre S. PAHs in the Fraser River Basin: A Critical Appraisal of PAH Sources and Composition. Organic Geochem. 2002; 33: 489-515.
- Hwang H.M., Wade T.L., Sericano J.L. Concentrations and Source Characterization of Polycyclic Aromatic Hydrocarbons in Pine Needles from Korea, Mexico and United States. Atmosph Environ. 2003; 37: 2259-2267.
- Zhang H.B., Luo Y.M., Wong M.H., Zhao Q.G., Zhang G.L. Distribution and Concentrations of PAHs in Hong Kong Soils. Environ Pollut. 2006; 141:107-114.
- Pandey P.K., Patel K.S., Lenicek J. Polycyclic Aromatic Hydrocarbons: Need for Assessment of Health Risks in India, Study of an Urban Industrial Location in India. Environ Monitor Assess. 1999; 59: 287-319.
- Tsai P.J., Shih T.S., Chen H.L., Lee W.J., Lai C.H., Lious S.H. Assessing and Predicting the Exposure of PAHs and their Carcinogenic Potencies from Vehicle Engine Exhausts to Highway Toll Station Workers. Atmosph Environ. 2004; 38: 333-343.
- Nisbet I.C.T., LaGoy P.K. Toxic Equivalency Factors (TEFs) for Poly-Cyclic Aromatic Hydrocarbons (PAHs). Regulatory Toxicol Pharm. 1992; 16: 290 -300.
- Masih A., Taneja A. Polycyclic Aromatic Hydrocarbons (PAHs) Concentrations and Related Carcinogenic Potencies in the Soil at a Semi-Arid Region of India. Chemosphere. 2006; 65(3): 449-456.
- Nadal M., Schuhmacher M., Domingo J.L. Levels of PAHs in Soil and Vegetation Sample from Tarragona Country, Spain. Environ Pollut. 2004; 132: 1-11.


