Water Quality Index (WQI) to Evaluate Groundwater Quality in Chickmagaluru District, South Karnataka, India.
Pramoda Govindaraju
*
 , Ayyappan Balasubrahmanian
, Doddaia Nagaraju
and Vybhav Krishnamurthy
, Ayyappan Balasubrahmanian
, Doddaia Nagaraju
and Vybhav Krishnamurthy
1
Department of Studies in Earth Science,
University of Mysore,
Manasagangothri Mysuru,
Karnataka
India
http://dx.doi.org/10.12944/CWE.17.1.18
Copy the following to cite this article:
Govindaraju P, Balasubrahmanian A, Nagaraju D, Krishnamurthy V. Water Quality Index (WQI) to Evaluate Groundwater Quality in Chickmagaluru District, South Karnataka, India. Curr World Environ 2022;17(1). DOI:http://dx.doi.org/10.12944/CWE.17.1.18
Copy the following to cite this URL:
Govindaraju P, Balasubrahmanian A, Nagaraju D, Krishnamurthy V. Water Quality Index (WQI) to Evaluate Groundwater Quality in Chickmagaluru District, South Karnataka, India. Curr World Environ 2022;17(1).
Download article (pdf)
Citation Manager
Publish History

Introduction
Groundwater is a significant natural resource all around the world. In the last few decades, conserving these vital renewable resources is receiving more and more attention. This is because, as the population expands and water consumption for diverse uses such as agriculture, drinking, and industrial growth, investment in the water sphere will become unavoidable. Water is essential to all living things on the Earth, whether directly or indirectly. The groundwater is affected by a number of mechanisms. Some are man-made, while others are natural(Batabyal, 2015). Groundwater composition is influenced by soil layers, precipitation and surface water chemistry, climate, topography, and composite human activities(Balasubramanian, 1986).
Water quality evaluation for drinking includes determining the composition of groundwater as well as remedial procedures to restore water quality (Behera et. al. 2018).The Water Quality Index isasimple approach for find out the overall quality of groundwater (CCME,2001). It also represents the combined impact of the various water quality indicators. The overall indicator value can be communicated quickly and simply to its target audiences like policymakers and the general public. One of the most efficient strategies for disseminating information on water quality to decision-makers. Thiswill be useful for evaluating and conveying the overall effects of current, planned, or proposed water quality actionsfor different locations and at different times in the study area, which helps prioritize management efforts, funds and management decisions.
Study Area
The research area (Fig. 1))is in the state of Karnataka. Chikmagalur district is placed in the southwestern portion of Karnataka state between 12° 54' 42" - 13° 53' 53" North latitudes and 75° 04' 46" - 76° 21' 50" east longitudes. The greatest elongation from east to west is 138.4km and the greatest breadth from North-South is 88.5km. The study area is bounded by Tumkur district in the East, Hassan in the South, Dakshina Kannada in the west, Chitradurga in the Northeast, and Shimoga in the North. The overall geographical area of the district is 7201 Sq. Km. consisting of seven taluks namely Chikmagalur, Kadur, Koppa, Mudigere, Narasimharajapura, Sringeri, and TarikereFetter (CGBW, 2014).
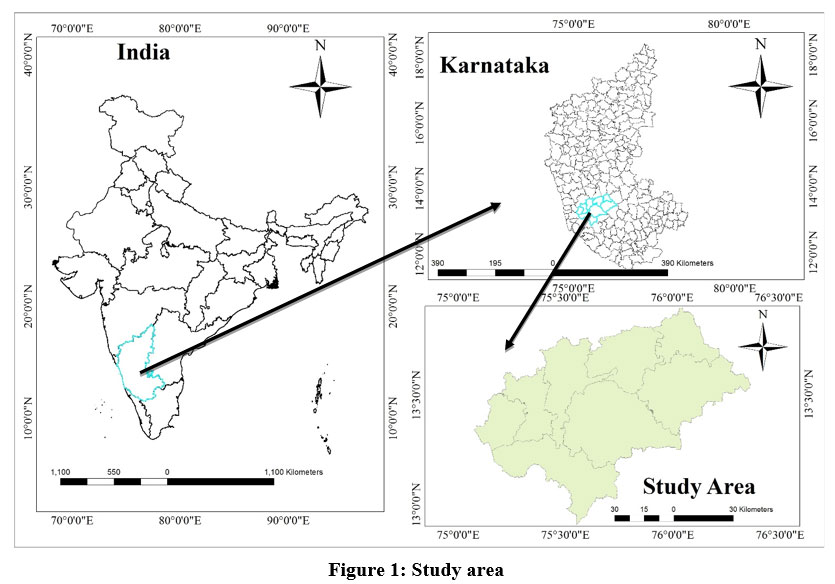 |
Figure 1: Study area |
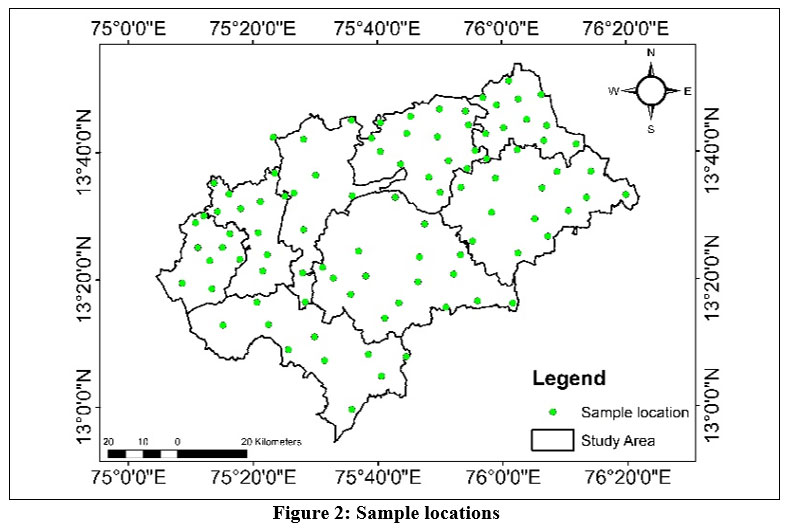 |
Figure 2: Sample locations Click here to view Figure |
Material and Methodology
The groundwater samples (Fig. 2) were collected from hand dug well and bore holes before and after monsoon in the year 2019. March to May is considered as pre-monsoon season, while October to December is the post-monsoon season. A total 95 groundwater samples were collected according to the established protocol recommended from APHA (American Public Health Association) (APHA,2005). (Tab. 1). After 5 minutes of pumping, the samples were picked-up and lay in at 4°C in thoroughly washed polythene containers until the study was completed. groundwater by testing samples and compared them to the Bureau of Indian Standards' recommendations (BIS,2012). The following physico-chemical parameters such as Electrical Conductivity (EC), pH, Total Dissolved Solids (TDS), Calcium (Ca2+), Magnesium (Mg2+), Potassium(K), Chloride (Cl-), Sulphate (SO4-), Nitrate (NO3-), Total Hardness (TH), Bicarbonate (HCO3), Sodium (Na+) Fluorides (F-), and Iron (Fe) in the laboratory. The concentrations or relative abundances of major and minor constituents and patterns of variability in the various water samples have been analyzed using different graphical and statistical techniques and characteristics listed in the introduction were examined in each of the groundwater samples were analysed for each of the groundwater samples (Tab. 1). pH and EC were determined in insitu and while other parameters were examined in the laboratory using1standard methods described by APHA (American Public Health Association), later results processed in WATCHIT (Water Chemistry interpretation Techniques). The GPS readings were noted at each location and used to produce thematic maps with the ARCGIS.
The detailed scrutiny of the correlation matrix is beneficial to the interpretation of groundwater in the study region. Each parameter's function and its impact on the hydrochemistry process is depicted in the correlation matrix (Singh et. al 2011). In Pearson's correlation (PC) matrix (Tabs 3 & 4), value of "r" that are "+ 1 or - 1" are considered high correlation coefficients, indicating functional habituation within two variables. At the P 0.05 level, there is no meaningful link between the bivariate and the values are closer to 0. The parameters are substantially correlated if r > 0.7, and moderately correlated if r is between 0.4 and 0.7. A correlation matrix is employed to understand any link between empirically observed parameters and factor loadings when PCA is used.
There are various rotation techniques to choose from, including varimax, equamax, and quartimax, but Varimax rotation is the most popular, and it contains an orthogonal rotation, which is difficult to describe in this research. The overall concept of this method was described by Kaiser (1958). Factorial extraction and rotational factors (Tables 7 & 8) in which the significance of single factor explained by the variables that have the greatest impact on it. The rotation mode analysis reveals a number of good characteristics that help analyse the dataset more effectively. Meanwhile, for all samples, factor scores are generated, revealing the significance of a given component at that sample site. Extremely negative and positive PC scores indicate that the region is untouched and largely influenced, by the variables act upon PC. A value near to zero implies that the chemical activity of that factor has an average effect on the area. (Senthilkumar 2008). Since a result, the chemical process has a minor impact on the region, as the scores are close to zero.
It is a useful technique, where a vast amount of data containing variables can be condensed down to a small number of variables. Methodology also establishes the link between the variables and their impact on objects. The PC is made up of linear combinations of the original variables that can represent the maximum of the overall variance, is a key component of this technique. The remaining parameters determine the greatest residual variability. The extracted components are orthogonal to one another. The variances derived from the factors are called eigenvalues, and only factors with eigenvalues larger than 1 are chosen. The relationships between the original variables and the components retrieved are represented by factor loadings. To simplify factor analysis data, Varimax with Kaiser 1958 normalisation rotation is utilised (Akazem et. al 2018). The Kaiser-Meyer-Olkin (KMO) Test determines whether data is appropriate for factor analysis. KMO and Bartlett's tests determine the sample sufficiency for each variable in the model by assessing the acceptability of data for factor analysis (Singh 2011). The statistic is a measure of the amount of variation among variables that is common. The lesser the proportion, the better your data is for Factor Analysis. KMO returns a range of numbers from 0 to 1.
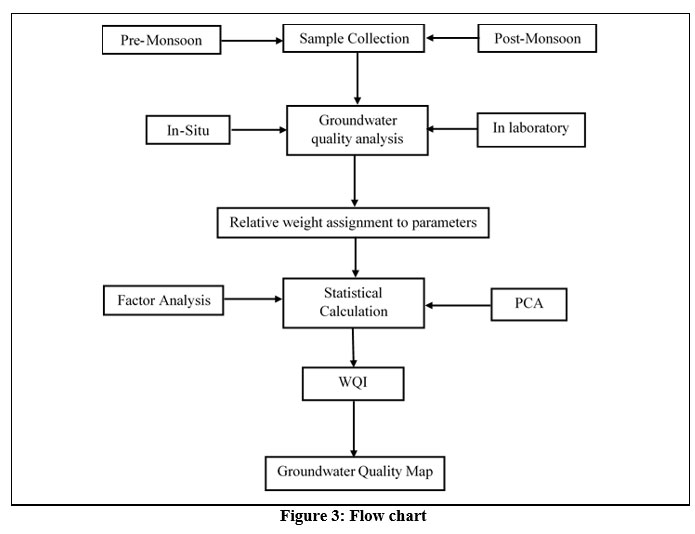 |
Figure 3: Flow chart. Click here to view Figure |
Groundwater Quality
pH: In pure form water has a neutral, pH of 7, which indicates the concentration of hydrogen ions . For drinking water, the range of pH should be between 6.5-8.5(BIS,2012). Groundwater flow through carbonate-rich rocks like limestones and marbles, usually have a pH of greater than 7. The pH in the research area ranges 6.5 (minimum) to 8.43 (maximum) in the before-precipitation and 6.5 (minimum) to 8.35 (maximum) in the after- precipitation (Maximum). Both before and after monsoon, all of the samples in the research region are within the permitted cap.
EC: It’s a measure the amount of dissolved matter in an aqueous solution; When there is more dissolved material in a water, the EC rises (Chaurasia, 2018). For potable purposes, an EC cap of 300 μS/cm is ideal. Pre-monsoon EC varies 79 μS/cm to 2576 μS/cm, while post-monsoon electrical conductivity varies from 63 μS/cm to 2249 μS/cm. Approximately 41% of before-monsoon samples and 47.3 percent of after-monsoon samples fell below the permissible level of 300 μS/cm.
Total Hardness (TH): For its usage in the domestic domain, TH is a significant parameter of water. The ability of water to form lather soap is measured by its hardness (Adams et. al. 2001). Hard water can induce digestive difficulties as well as the formation of calcium oxalate crystals (Kidney stones) in the kidney. "It happens as a result of calcium and magnesium being present (Batabyal, 2015). Pre-rainfall TH ranges 36.45 Mg/L to 1916 Mg/L, while after rainy season total hardness ranges from 23.22 milligrammes per litre to 1672.5 Mg/L. Around 53% of samples before rainfall and 66.3 percent of after rainy season samples are below the permitted level of 300 mg/L.
Table 1: physico-chemical parameter of groundwater.
|
Parameter |
BIS standards |
Max |
Min |
Mean |
Standard Deviation |
Max |
Min |
Mean |
Standard Deviation |
|
|
|
Pre-monsoon |
Post-monsoon |
||||||
|
Ca |
75 |
378.0 |
8 |
99.43 |
83.48 |
330 |
5 |
65.94 |
61.81 |
|
Mg |
30 |
241.0 |
4 |
60.76 |
52.55 |
211 |
2 |
40.11 |
40.71 |
|
Cl |
250 |
610 |
15 |
139.59 |
135.52 |
378 |
6 |
87.93 |
87.19 |
|
NO3 |
45 |
147 |
0.3 |
14.71 |
22.06 |
126.8 |
0.1 |
9.45 |
16.78 |
|
SO4 |
200 |
385 |
3 |
118.93 |
115.75 |
2 |
278 |
83.45 |
87.40 |
|
F |
1 |
1.65 |
0.02 |
0.52 |
0.48 |
1.55 |
0.01 |
0.4 |
0.44 |
|
Fe |
0.3 |
5.64 |
0.014 |
0.36 |
0.96 |
4.12 |
0.003 |
0.1981 |
0.62 |
|
TDS |
500 |
2215 |
68 |
576 |
492 |
1975 |
48 |
411 |
382 |
|
EC |
300 |
2576 |
79 |
745 |
624 |
2249 |
63 |
560 |
495 |
|
TH |
200 |
1916 |
36.45 |
498.60 |
419.78 |
1672.5 |
23.22 |
329.9 |
314.80 |
|
HCO3 |
244 |
564.0 |
112 |
194.77 |
72.22 |
501 |
92 |
170.06 |
67.18 |
|
K |
10 |
88.0 |
2 |
19.84 |
17.50 |
63 |
2 |
14.84 |
13.66 |
|
pH |
6.5-8.5 |
8.43 |
6.5 |
7.08 |
0.5 |
8.35 |
6.5 |
0.4 |
7.04 |
|
Na |
20 |
255.0 |
13 |
58.29 |
43.24 |
212 |
10 |
48.71 |
38.06 |
:All values are given in milligrammes per litre, excluding pH and EC expressed in μS/cm
TDS
It's aprimal criterion for drinking water. Water with a high TDS level is unfit for drinking and causes an adverse physiological reaction. It's mostly made up of inorganic salts, with a slight amount of organic matter melted in water (Fetter 1994). According to the BIS, the ideal TDS for human drinking water is less than 500 mg/L, with a maximum acceptable value of 2000 mg/L. During 2019, the TDS in the research region ranges from 68 Mg/L to 2215 Mg/L in the before-monsoon and 48 Mg/L to 1975 Mg/L in the after-monsoon. Around 53.6 percent of before-monsoon samples and 66.3 percent of after-monsoon samples are below the permissible limit of 500 mg/L.
Calcium
Calcium divalent cations areone of the most essential nutrients for living things. Calcium is naturally found in water. Rocks like limestone, marble, calcite, dolomite, gypsum, fluorite, and apatite will fade it out (Guo et. al. 2004). Calcium, which is found in water as Ca2+ ions, is a determining factor in water hardness. Natural groundwater quality varies depending on the kind of rock. Before the monsoon, the calcium content in the studied area ranged from 8 Mg/L to 378 Mg/L, and 5 Mg/L to 330 Mg/Lafter the monsoon before and after monsoon respectively. Around 48.4% of prior to monsoon samples and 60% of later monsoon samples fall below the permissible throttle of 75 mg/L.
Magnesium
Magnesium is always associated with calcium in natural form, however its concentration is usually smaller than that of Ca2+. The higher magnesium content produces water hardness. Concentration >500 Mg/L imparts abad taste thenit is unportable. Sulfate in high concentrations serves as a laxative in humans.Magnesium concentrations in the research area range from 4 Mg/L to 241 Mg/L in pre-monsoon and 2 Mg/L to 221 Mg/L in post-monsoon, according to the findings. Around 43.15 percent of pre-monsoon samples and 48.42 percent of post-monsoon samples fall below the permissible limit of 30 mg/L.
Nitrate
The most significant nutrient in the environment is nitrate. Nitrates are a major source of worry because when the concentration of methemoglobinemia exceeds 40 Mg/L may cause mortality in cattle, pigs, and calves. The concentration of Nitrate is 45 Mg/L, the limit imposed by BIS is exceeded, thus making this water unfit for portable. It is very difficult to point out the exact sources of nitrate contamination. One of the main causes of nitrate contamination is anthropogenic pollution. Nitrogen and nitrates from agricultural runoff due to the increased usage of chemical fertilizers. Municipal and industrial wastewater, landfills, animal feedlots, septic tanks, and sewage disposal systems all contain nitrogen.The nitrate concentration is also affected by the direction of groundwater movement and subsurface geology.Pre-monsoon range of concentrations is 0.3 Mg/L to 147 Mg/L, while post-monsoon range of concentrations is 0.1 Mg/L to 126.8 Mg/L. Pre-monsoon samples account for 95.78 percent of the total, while post-monsoon samples account for 96.84 percent.
Chloride
Chloride is found in all sorts of natural waters and gives saline flavor to water. High chloride contamination indicates, contamination due to organic waste.The greater the chlorine content in water, the more dangerous it is to human health (Mahmood 2021). In the current study, the concentration of chloride ranges 15 mg/L to 610 mg/L in the prior to monsoon period and 6 mg/L to 378 mg/L in the later monsoon period. Around 85.26 percent of before-monsoon samples and 91.5 percent of after-monsoon samples are below the throttle level of 250 mg/L.
Sulfate
Sulfate leach out from rocks such as gypsum, iron sulphides, and other compounds.The sulfate ion is a key component of hardness, along with calcium and magnesium. It has an unpleasant taste at 300-400 Mg/L, 1000 Mg/Lis a laxative, and interferes with the proper working digestion. Before-monsoon the level of Sulphate in the region ranges from 3 mg/L to 385 mg/L, and after-monsoon season, it ranges from 2 mg/L to 275 mg/L. Around 67.36 percent of prior to monsoon samples and 87.36 percent of later monsoon samples are below the permissible limit of 200 mg/L.
Fluoride
The primeroot of Fluoride contamination in groundwater is geogenic. Fluoride in high concentrations (>3.0 mg/l) can induce skeletal fluorosis(Janardhana Raju 2007). Fluoride presents naturally in public water systems and by runoff from weathering of rocks and soils containing fluoride, leaching from rocks and soil into groundwater, and rainfall that brings the fluoride into the water system. For prior-monsoon fluoride concentration in the research region ranges from 0.02Mg/L to 1.65Mg/L, and for post-monsoon reasons, it ranges from 0.01Mg/L to 1.55Mg/L. Around 78.9% of before monsoon samples and 86.3 percent of after-monsoon samples are below the permissible limit of 1 mg/L.
Iron (Fe)
The main source of iron contamination in groundwater is due to the leaching of iron from minerals and rocks, and rainfall that brings the iron into the water system. The upper limit of iron is 0.3 Mg/L, if the concentration is exceeded from this limit it results in a negative effect on the skin. The iron concentration in the studied area varies from 0.014 mg/l to 5.64 mg/l in the before-monsoon season and from 0.003 mg/l to 4.12 mg/l in the later-monsoon season. Around 77.8% of prior monsoon samples and 91.5 percent of later-monsoon samples are below the permissible level of 0.3 Mg/L.
Sodium
It is one of the most cation found in naturally in water and is descended from weathering of rocks and minerals present in the locality. Sodium is abundant in domestic sewage and industrial waste. Pre-monsoon sodium concentrations ranged from 13 mg/l to 255 mg/l, while post-monsoon sodium concentrations ranged from 10 mg/l to 212 mg/l. The maximum permissible concentration is 20 mg/l.
Potassium
Naturally occurring element that occurs in less amounts than sodium, calcium, and magnesium but it has akinchemistry to sodium and does not precipitate out of solution. As a result, it isn't particularly relevant in terms of health. Pre-monsoon concentrations in the study region ranged from 2 mg/l to 88 mg/l, while post-monsoon sodium concentrations ranged from 2 mg/l to 63 mg/l. Around 85.26 percent of prior to monsoon samples and 91.5 percent of later -monsoon samples are below the throttle level of 250 mg/l.
Results and Discussion:
Pearson’s Correlation
In pre-monsoon, Ca2+ has an inverse relationship with Fe-, and a significant positive link between Na+, K+, Mg2+, TDS, HCO3-, Cl-, SO4, NO3-, F-, EC, pH, TH moderate positive correlation with Temperature. In post-monsoon Ca2+ shows a significant positive link between Na+, K+, SO4, F-, Mg2+, HCO3, NO3-, Cl-, TDS, EC, and TH & moderate positive link with Fe-, pH and temperature. The pH displays a negative correlation with Fe- and a positive correlation with all other parameters in before-monsoon as well as after-monsoon. The Mg2+ has a positively strong correlation with Ca2+, NO3-, Na+, K, F-, TH, Cl-, SO4, TDS, EC, and pH moderately correlated with HCO3- and temperature except Fe- which shows the negative correlation in before and after monsoon. Mg2+ has a positively strong correlation with Ca2+, Na+, K, Cl-, SO4, NO3-, F-, TDS, EC, and TH and moderately correlated with Fe-, pH, and temperature. The Significant association Mg2+and Cl-, Cl-and Na+, Cl- and TDS the studied area demonstrates the impact of agronomical activities. In pre-monsoon EC has a strong positive association with Ca2+, Mg2+, Na+, K, Cl-, SO4, NO3-, F-, TDS, EC, and TH and moderately correlation with HCO3- and T and Fe- show a negative correlation. In the post-monsoon EC has a strong positive association with Ca2+, Mg2+, Na+, K, Cl-, SO4, NO3-, HCO3-, Fe- and TH and moderately positive correlation with F-, pH, and T suggests Ions have the ability to common root and are entangled in ion exchange reactions (Reghunath 2002). TH is highly correlating with all the parameters except Fe- in prior to monsoon as well as post-monsoon. TDS in pre-monsoon high positive link with Ca2+, Mg2+, Na+, K, Cl-, HCO3-, SO4, NO3-, F-, TDS, EC and TH and negative link with Fe-, when it comes to post-monsoon TDS shows a high positive link with Ca2+, Mg2+, Na+, K, Cl-, HCO3-, SO4, NO3-, F-, EC and TH and negative correlation with pH, and Fe-. Concentration of Cl- in the environment is modest in crystalline subsurface (Karanth 1987). Because of rain, the concentration of Cl- is lower in the after-monsoon compare to before-monsoon, which dilutes the concentration. The positive link between Na+ and Cl- is strong in before monsoon, as well as after monsoon suggests that there is a chance that interaction of two end-member composition groundwater.
The strong a relationship between Mg2+ and Cl-, Na+ and Cl-, TDS and Cl- suggest that agronomic activity in the study area. A scatter matrix plot and visual representation are used to interpret the correlation matrix (Fig. 3 & 4). Fig. 3 & 4 is a recreation of Tab. 2 & 3 to quickly grasp the relationship. Kaiser–Meyer–Olkin (KMO) and Bartlett's trails were used to ensure that the data was adequate for statistical analysis; sample adequacy rate is 0.852 in the before-monsoon and 0.845 in the after-monsoon, which is higher than the test's threshold value (0.5). KMO levels of 0.8 to 1, 0.5 to 0.8, and less than 0.5, respectively, are regarded adequate, somewhat adequate, and unsatisfactory or not sufficient.
Table 2: Correlation coefficient matrix pre-monsoon.
|
|
Ca |
Mg |
Na |
K |
HCO3 |
Cl |
NO3 |
SO4 |
F |
Fe |
TDS |
Ec |
pH |
T |
TH |
|
Ca |
1 |
|
|
|
|
|
|
|
|
|
|
|
|
|
|
|
Mg |
0.911 |
1 |
|
|
|
|
|
|
|
|
|
|
|
|
|
|
Na |
0.683 |
0.598 |
1 |
|
|
|
|
|
|
|
|
|
|
|
|
|
K |
0.545 |
0.48 |
0.564 |
1 |
|
|
|
|
|
|
|
|
|
|
|
|
HCO3 |
0.433 |
0.387 |
0.348 |
0.471 |
1 |
|
|
|
|
|
|
|
|
|
|
|
Cl |
0.814 |
0.743 |
0.588 |
0.598 |
0.393 |
1 |
|
|
|
|
|
|
|
|
|
|
NO3 |
0.604 |
0.542 |
0.406 |
0.24 |
0.481 |
0.607 |
1 |
|
|
|
|
|
|
|
|
|
SO4 |
0.737 |
0.61 |
0.574 |
0.451 |
0.188 |
0.772 |
0.466 |
1 |
|
|
|
|
|
|
|
|
F |
0.588 |
0.522 |
0.549 |
0.35 |
0.151 |
0.597 |
0.164 |
0.723 |
1 |
|
|
|
|
|
|
|
Fe |
-0.059 |
-0.021 |
-0.015 |
-0.004 |
0.078 |
-0.038 |
-0.055 |
-0.066 |
-0.028 |
1 |
|
|
|
|
|
|
TDS |
0.827 |
0.702 |
0.653 |
0.461 |
0.418 |
0.757 |
0.756 |
0.783 |
0.552 |
-0.067 |
1 |
|
|
|
|
|
Ec |
0.844 |
0.746 |
0.686 |
0.51 |
0.393 |
0.793 |
0.69 |
0.825 |
0.652 |
-0.069 |
0.974 |
1 |
|
|
|
|
pH |
0.473 |
0.463 |
0.492 |
0.342 |
0.147 |
0.436 |
0.19 |
0.466 |
0.598 |
-0.026 |
0.465 |
0.529 |
1 |
|
|
|
T |
0.212 |
0.233 |
0.152 |
0.046 |
-0.006 |
0.132 |
0.003 |
0.209 |
0.286 |
0.068 |
0.135 |
0.18 |
0.157 |
1 |
|
|
TH |
0.974 |
0.978 |
0.654 |
0.523 |
0.418 |
0.795 |
0.587 |
0.686 |
0.565 |
-0.047 |
0.78 |
0.811 |
0.477 |
0.229 |
1 |
Table 3: Correlation coefficient matrix post-monsoon. (r>0.4 indicates a strong degree of significance).
|
Ca |
Mg |
Na |
K |
HCO3 |
Cl |
NO3 |
SO4 |
F |
Fe |
TDS |
Ec |
pH |
T |
TH |
|
|
Ca |
1 |
|
|
|
|
|
|
|
|
|
|
|
|
|
|
|
Mg |
0.952 |
1 |
|
|
|
|
|
|
|
|
|
|
|
|
|
|
Na |
0.607 |
0.67 |
1 |
|
|
|
|
|
|
|
|
|
|
|
|
|
K |
0.489 |
0.574 |
0.587 |
1 |
|
|
|
|
|
|
|
|
|
|
|
|
HCO3 |
0.417 |
0.491 |
0.362 |
0.441 |
1 |
|
|
|
|
|
|
|
|
|
|
|
Cl |
0.767 |
0.793 |
0.577 |
0.65 |
0.484 |
1 |
|
|
|
|
|
|
|
|
|
|
NO3 |
0.55 |
0.564 |
0.441 |
0.228 |
0.511 |
0.538 |
1 |
|
|
|
|
|
|
|
|
|
SO4 |
0.733 |
0.762 |
0.585 |
0.541 |
0.347 |
0.815 |
0.469 |
1 |
|
|
|
|
|
|
|
|
F |
0.654 |
0.649 |
0.553 |
0.392 |
0.179 |
0.574 |
0.153 |
0.718 |
1 |
|
|
|
|
|
|
|
Fe |
0.124 |
0.143 |
0.176 |
0.011 |
0.187 |
0.05 |
0.228 |
0.059 |
-0.029 |
1 |
|
|
|
|
|
|
TDS |
0.722 |
0.779 |
0.63 |
0.583 |
0.544 |
0.814 |
0.671 |
0.838 |
0.539 |
0.094 |
1 |
|
|
|
|
|
Ec |
0.779 |
0.821 |
0.662 |
0.596 |
0.505 |
0.829 |
0.624 |
0.87 |
0.619 |
0.07 |
0.979 |
1 |
|
|
|
|
pH |
0.358 |
0.325 |
0.35 |
0.201 |
0.079 |
0.248 |
0.073 |
0.387 |
0.498 |
-0.068 |
0.313 |
0.37 |
1 |
|
|
|
T |
0.336 |
0.288 |
0.305 |
0.351 |
0.015 |
0.366 |
0.056 |
0.39 |
0.45 |
-0.002 |
0.287 |
0.35 |
0.348 |
1 |
|
|
TH |
0.987 |
0.986 |
0.647 |
0.538 |
0.458 |
0.789 |
0.566 |
0.756 |
0.658 |
0.124 |
0.759 |
0.81 |
0.344 |
0.317 |
1 |
 |
Figure 4: Scatter matrix plot for Pre-monsoon. Click here to view Figure |
Factorial analysis
The scree plot (Fig. 6a, 6b & 7a, 7b) two factors and three factors for prior to monsoon and late-monsoon respectively (Tab. 4 & 5) were used to describe the 66.69% and 71.22% of total variances are sufficient to build a correlation matrix. With the assistance of these factorial analysis, total variance is delineated, the first component – 52.471% and second component – 66.698% in pre-monsoon and component 1 – 43.989, component 2 – 63.817, and component 3 – 72.226 in post-monsoon.
Variables with loadings greater than 0.3 can be used to interpret the outcomes because they are important for assessing the components (Mahloch 1974). The variable's effect is described by the absolute value of loading. A + or - sign indicates the influence's direction.As a result, a huge negative number indicates that a variable has a significant and negative impact on the factor (Lawrence 1982).
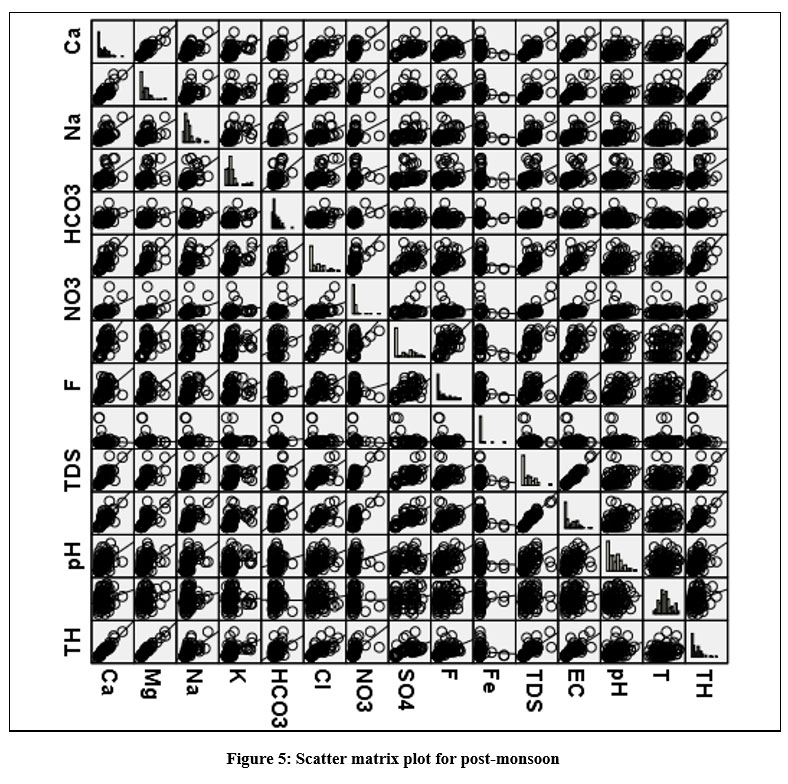 |
Figure 5: Scatter matrix plot for post-monsoon. Click here to view Figure |
 |
Figure 6: (a) Scree plot graph for pre-monsoon and (b). Scree plot graph for post-monsoon Click here to view Figure |
 |
Figure 7: (a). Rotated components for pre-monsoon and (b). Rotated components for post-monsoon. Click here to view Figure |
In pre-monsoon, we observed that in the Component 1Mg, TDS, TH, and EC shoes very high loadings, but Ca, Na, K, HCO3, Cl, NO3, and SO4 shows moderate to high load. In post-monsoon Ca, NO3,TDS, EC, and TH shows moderate to high load. Ca, Mg, Cl, and SO4 play important role in determining TDS, EC, and TH in before-monsoon as well as after-monsoon. Component 1 is regulated by various hydro-geochemical processes like mineralization of the sampling location, soil conditions, anthropogenic activity, and rainfall intensity.However, the cation exchange mechanisms at the soil-water interface are controlled by Na and Mg (Guo 2004).
Table 4: Total variance (pre-monsoon).
|
Total variance (pre-monsoon) |
|||
|
Initial Eigenvalues |
|||
|
Component |
sum |
Variance % |
Cumulate % |
|
1 |
8.378 |
55.854 |
55.854 |
|
2 |
1.627 |
10.844 |
66.698 |
|
3 |
.962 |
6.410 |
73.108 |
|
4 |
.842 |
5.616 |
78.724 |
|
5 |
.698 |
4.654 |
83.378 |
|
6 |
.641 |
4.270 |
87.648 |
|
7 |
.517 |
3.445 |
91.094 |
|
8 |
.468 |
3.121 |
94.215 |
|
9 |
.357 |
2.377 |
96.592 |
|
10 |
.189 |
1.262 |
97.854 |
|
11 |
.163 |
1.087 |
98.941 |
|
12 |
.110 |
.733 |
99.674 |
|
13 |
.036 |
.238 |
99.912 |
|
14 |
.012 |
.080 |
99.992 |
|
15 |
.001 |
.008 |
100.000 |
|
Extraction Sums of Squared Loadings |
|||
|
sum |
Variance % |
Cumulate % |
|
|
8.378 |
55.854 |
55.854 |
|
|
1.627 |
10.844 |
66.698 |
|
|
Rotation Sums of Squared Loadings |
|||
|
sum |
Variance % |
Cumulate % |
|
|
7.871 |
52.471 |
52.471 |
|
|
2.134 |
14.227 |
66.698 |
|
Table 5: Total variance (post-monsoon).
|
Initial Eigenvalues |
|||
|
Component |
sum |
Variance % |
Cumulate % |
|
1 |
8.190 |
54.598 |
54.598 |
|
2 |
1.406 |
9.373 |
63.971 |
|
3 |
1.088 |
7.255 |
71.226 |
|
4 |
.949 |
6.324 |
77.550 |
|
5 |
.803 |
5.350 |
82.900 |
|
6 |
.604 |
4.024 |
86.924 |
|
7 |
.581 |
3.877 |
90.801 |
|
8 |
.448 |
2.985 |
93.786 |
|
9 |
.377 |
2.512 |
96.298 |
|
10 |
.222 |
1.477 |
97.775 |
|
11 |
.150 |
1.000 |
98.775 |
|
12 |
.107 |
.712 |
99.487 |
|
13 |
.062 |
.412 |
99.898 |
|
14 |
.013 |
.088 |
99.986 |
|
15 |
.002 |
.014 |
100.000 |
|
Extraction Sums of Squared Loadings |
|||
|
sum |
Variance % |
Cumulate % |
|
|
8.190 |
54.598 |
54.598 |
|
|
1.406 |
9.373 |
63.971 |
|
|
1.088 |
7.255 |
71.226 |
|
|
Rotation Sums of Squared Loadings |
|||
|
sum |
Variance % |
Cumulate % |
|
|
6.598 |
43.989 |
43.989 |
|
|
2.974 |
19.828 |
63.817 |
|
|
1.111 |
7.409 |
71.226 |
|
In the second component, we can see high loading in F, pH, and temperature and Fe shows negative interaction in before-monsoon as well as after-monsoon except Fe. The concentration of fluoride in groundwater rises when minerals such as silicates, fluorite, fluorapatite, and volcanic ash are dissolved. Fluorite is most commonly found in granite, gneiss, and pegmatite rocks, as a result, the weathering of such rocks releases fluoride (Rama Rao1982). Because of the high pH loading, we assume that the sources are likely organic or biogenic. Component 3 is only observed in post-monsoon most of the components are negatively correlated except Fe which is due to influencing components 1 & 2 present in factor 3 also.
The current assessment primarily assists in extracting information regarding ion sources and variables impacting quality (Islam 2018). In summary, four extracted PCs represent four distinct processes, such as:
Weathering and dissolution of the minerals matter.
Agricultural activities.
Industrial effluent discharges and domestic wastewaters.
Rainfall intensity.
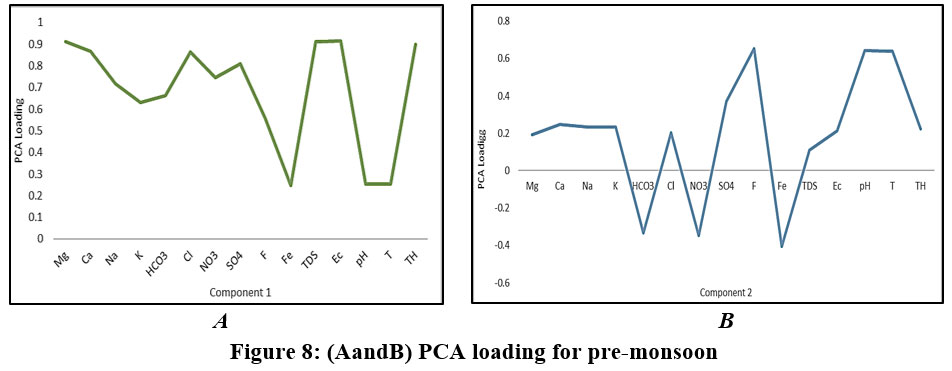 |
Figure 8: (a and b). PCA loading for pre-monsoon Click here to view Figure |
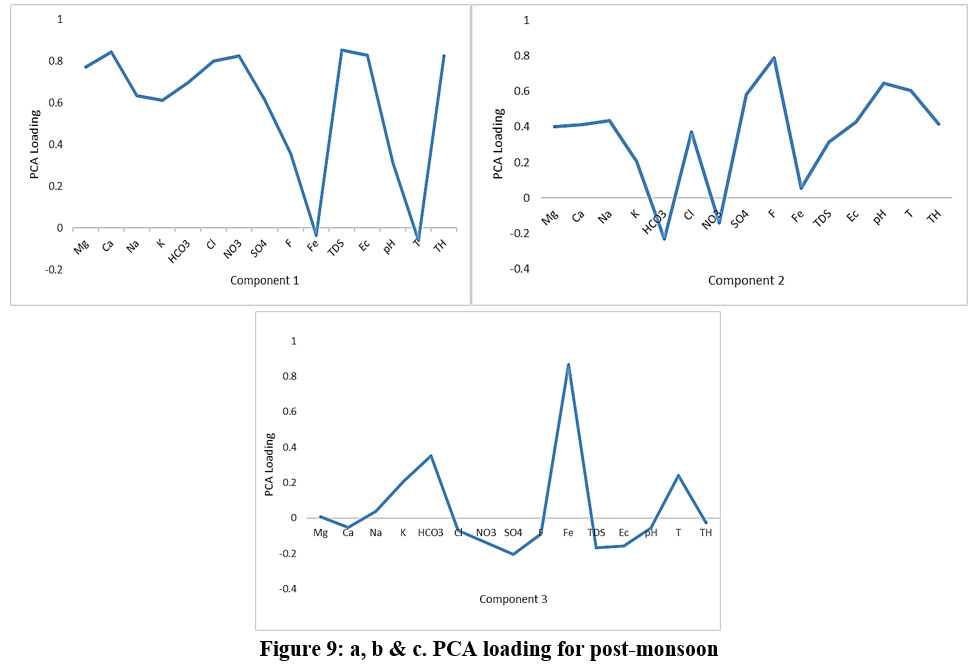 |
Figure 9: a, b & c. PCA loading for post-monsoon. Click here to view Figure |
Table 6: Rotated Component Matrix Pre-monsoon
|
Rotated Component Matrix Pre-monsoon |
||
|
|
Component |
|
|
1 |
2 |
|
|
Mg |
.913 |
.192 |
|
Ca |
.866 |
.246 |
|
Na |
.716 |
.232 |
|
K |
.632 |
.232 |
| HCO3 |
.664 |
-.334 |
|
Cl |
.863 |
.203 |
|
NO3 |
.745 |
-.347 |
|
SO4 |
.810 |
.370 |
|
F |
.558 |
.651 |
|
Fe |
.248 |
-.406 |
|
TDS |
.911 |
.109 |
|
Ec |
.914 |
.213 |
|
pH |
.255 |
.643 |
|
T |
.254 |
.640 |
|
TH |
.899 |
.224 |
Table 7: Rotated Component Matrix Post-monsoon.
|
Rotated Component Matrix Post-monsoon |
|||
|
|
Component |
||
|
1 |
2 |
3 |
|
|
Mg |
.772 |
.403 |
.007 |
|
Ca |
.845 |
.414 |
-.052 |
|
Na |
.636 |
.435 |
.039 |
|
K |
.612 |
.207 |
.208 |
|
HCO3 |
.696 |
-.230 |
.352 |
|
Cl |
.799 |
.370 |
-.069 |
|
NO3 |
.825 |
-.140 |
-.136 |
|
SO4 |
.617 |
.581 |
-.206 |
|
F |
.356 |
.789 |
-.089 |
|
Fe |
-.035 |
.056 |
.867 |
|
TDS |
.853 |
.316 |
-.167 |
|
Ec |
.829 |
.428 |
-.156 |
|
pH |
.313 |
.644 |
-.056 |
|
T |
-.059 |
.603 |
.241 |
|
TH |
.826 |
.416 |
-.027 |
WQI
For the calculation of the WQI, 14 relevant parameters were chosen in the present analysis. The concentration of the WQI was measured using the imbibing water quality criteria advocated by the BIS. For the determination of the water's WQI, the weighted arithmetic index method(Brown 1972)was used.
The WQI used to obtain a detailed image of overall groundwater quality. WQI that represents the cumulative effect of various parameters of water quality on the overall water quality. Three steps were taken to compute the WQI. First, the weight (wi) was allocated to each of the 14 parameters EC, pH, TDS, Ca2+, Mg2+, Cl-, SO42-, NO3-, TH, K+, HCO3-, Na+, Fluorides (F-), and Iron (Fe) and based on its proportional importance in terms of total water quality for drinking. (Table ).
Step 1:
Nitrate was assigned a maximum weight of 5 because of its importance in determining water quality; zinc was assigned a minimum weight of 1 because of its insignificant position. Weights 1 to 5 were allotted to parameters, such as EC, pH, TDS, Ca2+, Mg2+, Cl-, SO42-, NO3-, TH, K+, HCO3-, Na+, Fluorides (F-), and Iron (Fe) based on their relative importance in the water quality assessment. Present investigation for F and Fe has given more weightage because of their impact more in the study area.
Table 8: Weight (wi) and Relative weight (Wi) of parameter.
|
Parameter |
(Sn) |
(wi) |
(Wi) |
|
Ca |
75 |
3 |
0.096774194 |
|
Mg |
30 |
3 |
0.096774194 |
|
Cl |
250 |
2 |
0.064516129 |
|
NO3 |
45 |
1 |
0.032258065 |
|
SO4 |
200 |
3 |
0.096774194 |
|
F |
1 |
3 |
0.096774194 |
|
Fe |
0.3 |
3 |
0.096774194 |
|
TDS |
500 |
4 |
0.129032258 |
|
EC |
300 |
1 |
0.032258065 |
|
TH |
200 |
3 |
0.096774194 |
|
pH |
6.5 – 8.5 |
1 |
0.032258065 |
|
HCO3 |
244 |
1 |
0.032258065 |
|
Na |
20 |
2 |
0.064516129 |
|
K |
10 |
1 |
0.032258065 |
|
31 |
∑ Wi = 1 |
Second, the Wi of the each parameter was calculated using the equation below :
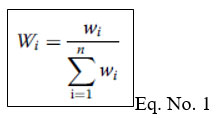
On summation of all selected parameters unit weight factor Wn = 1 (unit).
Step 2:
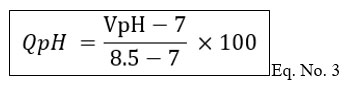
Calculation of Quality rating (Qi) value by using formula.
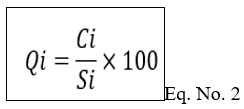
Where
Ci = Mean concentration of the nth parameter.
Si = Standard desirable value of the nth parameter.
Vo = Actual values of the parameter in the pure water. (Generally, Vo = 0, for most of the parameters except pH and Turbidity).
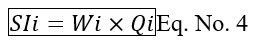
Step 3:
Calculation of Sub-index (SIi) by using formula.
Step 4:
Combining step-2 and step-3. WQI is calculated as follows.

Currently, a groundwater evaluation is being conducted using 14 relevant parameters, then using WQI water has been classified. WQI is one of the most effective strategies for determining groundwater quality. By comparing the WQI analytical results to the disclaimers established by BIS, the groundwater has been evaluated for anthropogenic consumption.The ionic concentration range in groundwater given in Tab.2 and the standard of drinking water set was mentioned in Tab.1. Classification WQI values and type of groundwater for each groundwater sample is given (Tab. 9).
Table 9: Classification of WQI(Brown 1972).
|
WQI Range |
Class of water |
No. of samples |
|||||
|
pre-monsoon |
% |
Sample No. |
post-monsoon |
% |
|
||
|
0-25 |
Excellent |
35 |
36.84 |
1,2,3,4, 8, 9, 11, 13, 14, 15, 17, 18, 19, 20, 21, 22, 23, 24, 36, 40, 49, 50, 51, 52, 53, 55, 56, 57, 58, 59, 60, 61, 62, 59, 88 |
56 |
58.94 |
1, 2, 5, 6, 7, 8, 9, 10, 11, 12, 13, 14, 15, 16, 17, 18, 19, 20, 21, 22, 23, 24, 26, 31, 32, 33, 35, 36, 37, 40, 49, 50, 51, 52, 53, 54, 55, 56, 57, 58, 59, 60, 61, 62, 63, 64, 68, 69, 73, 81, 83, 84, 85, 86, 88, 89 |
|
26-50 |
Good |
27 |
28.42 |
5, 6, 7, 16, 26, 28, 31, 32, 33, 35, 37, 48, 54, 63, 64, 68, 70,72, 73, 80, 81, 83, 84, 85, 86, 87, 89 |
16 |
16.84 |
3, 4, 27, 28, 30, 34, 48, 65, 66, 67, 70, 72, 76, 80, 82, 87, |
|
51-75 |
Poor |
9 |
9.47 |
12, 27, 34, 46, 65, 66, 76, 82, 93 |
9 |
9.47 |
25, 29, 41, 42, 44, 46, 79, 93, 94 |
|
76-100 |
Very Poor |
4 |
4.21 |
41, 42, 94, 95 |
10 |
10.52 |
39, 43, 45, 47, 71, 75, 78, 91, 92, 95 |
|
>100 |
Unfit |
20 |
21.05 |
10, 25, 29, 30, 38, 39, 43, 44, 45, 47, 67, 71, 74, 75, 77, 78, 79, 90, 91, 92 |
4 |
4.21 |
38, 74, 77, 90 |
The calculated values of WQI from 5.42 to 357.51 and 2.52 to 225.97, before and after monsoon respectively. Groundwater has been classified into five classes from "excellent to unfit". The number sample of each class and their percentage are given in Tab.10. Geographically study area can be classified as Malenadu and Maidana. Water quality during pre-monsoon in Malenadu is excellent to good but in Maidana
water quality deteriorating, same consequences repeat in post-monsoon also but the concentration of mineral is low compare to pre-monsoon. Due leaching of mineral in which shows an upper concentration of ions. The spatial variation in the WQI in before and after monsoon given in Fig. 10 & 11
 |
Figure 10: Distribution of WQI Before-monsoon. |
 |
Figure 11: Distribution of WQI After-monsoon. |
Conclusion
Groundwater quality assessment of the study area indicates that most part of the Malenadu area water quality index is under permissible limit in pre-monsoon as well post-monsoon, but when it comes to Maidana area the water quality index value indicating the deteriorated waterquality. Most of the population in the Maidana rely on groundwater for drinking.
To understand the variation in the groundwater quality, descriptive statistics and various thematic were used. PC is constructed and it is useful because it shows the relationship between variables and the function of each parameter. For groundwater quality, the coefficient of correlation and factorial analysis using PCA demonstrated that geological processes are important, such as weathering, industrial discharges, organic matter, and fertilizers from agricultural activities and dissolution of minerals are responsible for the quality of groundwater. In the present study Maidana area shows higher amount of ionic concentration because depth of groundwater higher when it is compared to Malnad area. As the depth increases the interaction between water and its surrounding environment also increases, thus results enrichment of ionic concentration in groundwater.
Water Quality Index play major role in the identifying and maintaining the quality of groundwater for sustainable growth. Allocate resources for drinking depending on the quality of the groundwater in the research area, the WQI changes over time indicate a decline in the quality of groundwater. The GIS application was used to create several digital themed maps, according to the analysis of the data drawn at various phases of the work. The descriptive statistics and WQI suggesting that precedence should be given to water quality monitoring in semi-arid areas like Kadur, Tarikere, and the parts of chikamagaluru taluks. A present study suggesting that the water is unsuitable for human consumption in Maidana area. In order to meetthe potability of groundwater, it is recommended thateffective treatment combined with constantmonitoring is essential to ensure that it meets thestandards of drinking water in Maidana area.
Acknowledgmen
The support of the University of Mysore is acknowledged.
Conflict of Interest
The author(s) declares no conflict of interest.
Funding Sources
No financial support for the research or publication of this article was given to the author(s).
References
- Adams, S., Titus, R., Pietersen, K., Tredoux, G., & Harris, C. (2001). Hydrochemical characteristics of aquifers near Sutherland in the Western Karoo, South Africa. Journal of Hydrology, 241(1–2), 91–103.
CrossRef - Akazem Neisi, Majid Mirzabeygi (Radfard), Ghader Zeyduni, Asghar Hamzezadeh, Davoud Jalili, Abbas Abbasnia, Mahmood Yousefi, Rouhollah Khodadadi, (2018). Data on fluoride concentration levels in cold and warm season in City area of Sistan and Baluchistan Province, Iran, Data in Brief, Volume 18, Pp. 713-718, ISSN 2352-3409, https://doi.org/10.1016/j.dib.2018.03.060.
CrossRef - APHA (2005) Standard methods for the examination of water and wastewater, 21st edn. APHA, Washington DC
- Arumugam, K. (2010) Assessment of Groundwater Quality in Tirupur Region, Ph.D. Thesis (Unpublished). Anna University, Chennai.
- Asit Kumar Batabyal, Surajit Chakraborty (2015) Hydrogeochemistry and Water Quality Index in the Assessment of Groundwater Quality for Drinking Uses. Water Environment Research.
CrossRef - Balasubramanian A., & D. Nagaraju (2019) Water Chemistry Interpretation Techniques (WATCHIT- Software & its Application Manual) Version – 1 open File Report 01, Center for advance Studies, Dept of Studies in Earth Science, University of Mysore.
- Balasubramanian, A., 1986. Hydrogeological investigations of Tambaraparni River Basin, Tamil Nadu, unpublished Ph. D. D Thesis, University of Mysore, 349.
- Behera, B., & Das, M. (2018). Application of multivariate statistical techniques for the characterization of groundwater quality of Bacheli and Kirandul area, Dantewada district, Chattisgarh. Journal of the Geological Society of India, 91(1), 76–80.
CrossRef - BIS (2012). Indian standard drinking water specifications IS 10500:2012. New Delhi: Bureau of Indian Standards.
- Brown, R.M., McClelland, N.I., Deininger, R.A. and O’Connor, M.F., 1972. A water quality index—crashing the psychological barrier. In Indicators of environmental quality (pp. 173-182). Springer, Boston, MA.
CrossRef - CCME (2001) CCME water quality index 1.0 technical report. Available at: http://www.ccme.ca/files/Resources/calculators/WQI%20Technical%20Report%20%28en%29.pdf. Last accessed 12/22/2015. Canadian Council of Ministers of the Environment, Canada
- Central Groundwater Board (CGWB) (2014). Groundwater information Booklet Chikmagalur district, Karnataka. Year Book published By South Western region ; 2013–14.
- Chaurasia, A., Pandey, H., Tiwari, S., Prakash, R., Pandey, P. and Ram, A., (2018) Groundwater Quality assessment using Water Quality Index (WQI) in parts of Varanasi District, Uttar Pradesh, India. Journal of the Geological Society of India, 92(1), pp.76-82.
CrossRef - Fetter, C.W., (1994) Applied hydrogeology. 3rd ed. New York: Macmillan College Publication.
- Freeze, R.A. and Cherry, J.A., 1979. Groundwater (No. 629.1 F7).
- Guo, H., & Wang, Y. (2004). Hydrogeochemical processes in shallow quaternary aquifers from the northern part of the Datong Basin, China. Applied Geochemistry, 19(1), 19–27.
CrossRef - Helena, B., Pardo, R., Vega, M., Barrado, E., Fernandez, J., & Fernandez, L. (2000). Temporal evolution of groundwater composition in an alluvial aquifer (Pisuerga River, Spain) by principal component analysis. Water Research, 34(3), 807–816.
CrossRef - Karanth, K. R. (1987). Groundwater assessment: development and management. New York: Tata McGraw-Hill Education.
- Kaiser, H. F. (1958). The varimax criterion for analytic rotation in factor analysis. Psychometrika, 23(3), 187–200.
CrossRef - Lawrence, F. W., & Upchurch, S. B. (1982). Identification of recharge areas using geochemical factor analysis. Groundwater, 20(6), 680–687.
CrossRef - Mahloch, J. L. (1974). Multivariate techniques for water quality analysis. Journal of the Environmental Engineering Division, 100(5), 1119–1132.
CrossRef - Mahmood Sadat-Noori, Christian Anibas, Martin S. Andersen, William Glamore, (2021)A comparison of radon, heat tracer and head gradient methods to quantify surface water - groundwater exchange in a tidal wetland (Kooragang Island, Newcastle, Australia), Journal of Hydrology, Volume 598, ISSN 0022-1694, https://doi.org/10.1016/j.jhydrol.2021.126281.
CrossRef - Raju, N.J., 2007. Hydrogeochemical parameters for assessment of groundwater quality in the upper Gunjanaeru River basin, Cuddapah District, Andhra Pradesh, South India. Environmental Geology, 52(6), pp.1067-1074.
CrossRef - Rama Rao, N. V. (1982). Geochemical factors influencing the distribution of fluoride in rocks, soil, and water sources of Nalgonda district. AP Thesis, Osmania University, Hyderabad.
- Reghunath, R., Murthy, T. S., & Raghavan, B. R. (2002). The utility of multivariate statistical techniques in hydrogeochemical studies: An example from Karnataka, India. Water Research, 36(10), 2437–2442.
CrossRef - Senthilkumar, G., Ramanathan, A. L., Nainwal, H. C., & Chidambaram, S. (2008). Evaluation of the hydrogeochemistry of groundwater using factor analysis in the Cuddalore coastal region, Tamil Nadu, India.
- Singh, C. K., Shashtri, S., & Mukherjee, S. (2011). Integrating multivariate statistical analysis with GIS for geochemical assessment of groundwater quality in Shiwaliks of Punjab, India. Environmental Earth Sciences, 62(7), 1387–1405.
CrossRef - Subbarao, C., Subbarao, N. V., & Chandu, S. N. (1996). Characterization of groundwater contamination using factor analysis. Environmental Geology, 28(4), 175–180.
CrossRef - Venkanagouda Bhimanagouda B Patil. Shannon Meryl Pinto. Thejashree Govindaraju. Virupaksha Shivakumar Hebbalu. Vignesh Bhat. Lokesh Nanjappa Kannanur(2020). Multivariate statistics and water quality index (WQI) approach for geochemical assessment of groundwater quality—a case study of Kanavi Halla Sub-Basin, Belagavi, India. Environ Geochem Health (2020) 42:2667–2684.
CrossRef


