An Assessment of Soil Quality and Agricultural Production Status in the Alluvial Soil Region: A Case Study in Koch Bihar District, West Bengal, India
Satyajit Das
*
 and Surjapada Paul
http://dx.doi.org/10.12944/CWE.17.1.24
Soil refers to the upper layer of the Earth’s surface, which is made up of a mixture of organic residues, clay, and rock particles, and that's where plants grow. The soil quality is the environmental aspect that is most significant in agricultural activities, as well as for the concern of the safety of agricultural produces. At present-day, soil quality assessment becomes the most important issue because of the raising food security awareness. This study was assessed in Koch Bihar district, West Bengal, India, to quantify soil quality using the weighted Soil Quality Index (SQI) approach. For this assessment, the soil-related data were collected from the Soil Health Card (SHC) of the Agricultural Development Offices in all blocks of Koch Bihar and then analyzed using the principal component analysis (PCA) and expert opinion (EO) method. The weights of the selected soil quality indicators were determined using the integrated Fuzzy-AHP model. According to this method, 12 indicators, i.e., soil pH, soil electrical conductivity (EC), soil organic carbon content, nitrogen content, potassium content, phosphors content, soil texture, the groundwater level in the winter season, cropping intensity, and drainage frequency were considered based on literature review. The SQI assessment was done accordingly for each spatial unit (Block), and the spatial variability of the soil quality map was produced by GIS spatial analysis module. The findings may aid in promoting non-harmful produce production, the provision of scientific data for agricultural structure adjustment, and the maintenance of agricultural sustainability.
Copy the following to cite this article:
Das S, Paul S. An Assessment of Soil Quality and Agricultural Production Status in the Alluvial Soil Region: A Case Study in Koch Bihar District, West Bengal, India. Curr World Environ 2022;17(1). DOI:http://dx.doi.org/10.12944/CWE.17.1.24
Copy the following to cite this URL:
Das S, Paul S. An Assessment of Soil Quality and Agricultural Production Status in the Alluvial Soil Region: A Case Study in Koch Bihar District, West Bengal, India. Curr World Environ 2022;17(1).
Download article (pdf)
Citation Manager
Publish History

Introduction
The dynamic quality of soil properties affected by good management is known to as soil quality. The soil quality concept was familiarizing for correct grouping and allocation of agricultural inputs materials'.1, 2 The ability of the soil to work within a regulated or native ecosystem limits in order to preserve or improve the productivity of the ecosystem's plants and animals is referred to as soil quality.3, 4, 5 As a result, the most significant environmental parameter in the ecosystem is soil quality, which helps the yields and safety of agricultural production.6 The worldwide environmental excellence and food supply were maintained by the soil, and this awareness excites the evaluation and measurement of soil quality.7, 8, 9 The soil quality assessment is very complex as the soil properties may be composed of several features, and there is no set process for selecting soil quality indicators.8 It is frequently difficult to choose how many and which are considered the soil quality indicators for the assessment. 8, 10, 11 To assess the Soil Quality Index (SQI), it is necessary to secure the indicators and determine their respective weight value. Indicators such as soil pH, soil electrical conductivity (EC), soil organic carbon content, nitrogen content, potassium content, phosphors content, sand, silt, clay, groundwater level in the winter season, cropping intensity and drainage frequency were used to determining the SQI. Some statistical processes such as Principal Component Analysis (PCA), Fuzzy set Theory, Analytic Hierarchy Process (AHP), and R (Regression) were expanding to find these indicators selection and weight assignment process. 12, 13, 14
Different types of soils can be found in India, and their creation is influenced by various elements, including elevation, climate, excessive rainfall, and so on. Different types of soil are found in multiple parts of the country. Previously, the soil was classed according to its fertility. The soil was either 'Urvara', which meant fertile, or 'Usara', which meant non-fertile or sterile; however, today, many features are taken into account, and the soil type is classed based on texture, colour, or moisture content, and chemical composition. The Government of India established the Soil Survey of India in 1956 as an entity to study soil and its features. Mountain soil, Laterite soil, alluvial soil, black soil, desert soil, saline soil, red soil and peat soil are some of the soil types found in the country.39, 40 On the basis of chemical composition (mainly pH) there are three types of soil such as, Neutral soil (pH = 7.0), Acidic soil (pH < 7.0) and Alkaline soil (pH > 7.0). 39, 40As alluvial soil is most important for crop production and maintaining food supply over the country, hence the assessment of this type of soil is very much necessary in the present-day context.
Alluvial soils are generated by the sediments carried downstream by the rivers. In the Terai and Teesta alluvial zone, most of the rivers originated in the Himalayas and transported a large amount of silt. Particles such as silt, sand, and clay make up the soil, and it has enough phosphorus, potassium, and lime. There are two types of alluvial soil: (a) old alluvium known as 'bhangar', and (b) young alluvium known as 'khadar'. It's (khadar) also the most important type of soil in the country, accounting for roughly 40% of the total land area. It stretches from Punjab to West Bengal and Assam in the northern plains physiographic unit. In peninsular India, it can also be found in the deltas of rivers like the Krishna, Godavari, Kaveri, and Mahanadi. Alluvial soil is light grey in colour and quite fertile. Wheat, rice, maize, sugarcane, legumes, and oilseeds are the most often grown crops in this soil region.
The Terai and Teesta alluvial zones cover all twelve blocks in the Koch Bihar district, according to the categorization. The creation of effective land-use management systems requires an understanding of the distribution patterns of soil property in spatial aspects as well as in temporal aspects.14, 15, 16 Several investigations are needed to create an acceptable and practical SQI protocol for the wide and harsh tropical monsoon area soils; the current work is an attempt in that regard. It was carried out in a tropical monsoon region soil to assess the soil quality index.
Hence, for this study, the authors took Koch Bihar district in India as an example, using Soil Health Card (SHC) data for the assessment of the spatial variation of the SQI. The SHC indices, those uses for calculation SQI were pH, EC, soil organic carbon content, nitrogen content, potassium content, phosphors content. This evaluation of the SQI was carried out by the integrated Fuzzy-AHP soil quality index model for this study. This SQI assessment can make fertilization more efficient and assist underdeveloped regions and backward rural areas, heavily reliant on the soil for crop production. 14, 17, 18, 19
Materials and Methods
Study area
Koch Bihar district belongs to the Terai-Tista Alluvial Zone. Physiographically, this district has two parts; one is an active alluvial plain, another is a recent alluvial plain, and both are formed by the Tista River. In order, the soil of this study area falls under Entisol, and there is the presence of 4 soil series, i.e., Lotafela, Matiarkuthi, Balarampur, and Rajpur series. The elevation of the study area varying between 30-50 meters above mean sea level and the main rivers run across a level terrain with a small south-eastern slope. (Tista, Torsa, Kaljani, Gadadhar, Raidak, Sankosh) are flow. The climatic condition of this district is humid to peri-humid with an average of 250-300 mm annual rainfall. The maximum temperature in the summer and winter is roughly 33°C in May, with the lowest temperature being 7°C in January. Geographically, this district is located (Fig. 1) in the northeastern part of West Bengal. The latitudinal and longitudinal extension of the study is 25°57?57??N to 26°32?58??N and 88°45?28??E to 89°51?50??E, respectively. The district's overall geographical area is 338700 ha, with 1146 ha of net sown area and 246491 ha of gross cropped land. The district is economically agricultural-based, and most inhabitants depend on agricultural and allied activities. According to Census 2011, the district has 34.74% agricultural labourers and 32.34% cultivators (Koch Bihar District profile, http://www.coochbehar.nic.in/HTMfiles/dist_profile.html).
 |
Figure 1: Location of the study area |
Data sources
The calculation of soil quality index was conducted utilizing a variety of indicators such as soil electrical conductivity (EC), pH, soil organic carbon content, nitrogen content, potassium content, phosphors content, the textural classification (amount of sand, silt, clay), the groundwater level in the winter season, cropping intensity and drainage frequency. The data about the parameters such as 'EC', soil pH, 'OC', 'N' content, 'P' content, and 'K' content were collected from the Soil Health Card (SHC) of existing Agricultural Development Offices in all blocks of Koch Bihar district. The textural classification (amount of sand, silt, clay) of soil were collected from SATSA report Koch Bihar Unit; data about the groundwater level in the winter season were collected from CGWB, Government of India; cropping intensity data were collected from Annual agricultural plan report of Koch Bihar district (2017), and drainage frequency was calculated from Topographical map (No. 125). The available N, P, and K were measured in kilograms per hectare (kg/ha). In contrast, the soil textural elements such as sand, silt, clay content and organic carbon content were measured in percentages (Table 1).
Table 1: The data about soil quality indicators of the district.
|
SQI Indicators |
Spatial Unit (SU) = Block (Administrative Division) |
|||||||||||
|
SU1 |
SU2 |
SU3 |
SU4 |
SU5 |
SU6 |
SU7 |
SU8 |
SU9 |
SU10 |
SU11 |
SU12 |
|
|
pH |
5.78 |
5.43 |
5.59 |
5.64 |
5.95 |
5.6 |
5.69 |
5.55 |
5.33 |
5.33 |
6.16 |
6.55 |
|
EC (ds/m-1) |
0.20 |
0.16 |
0.3 |
0.31 |
0.25 |
0.39 |
0.35 |
0.2 |
0.23 |
0.24 |
0.19 |
0.2 |
|
OC (%) |
0.50 |
0.54 |
0.57 |
0.61 |
0.61 |
0.69 |
0.68 |
0.64 |
0.49 |
0.57 |
0.64 |
0.84 |
|
N (Kg/ha) |
183.48 |
245.07 |
210.04 |
223.58 |
226.55 |
252.62 |
250.67 |
235.57 |
181.08 |
210.95 |
234.18 |
307.95 |
|
P (Kg/ha) |
60.78 |
103.06 |
85.62 |
87.88 |
60 |
144.75 |
126.61 |
90 |
174.3 |
129.9 |
171.47 |
141.7 |
|
K (Kg/ha) |
173.75 |
169.46 |
157.86 |
102.5 |
122.14 |
456.67 |
206.88 |
151.25 |
429.5 |
125 |
136 |
130 |
|
Sand (%) |
36 |
55 |
16.8 |
54 |
54 |
54 |
55 |
54 |
16.8 |
54 |
16.8 |
55 |
|
Silt (%) |
50.3 |
25.1 |
60 |
27.3 |
27.3 |
27.3 |
25.1 |
27.3 |
60 |
27.3 |
60 |
25.1 |
|
Clay (%) |
13.7 |
19.9 |
23.2 |
18.7 |
18.7 |
18.7 |
19.9 |
18.7 |
23.2 |
18.7 |
23.2 |
19.9 |
|
GWL (mbsl) |
2.95 |
2.37 |
3.46 |
3.59 |
2.41 |
3.51 |
3.50 |
2.89 |
3.33 |
2.46 |
4.25 |
2.78 |
|
CI |
207.83 |
214.32 |
185.84 |
256.09 |
217.9 |
192.09 |
158.59 |
149.78 |
210.3 |
153.76 |
211.75 |
183.75 |
|
Df (No./sq.km) |
0.73 |
0.57 |
0.58 |
0.52 |
0.50 |
0.71 |
0.69 |
0.46 |
0.33 |
0.31 |
0.59 |
0.98 |
*SU1= Koch Bihar-I SU2 = Koch Bihar-II; SU3= Dinhata-I; SU4= Dinhata-II; SU5= Haldibari SU6= Mathabhanga-I; SU7= Mathabhanga-II; SU8= Mekhliganj; SU9= Sitai; SU10= Sitalkuchi; SU11=Tufanganj-I; SU12= Tufanganj-II.
Evaluation of Soil quality Index
Four steps (Fig. 2) were taken to calculate SQI: (i) identify the management aim, (ii) selecting indicators, (iii) evaluating the chosen indicators, and (iv) computing SQI. Soil functions include biological diversity preservation, water and solute flow regulation and partitioning, buffering and detoxification of organic and inorganic contaminants, nutrient storage, and cycling the plant support. 4, 20, 21 However, it is widely acknowledged that crop output is stagnating in any region due to inadequate management, largely rain-fed conditions, and a scarcity of resources. 22 The production activity is given top priority among the soil functions in this study, despite the fact that crop cultivation in any region is influenced by the edaphic and non-edaphic parameters of the soil .23
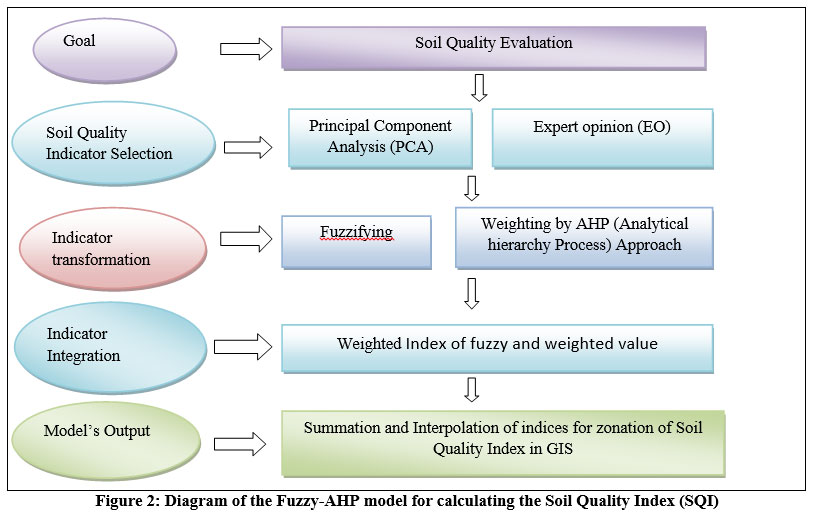 |
Figure 2: Diagram of the Fuzzy-AHP model for calculating the Soil Quality Index (SQI) |
Defining management goal
The main goal is to create a Soil Quality Index (SQI). that spatially varies in the study area and manages crop cultivation. The SQI indicators should be selected based on the important soil properties for cultivation. Individual management goals are common, but these should be socioeconomic based. The farm management is very crucial because land degradation, soil pollution are increase by excessive use of pesticides.
Indicator selection
The principal component analysis (PCA) and expert opinion (EO) were chosen to determine soil quality parameters.
Principal component analysis
Using SPSS (version 20.3), PCA was used to reduce the number of soil quality parameters and derive indices for the soil quality index. The target of PCA was to decrease the number of variables in data while avoiding information loss.24 PCs (Principal component) with higher eigenvalue were determined to be the prime choices for understanding the variability.25 PCs which have the eigenvalue of greater than one or equal to one were adopted because, the eigenvalue less than one accounts for less variation than a single variable performs.26 Thus for soil quality index indicators, highly valued variables were chosen from each PCA analysis. The descriptive statistics and PCA analysis for these soil quality indicators are shown in Table 2 and Table 3, respectively.
Table 2: Soil quality assessment is based on descriptive statistics of soil parameters.
|
Variable |
Min |
Max |
Mean |
Std.dev |
Skewness |
|
pH |
5.33 |
6.55 |
5.72 |
0.36 |
1.28 |
|
EC(ds/m) |
0.16 |
0.39 |
0.25 |
0.07 |
0.76 |
|
Organic Carbon% |
0.49 |
0.84 |
0.62 |
0.10 |
1.01 |
|
Nitrogen(N)Kg/ha |
181.08 |
307.95 |
230.15 |
33.93 |
0.72 |
|
Phosphorus(P)Kg/ha |
60.00 |
174.30 |
114.67 |
39.30 |
0.12 |
|
Potassium(K)Kg/ha |
102.50 |
456.67 |
196.75 |
118.49 |
1.83 |
|
Sand (%) |
16.80 |
55.00 |
43.45 |
16.90 |
-1.01 |
|
Silt (%) |
25.10 |
60.00 |
36.84 |
15.55 |
0.89 |
|
Clay (%) |
13.70 |
23.20 |
19.71 |
2.67 |
-0.55 |
|
Ground water level in winter |
2.37 |
4.25 |
3.13 |
0.58 |
0.30 |
|
Cropping Intensity |
149.78 |
256.09 |
195.17 |
31.04 |
0.14 |
|
Drainage frequency |
0.31 |
0.98 |
0.58 |
0.18 |
0.57 |
Table 3: Variables for principal components, eigenvalues, and component matrices.
|
Eigenvector |
PC 1 |
PC 2 |
PC 3 |
PC 4 |
|
pH |
0.573 |
0.524 |
-0.565 |
0.072 |
|
EC(ds/m) |
0.051 |
0.206 |
0.685 |
0.572 |
|
Organic Carbon% |
0.811 |
0.543 |
0.080 |
-0.055 |
|
Nitrogen(N)Kg/ha |
0.857 |
0.427 |
0.055 |
-0.158 |
|
Phosphorus(P)Kg/ha |
-0.188 |
0.728 |
0.325 |
-0.370 |
|
Potassium(K)Kg/ha |
-0.358 |
0.295 |
0.652 |
0.175 |
|
Sand (%) |
0.801 |
-0.437 |
0.339 |
0.031 |
|
Silt (%) |
-0.802 |
0.366 |
-0.378 |
0.035 |
|
Clay (%) |
-0.401 |
0.641 |
0.056 |
-0.398 |
|
Ground water level in winter |
-0.360 |
0.729 |
0.029 |
0.368 |
|
Cropping Intensity |
-0.234 |
0.007 |
-0.407 |
0.583 |
|
Drainage frequency |
0.661 |
0.438 |
-0.249 |
0.325 |
*Bold face factor loadings were considered highly weighted in MDS.
Expert Opinion
On the other hand, experts believe that characteristics of the study area location, such as climate, rainfall, and associated pedogenic processes that affect soil health, should be taken into account when selecting variables as indicators. Furthermore, it is critical that the indicators were chosen accurately reflect the soil's complexity and function.21 In conclusion, soil quality parameters were chosen depending on available data and literature about the soil of the study area.
Scoring of indicators
Using the linear scoring approach, selected indicators from a minimum data set of soil were evaluated into dimensionless values from 0 to 1.21, 27 The positive or negative relation of a soil parameter with soil quality index was evaluated in ascending or descending order. For this, in the case of positive relation indicators, each value was divided by the highest value, and in the case of negative relation indicators, the lowest value is divided by each particular indicators value. In this study, the Fuzzy-set technique was employed to score the indicators, and AHP was employed to weight the indicators.
Fuzzy set theory
Fuzzy mathematics, fuzzy measurements, fuzzy integrals, and other concepts are all part of the Fuzzy Set Theory.28 Fuzzy logic is one feature of fuzzy mathematics, and it is in this study for scoring the indicators. In classical set theory, a set's identity indicates a right or wrong statement represented as 0 or 1. On the other hand, a Fuzzy set theory allows participants to express themselves on a continuous scale spanning from 0 to 1.29, 30 In this context, the question arise about which value is better? It is depends on the relationship between the particular indicator and the SQI. If the relationship is positive then the value of 1 is better and if the relationship is negative then the value of 0 is better. The fuzzified or normalized value of soil quality indicators is described in Table 4.
Table 4: the spatial distribution of normalized value of soil quality indicators.
|
SQI Indicators |
Spatial Unit (SU) = Block (Administrative Division) |
|||||||||||
|
SU1 |
SU2 |
SU3 |
SU4 |
SU5 |
SU6 |
SU7 |
SU8 |
SU9 |
SU10 |
SU11 |
SU12 |
|
|
pH |
0.64 |
0.92 |
0.79 |
0.75 |
0.49 |
0.78 |
0.70 |
0.82 |
1.00 |
1.00 |
0.32 |
0.00 |
|
EC |
0.82 |
1.00 |
0.39 |
0.35 |
0.61 |
0.00 |
0.17 |
0.83 |
0.70 |
0.65 |
0.87 |
0.83 |
|
OC |
0.02 |
0.14 |
0.23 |
0.34 |
0.34 |
0.57 |
0.54 |
0.43 |
0.00 |
0.23 |
0.43 |
1.00 |
|
N |
0.02 |
0.50 |
0.23 |
0.33 |
0.36 |
0.56 |
0.55 |
0.43 |
0.00 |
0.24 |
0.42 |
1.00 |
|
P |
0.01 |
0.38 |
0.22 |
0.24 |
0.00 |
0.74 |
0.58 |
0.26 |
1.00 |
0.61 |
0.98 |
0.71 |
|
K |
0.20 |
0.19 |
0.16 |
0.00 |
0.06 |
1.00 |
0.29 |
0.14 |
0.92 |
0.06 |
0.09 |
0.08 |
|
Sand |
0.50 |
0.00 |
1.00 |
0.03 |
0.03 |
0.03 |
0.00 |
0.03 |
1.00 |
0.03 |
1.00 |
0.00 |
|
Silt |
0.72 |
0.00 |
1.00 |
0.06 |
0.06 |
0.06 |
0.00 |
0.06 |
1.00 |
0.06 |
1.00 |
0.00 |
|
Clay |
0.00 |
0.65 |
1.00 |
0.53 |
0.53 |
0.53 |
0.65 |
0.53 |
1.00 |
0.53 |
1.00 |
0.65 |
|
GWL |
0.69 |
1.00 |
0.42 |
0.35 |
0.98 |
0.39 |
0.40 |
0.72 |
0.49 |
0.95 |
0.00 |
0.78 |
|
CI |
0.55 |
0.61 |
0.34 |
1.00 |
0.64 |
0.40 |
1.00 |
0.00 |
0.57 |
0.04 |
0.58 |
0.32 |
|
Df |
0.63 |
0.39 |
0.40 |
0.31 |
0.28 |
0.59 |
0.56 |
0.23 |
0.02 |
0.00 |
0.42 |
1.00 |
Analytic Hierarchy Process (AHP)
AHP technique is the most important method for the decision-making process by assigning the weight of the individual criterion. This method is first introduced by Saaty in 1980.31 On each basis, a nine-point scale is utilised to score each criterion's relative preferences.32 The weightage value of each criterion has been assigned according to Saaty’s relative importance scale which has been shown in Table-5. The calculation part of the AHP method has been evaluated sequentially with four respective processes to verify the result is consistent. The processes which are involved in the AHP method are the pairwise comparison matrix process, weight normalization tabulation, weights estimation, and the last stage of the method to check consistency.31,32 The indicators (i.e., soil electrical conductivity (EC), pH, organic carbon (OC) content, nitrogen (N), phosphorus (P) and potassium (K) content, the textural classification (amount of sand, silt, clay), the groundwater level in the winter season, cropping intensity, and drainage frequency), and the factor weights are summarised in the pair-wise comparison matrix (Table 6).
Table 5: The Saaty (2003) scale was used for generation of pair wise comparison matrix.
|
Intensity of importance |
Definition |
|
1 |
Equal importance |
|
2 |
Equal to moderate importance |
|
3 |
Moderate importance |
|
4 |
Moderate to strong importance |
|
5 |
Equally preferred |
|
6 |
Strong to very strong importance |
|
7 |
Very strong importance |
|
8 |
Very strong importance |
|
9 |
Extreme importance |
Table 6: Pair wise comparison matrix for calculating fertility factor weights for each indicator of Soil quality Index.
|
|
pH |
EC |
OC |
N |
P |
K |
Sand |
Silt |
Clay |
GWL |
CI |
DF |
Weight |
|
pH |
1.00 |
|
|
|
|
|
|
|
|
|
|
|
0.196 |
|
EC |
1.00 |
1.00 |
|
|
|
|
|
|
|
|
|
|
0.159 |
|
Organic Carbon(OC) |
0.25 |
1.00 |
1.00 |
|
|
|
|
|
|
|
|
|
0.133 |
|
Nitrogen(N) |
1.00 |
1.00 |
1.00 |
1.00 |
|
|
|
|
|
|
|
|
0.181 |
|
Phosphorus(P) |
0.20 |
0.25 |
0.50 |
0.20 |
1.00 |
|
|
|
|
|
|
|
0.093 |
|
Potassium(K) |
0.20 |
0.20 |
0.25 |
0.20 |
0.25 |
1.00 |
|
|
|
|
|
|
0.053 |
|
Sand |
0.25 |
0.25 |
0.20 |
0.17 |
0.25 |
0.33 |
1.00 |
|
|
|
|
|
0.028 |
|
Silt |
0.20 |
0.20 |
0.25 |
0.20 |
0.25 |
1.00 |
1.00 |
1.00 |
|
|
|
|
0.052 |
|
Clay |
0.25 |
0.25 |
0.20 |
0.17 |
0.20 |
0.33 |
1.00 |
1.00 |
1.00 |
|
|
|
0.041 |
|
Ground water level in winter (GWL) |
0.20 |
0.20 |
0.20 |
0.20 |
0.33 |
0.25 |
1.00 |
0.17 |
0.20 |
1.00 |
|
|
0.021 |
|
Cropping Intensity (CI) |
0.25 |
0.25 |
0.20 |
0.17 |
0.25 |
0.33 |
1.00 |
0.20 |
0.50 |
1.00 |
1.00 |
|
0.023 |
|
Drainage frequency (DF) |
0.20 |
0.20 |
0.20 |
0.17 |
0.25 |
0.25 |
1.00 |
0.17 |
0.20 |
1.00 |
1.00 |
1.00 |
0.020 |
The consistency ratio (CR) is the proportion of the consistency index to the resulting consistency index.14, 32 If the CR is less than or equal to 0.1, then it is allowed; however, if the CR is greater than 0.1, the subjective judgment must be changed.
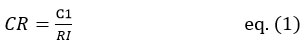
Where, RI = the resultant consistency index's average, which depends on CI = index of consistency, is expressed as:
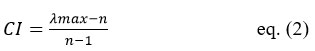
Where, λmax = the largest individual value in the matrix is max, and the order of the matrix is n - 1. The CR is a scale from 0 to 1, with 1 representing the likelihood of a randomly generated matrix and CR less than 0.10 suggesting a good amount of homogeneity.32 The weights that resulted have an acceptable CR, as indicated in Table 6. The weights should sum up to 1.0 according to the linear weighted combination computation rule.14
SQI calculation
To calculate SQI, we used data about soil profiles from the Soil Health Card (SHC). Soil parameters at the surface (0-15 cm) are more dynamic, indicating that the soil is in a state of flux. 25 SQI for surface depths was calculated through a weighted additive index by the Fuzzy-AHP model.
Fuzzy-AHP model
The Fuzzy-AHP method is made up of the AHP weight of the factor and the Fuzzy values for each parameter. The final soil quality map was made using the sum of the individual soil quality parameters' values generated by the Fuzzy-AHP method. The following formula is described the method:

Where, μ= the participant function for each parameter, W = the weight of each parameter. Weights were assigned to the indicators chosen by PCA and EO methods depending on the relative value of each indication determined by the Fuzzy AHP approach. The weighting factor was chosen so that the sum of all elements equals one of the soil functions. Then the weighted variables were added to derive the Soil Quality Index (SQI) value for all the blocks of the entire district. The weighted layers were combined in GIS to create the final soil quality zonation maps for the study area. Table 7 shows the statistical values of the soil quality index indicators developed using the Fuzzy-AHP model.
Table 7: the statistical values of soil quality index indicators’ developed by Fuzzy-AHP model.
|
SQI Indicators |
Spatial Unit (SU) = Block (Administrative Division) |
|||||||||||
|
SU1 |
SU2 |
SU3 |
SU4 |
SU5 |
SU6 |
SU7 |
SU8 |
SU9 |
SU10 |
SU11 |
SU12 |
|
|
pH |
0.12 |
0.18 |
0.15 |
0.15 |
0.10 |
0.15 |
0.14 |
0.16 |
0.20 |
0.20 |
0.06 |
0.00 |
|
EC |
0.13 |
0.16 |
0.06 |
0.06 |
0.10 |
0.00 |
0.03 |
0.13 |
0.11 |
0.10 |
0.14 |
0.13 |
|
OC |
0.00 |
0.02 |
0.03 |
0.05 |
0.05 |
0.08 |
0.07 |
0.06 |
0.00 |
0.03 |
0.06 |
0.13 |
|
N |
0.00 |
0.09 |
0.04 |
0.06 |
0.06 |
0.10 |
0.10 |
0.08 |
0.00 |
0.04 |
0.08 |
0.18 |
|
P |
0.00 |
0.04 |
0.02 |
0.02 |
0.00 |
0.07 |
0.05 |
0.02 |
0.09 |
0.06 |
0.09 |
0.07 |
|
K |
0.01 |
0.01 |
0.01 |
0.00 |
0.00 |
0.05 |
0.02 |
0.01 |
0.05 |
0.00 |
0.01 |
0.00 |
|
Sand |
0.01 |
0.00 |
0.03 |
0.00 |
0.00 |
0.00 |
0.00 |
0.00 |
0.03 |
0.00 |
0.03 |
0.00 |
|
Silt |
0.04 |
0.00 |
0.05 |
0.00 |
0.00 |
0.00 |
0.00 |
0.00 |
0.05 |
0.00 |
0.05 |
0.00 |
|
Clay |
0.00 |
0.03 |
0.04 |
0.02 |
0.02 |
0.02 |
0.03 |
0.02 |
0.04 |
0.02 |
0.04 |
0.03 |
|
GWL |
0.01 |
0.02 |
0.01 |
0.01 |
0.02 |
0.01 |
0.01 |
0.02 |
0.01 |
0.02 |
0.00 |
0.02 |
|
CI |
0.01 |
0.01 |
0.01 |
0.02 |
0.01 |
0.01 |
0.02 |
0.00 |
0.01 |
0.00 |
0.01 |
0.01 |
|
Df |
0.01 |
0.01 |
0.01 |
0.01 |
0.01 |
0.01 |
0.01 |
0.00 |
0.00 |
0.00 |
0.01 |
0.02 |
Source: Computed by the author
Validation of Soil Quality Index (SQI)
By computing correlation coefficients, the SQIs predicted from the Fizzy-AHP model were validated against Paddy, Jute, Potato, Maize, and Mustard yield data. The SQI values were also compared and found to be related to the above-mentioned crop's block-wise yield rate.
Assessment of spatial variation of soil quality
The assessment of the spatial variation of soil quality was done by using the spatial autocorrelation among the soil quality index value of 12 blocks in the study area. According to Salima and de Bellefon, the positive or negative correlation of a variable with itself due to the spatial location of the observation, is known as spatial autocorrelation.34The most familiar Moran's Index is used to check the spatial autocorrelation between any variable and spatial location. The Moran's index value ranged from positive 1 to negative 1. The negative 1 value indicates perfectly spatial heteroscedasticity, i.e., the value is spatially dispersed, and the positive 1 value indicates perfectly homoscedasticity, i.e., the value is spatially clustered. The Moran's index calculation equation is present below:

Where, N= number of the spatial unit, Σi Σj wij= summation of neighborhood relation through the matrix, Σ i (Xi - X)2 = summation of deviation, Σi Σj wij(Xi – X?)(Xj – X?) = summation of neighborhood deviation through the matrix.
Discussion
Spatial distribution of soil quality indicators
The indicators used to calculate the soil quality index are pH, EC, soil organic carbon content, nitrogen content, potassium content, phosphors content are shown in Fig. 3 and the textural classification (amount of sand, silt, clay), the groundwater level in the winter season, cropping intensity, drainage frequency is showed in Fig. 4. Sometime fertilizers are used widely, resulting in an unbalanced distribution of these inputs, and it frequently occurs due to a lack of information on the variability of soil quality indicators in different blocks of the study area. Some locations receive more than what is required, while others receive less. So, for the spatial variation of soil quality index, the spatial variation of its' indicators assessment is necessary for the study area, and it is discussed as follows:
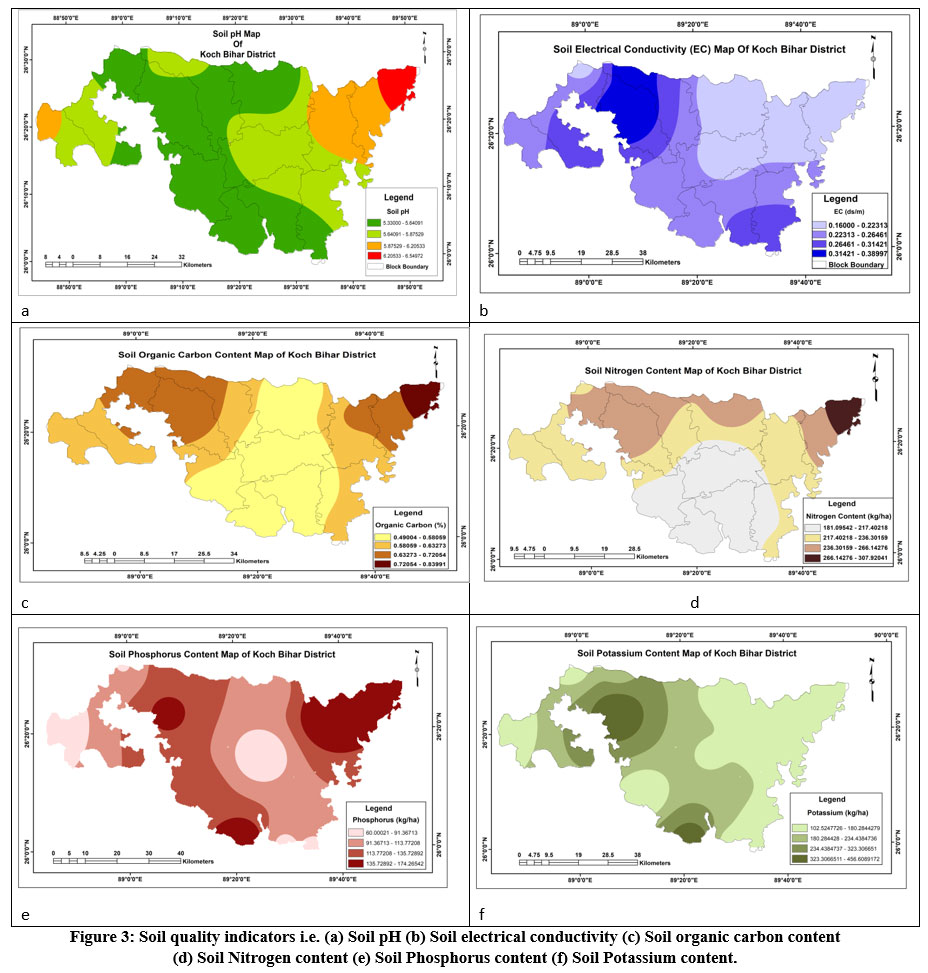 |
Figure 3: Soil quality indicators i.e. (a) Soil pH (b) Soil electrical conductivity (c) Soil organic carbon content (d) Soil Nitrogen content (e) Soil Phosphorus content (f) Soil Potassium content. Click here to view Figure |
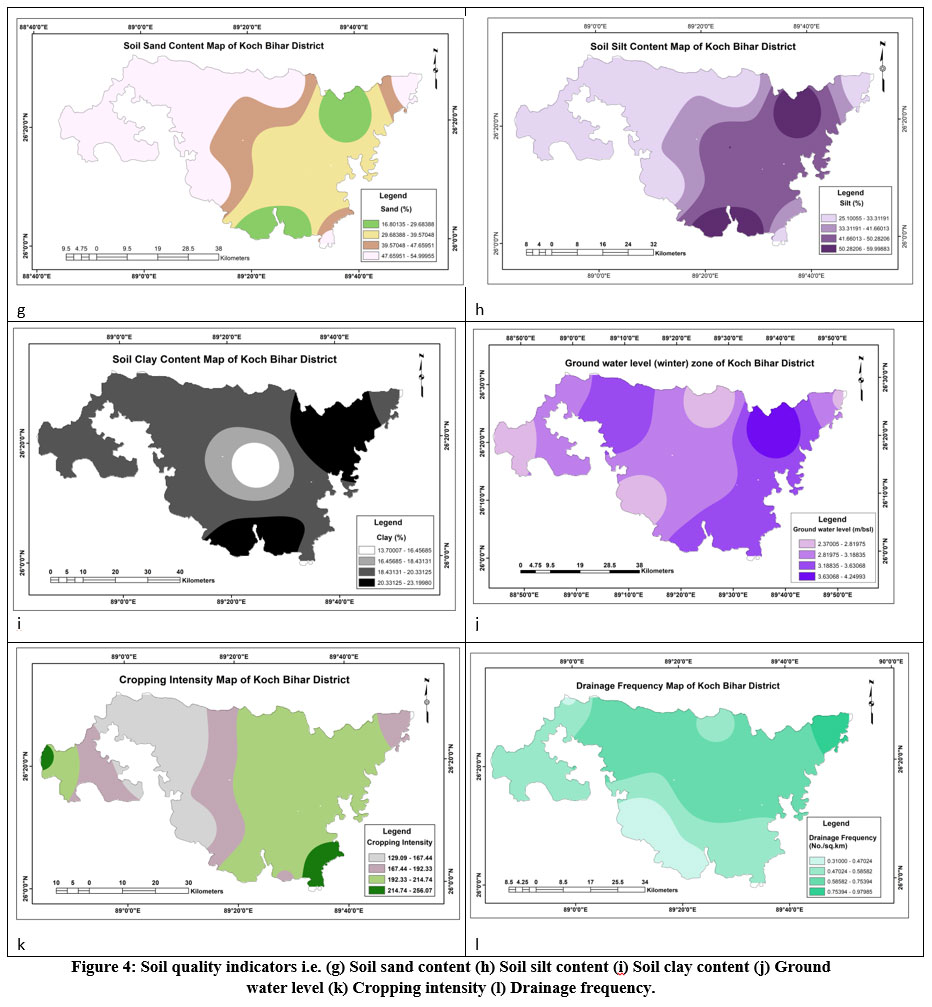 |
Figure 4: Soil quality indicators i.e. (g) Soil sand content (h) Soil silt content (i) Soil clay content (j) Ground water level (k) Cropping intensity (l) Drainage frequency. Click here to view Figure |
The soil electrical conductivity (EC) values were found to be distributed in a range of 0.16 ds/m to 0.39 ds/m. The EC distribution zones in the study area are classified into four classes based on natural break classification. The results of the classification revealed that the soil EC values of 0.16 to 0.22 ds/m belong in the north eastern part of the district, whereas the highest class, i.e., 0.31 to 0.39 ds/m, has belonged in the north western part of the district. The pH of the soil was generally basic and within the crucial ranges ranging from 5.33 in larger parts of the north western and south western part to 6.55 in distribution northeastern of the plain of the district. The organic carbon (OC) content of the soil was observed to be distributed in a range of 0.49 to 0.84 percent. In some areas, such as the northeastward and lower in all other parts of the study area the organic carbon was higher. In the majority of the study area, total nitrogen content in soil was low, ranging from 181.08 kg/h to 307.95 kg/h. N total had a similar spatial distribution pattern as organic carbon, with more concentrations in the northeastern section and less concentrations in the rest of the area. The phosphorous content of the soil ranged between 60 kg/h to 174.30 kg/h in the study area, and this was beyond the critical value. The spatial distribution pattern of P was highly concentrated in the northeastern part, which is 135kg/h to 174 kg/h, and the lowest concentration of P was distributed in the middle and western part of the study area, which is approximately 60 kg/h to 91 kg/h. The potassium content of the soil ranged between 65.21kg/h to 619.88 kg/h in the study area. Higher concentrations of accessible K were detected in the northwestern and southern parts of the study area, while lower concentrations were found mostly in the western, northeastern, and southeastern patches in that region. Soil texture refers to the proportion of sand, silt, and clay-sized particles that make up the mineral component of the soil. Available sand ranged between 16.80% to 55%, and higher concentration sand are distributed in the western and northwestern part, whereas lower concentration sand is distributed in the southern and northeastern part of the study area. Available silt ranged between 25.10 % to 59.99 %, the distribution pattern of silt is approximately the same as sand distribution. Available clay content is ranged between 13.70 % to 23.20 %, and higher concentration clay is distributed in the southern and northeastern parts, whereas lower concentration clay is distributed in the central portion of the study area. The relation between soil quality and groundwater level in winter is reciprocal, i.e., if the groundwater level (mbsl) increases, then the soil quality decrease 35 The range of groundwater levels in the winter season in the study area is 2.37 mbsl to 4.25. mbsl in the study area. Groundwater level below sea level is higher in the northeastern portion and lower through the western and southwestern parts of the study area. Generally, where the cropping intensity is high, the quality of soil is better. The cropping intensity ranged between 149.78 to 256.09, whereas it is high in the western and southeastern parts and low in the northwestern part of this district. Drainage water management is expected to result in a minor increase in soil organic matter content, which would be beneficial to soil quality.36 Drainage frequency is high in northern and northeastern parts and low in the southwestern part of the study area. Throughout the district, the data about soil quality indicators of 12 blocks are revealed in Table 1.
Spatial variability of soil quality status
The spatial variability of soil quality in the district was determined with the help of Fuzzy-AHP model and Moran's index. Fuzzy-AHP model was used to determine soil quality indicators weights and Moran's index was use to analysis the spatial variation of soil quality. According to this method, 12 indicators such as electrical conductivity (EC), soil pH, organic carbon (OC) content, available nitrogen (N) content, phosphorus (P) content, potassium (K) content, amount of sand, silt, clay, the groundwater level in the winter season (GWL), cropping intensity (CI) and drainage frequency (Df) were selected.8 Based on Delsouz Khaki et al. (2017) (Table 8) there are five soil quality classes such as very low (VL) (0.00 to < 0.25), low (L) (0.25 to < 0.50), moderate (M) (0.50 to < 0.75), high (H) (0.75 to < 0.90) and very high (VH) (0.90 to < 1.00). The soil quality indexes of the study area which was assessed in this study are varied from low to moderate class.
Table 8: the soil quality indices and the corresponding Quality classes.
|
Soil Quality class |
Soil Quality index |
|
Very Low (VL) |
0.00 to < 0.25 |
|
Low (L) |
0.25 to < 0.50 |
|
Moderate (M) |
0.50 to < 0.75 |
|
High (H) |
0.75 to < 0.90 |
|
Very High (VH) |
0.90 to < 1.00 |
Source: Delsouz Khaki et al. 2017
The soil quality indices predicted by the Fuzzy-AHP in the study region are shown on a scale of 0 to 1, with soil quality indices ranging from 0.36 to 0.59 in the study area it was covered all the blocks of the district, as displayed in Fig. 5 (a). The soil quality classification was revealed in a few isolated places, and poor soil quality was observed in the western, middle, and southeasterly parts of the study area and moderate towards the southwest, northern, and eastern portion of the plain. Among the 12 blocks, the soil quality index is spatially varied from one block to another such as, the SQI of Sitai (0.59), Tufanganj- II (0.59), Tufanganj- I (0.57), Koch Bihar- II (0.56), Mathabhanga- I (0.51), Mekhliganj- (0.50) belongs to moderate SQI, and rest of them such as Mathabhanga-II (0.48), Sitalkuchi (0.48), Dinhata-I (0.46), Dinhata-II (0.39), Haldibari (0.37), Koch Bihar-I (0.36) belongs to low SQI, as depicted in Table 9. The Moran's index of 12 spatial units (block) is -0.22 (Fig. 5 b), which means the distribution pattern of SQI values is heterogeneous. The soil quality is spatially varied from one spatial unit to another through the study area.
 |
Figure 5: (a) Spatial variation of soil quality Index (b) Moran's index of the study area |
Table 9: spatial variation Soil Quality Index class in the study area
|
Name of the Block |
SOI value |
SQI class |
Moran’s Index |
|
Sitai |
0.59 |
Moderate (M) class (0.50 to < 0.75) |
- 0.22 |
|
Tufanganj- II |
0.59 |
||
|
Tufanganj- I |
0.57 |
||
|
Koch Bihar- II |
0.56 |
||
|
Mathabhanga- I |
0.51 |
||
|
Mekhliganj |
0.50 |
||
|
Mathabhanga-II |
0.48 |
Low (L) class (0.25 to < 0.50) |
|
|
Sitalkuchi |
0.48 |
||
|
Dinhata-I |
0.46 |
||
|
Dinhata-II |
0.39 |
||
|
Haldibari |
0.37 |
||
|
Koch Bihar-I |
0.36 |
Source: Computed by the author
The correlation between Soil Quality Index (SQI) and agricultural production in the study area
The soil in the study area varies from moderate to low quality. Paddy, jute, maize, potato, wheat, mustard, and several types of pulses are grown in the study region. The yield rate of paddy is high in Koch Bihar II (7724 kg/hectare) block and low in Dinhata II(2663 kg/hectare) block, similarly the Jute yield rate is high in Sitalkuchi (16.81kg/hectare) block and low in Mathabhanga-I (9.61kg/hectare) block; The potato yield is high in Mathabanga –I block and lowest in Sitai block; the mustard yield rate is high in Haldibari (934 kg/hectare) block and low in Mekhliganj (314 kg/hectare) block but the maize yield rate (2267 kg/hectare) is almost same through the entire district (http://www.coochbehar.nic.in/HTMfiles/dist_profile.html). The agricultural productions are varied with the variation of soil quality index in the study area. The cultivation preference orders from the selected major produced crops such as paddy, jute, maize, potato, wheat, and mustard are analyzed by the correlation between crop yield and soil quality index in each spatial unit in this district. The correlation values between crop yield and SQI ranged from 0.0009 to 0.2028, according to the analysis (Fig. 6). In the study area, paddies (0.2028) have the highest preference for cultivation, and it is followed by jute (0.1172), wheat (0.0222), maize (0.0133), potato (0.0035), and mustard (0.0009) which is shown in Table10.
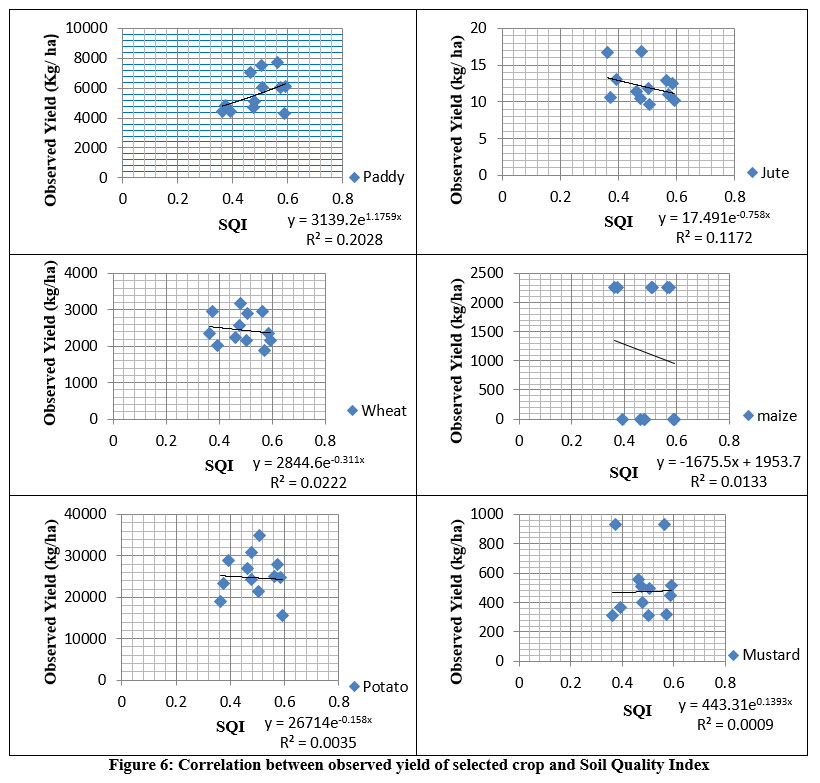 |
Figure 6: Correlation between observed yield of selected crop and Soil Quality Index |
Table 10: The correlation value of the preferred order for the production of selected crops.
|
Crop |
Correlation between crop yield and SQI |
|
Paddy |
0.2028 |
|
Jute |
0.1172 |
|
wheat |
0.0222 |
|
Maize |
0.0133 |
|
Potato |
0.0035 |
|
Mustard |
0.0009 |
Source: Computed by the author
Conclusion
There are two reasons why soil quality is crucial. First, improper soil use can harm both the soil and the ecosystem; as a result, land management must be tailored to the soil's capabilities. Second, we must have a baseline understanding of soil quality in order to detect changes as they occur. So, the main objective of soil quality assessment is to safeguard and increase agricultural production, water quality, and shelters for all animals, including humans, over the long run. Soil quality research has recently concentrated on the connections between management techniques and systems, visible soil properties, soil activities, and soil utility efficiency. When selecting the relevant soil qualities to include in an index, site-specific and user oriented management goals must be considered, as well as focusing on crop productivity, consider sustainability. These measures would be beneficial in determining the soil's weakness and identifying how better management could improve its resilience.
This work made a methodological addition by developing an integrated Fuzzy-AHP with GIS technique based on the degree of certainty for all the soil quality criteria. The foundations of the PCA, AHP, and Fuzzy-AHP approaches were introduced for this aim. The soil quality indices for paddy, jute, maize, potato wheat, and mustard production ranged from low to moderate, according to the Fuzzy-AHP analysis in this district which belongs to the alluvial soil zone. AHP and Fuzzy-AHP both proposed identical decision-making alternatives, which is that the Koch Bihar district is somewhat moderately suitable for cash crops. The pH and electrical conductivity (EC) distributions were within the threshold value for the below and slightly over the required accordingly in this study region. Furthermore, the most relevant parameters on soil quality were discovered to be pH, EC, OC, and N content concentration, and soil quality indices predicted by Fuzzy-AHP models were correlated with the selected crops' yield. The crops sequence of paddy, jute, wheat, maize, potato, and mustard is most desirable in the studied district; according to the Fuzzy-AHP analysis, when compared to these different types of crops production, the validation employing linear regression analyses was found to be very simple and transparent for decision-makers to understand. The results showed that the Fuzzy-AHP decision problem solution was more accurate and less sensitive to the criteria weights than the solution achieved using other methods. So, a prospective crop for cultivation was identified in this research, and the Smallholder farm productivity in the area is gradually increased. It also showed how soil quality indexing can be used to detect changes in soil and crop management that are needed for more effective and long-term use of land resources.
Acknowledgement
The authors will thankful to the Agricultural Development Office (ADO) of different block in the district for providing the Soil Health Card (SHC) data.
Funding source
There is no funding or financial support for this research work.
Statement of the Conflict of interest
There are no potential conflicts of interest for the authors to disclose. The co-author has viewed the document and agrees with its contents, and there is no financial interest to reveal.
References
- Warkentin B. P, Fletcher H. F. Soil quality for intensive agriculture. Proceedings of the International Seminar on Soil Environment and Fertility Management in Intensive Agriculture. 2013; 19:594-598.
- Sharma K. L., Mandal B., Venkateswarlu B. Soil quality and productivity improvement under rain fed conditions–Indian perspectives. Resource management for sustainable agriculture. 2012; 24:203-230.
CrossRef - Klute A. Methods of Soils Analysis: Physical and Mineralogical Methods. ASA. 1986;1:20-30
CrossRef - Karlen D. L, Mausbach M. J, Doran J. W, Cline R. G, Harris R. F, Schuman G. E. Soil quality: a concept, definition, and framework for evaluation (a guest editorial). Soil Science Society of America Journal.1997; 61(1):4-10.
CrossRef - Sanchez-Hernandez, J. C. Pesticide biomarkers in terrestrial invertebrates. Pesticides in the Modern World-Pests Control and Pesticides Exposure and Toxicity Assessment. InTech. 2011;3:213-240.
- Wang X & Gong Z. Assessment and analysis of soil quality changes after eleven years of reclamation in subtropical China. Geoderma.1998;81(3-4):339-355.
CrossRef - Milner K. S., Running S. W., & Coble D. W. A biophysical soil–site model for estimating potential productivity of forested landscapes. Canadian Journal of Forest Research.1996;26(7): 1174-1186.
CrossRef - Li H., Chen X., Cai X., He L., Huang W. Assessment of soil quality using GIS & RS. International Geoscience and Remote Sensing Symposium.2005;4:2972-2975. DOI: 10.1109/IGARSS.2005.1525693.
CrossRef - Doran J. W, & Parkin T. B. Defining and assessing soil quality. Defining soil quality for a sustainable environment. 1994;35:1-21. DOI: https://doi.org/10.2136/sssaspecpub35.c1.
CrossRef - Wang Z., Chang A.C., Wu L., Crowley D. Assessing the soil quality of long-term reclaimed wastewater-irrigated cropland. Geoderma. 2003;114(3-4):261-278. DOI: 10.1016/S0016-7061(03)00044-2.
CrossRef - Nabiollahi K., Taghizadeh-Mehrjardi R., Kerry, R., & Moradian S. Assessment of soil quality indices for salt-affected agricultural land in Kurdistan Province, Iran. Ecological indicators. 2017; 83: 482-494.
CrossRef - Zornoza R., Mataix-Solera J., Guerrero C., Arcenegui V., García-Orenes F., Mataix- Beneyto J., & Morugán A. Evaluation of soil quality using multiple lineal regression based on physical, chemical and biochemical properties. Science of the Total Environment. 2007;378(1-2):233-237.
CrossRef - De la Rosa D & Sobral R. Soil quality and methods for its assessment. Land use and soil resources, Springer, Dordrecht. 2008;5:167-200
CrossRef - Keshavarzi A. & Kumar V. Spatial distribution and potential ecological risk assessment of heavy metals in agricultural soils of Northeastern Iran. Geology, Ecology, and Landscapes. 2020 4(2):87-103. DOI: https://doi.org/10.1080/24749508.2019.1587588.
CrossRef - Rashed H. S. Determination of Soil Productivity Potentials: A Case Study in El- Sharkia Governorate of Egypt. Egyptian Journal of Soil Science.2016;56(4):639-665.
CrossRef - Zeraatpisheh M., Ayoubi S., Jafari A., Tajik S., Finke P. Digital mapping of soil properties using multiple machine learning in a semi-arid region, central Iran. Geoderma. 2019; 338: 445-452. DOI: https://doi.org/10.1016/j.geoderma.2018.09.006.
CrossRef - Stocking M. A. Tropical soils and food security: the next 50 years. Science.2003; 302(5649): 1356-1359.
CrossRef - Mwango S. B., Msanya B.M., Mtakwa P. W., Kimaro D.N., Deckers J., Poesen J., Sanga R. Soil loss due to crop harvesting in Usambara Mountains, Tanzania: the case of carrot, onion and potato. International Journal of Plant & Soil Science.2015;4(1):18-28. DOI: 10.9734/IJPSS/2015/12479.
CrossRef - Debiase G., Montemurro F., Fiore A., Rotolo C., Farrag K., Miccolis A., Brunetti G. Organic amendment and minimum tillage in winter wheat grown in Mediterranean conditions: Effects on yield performance, soil fertility and environmental impact. European Journal of Agronomy.2016; 75:149-157. DOI: https://doi.org/10.1016/j.eja.2015.12.009.
CrossRef - Smith J. L., & Doran J. W. Measurement and use of pH and electrical conductivity for soil quality analysis. Methods for assessing soil quality.1997;49: 169-185.
CrossRef - Vasu D., Singh S. K., Ray S. K., Duraisami V. P., Tiwary P., Chandran P., Anantwar S. G. Soil quality index (SQI) as a tool to evaluate crop productivity in semi-arid Deccan plateau, India. Geoderma. 2016;282:70-79. DOI:
https://doi.org/10.1016/j.geoderma.2016.07.010.
CrossRef - Sahrawat K. L., Wani S.P. Soil testing as a tool for on-farm fertility management: experience from the semi-arid zone of India. Communications in soil science and plant analysis. 2013; 44(6): 1011-1032. DOI: 10.1080/00103624.2012.750339.
CrossRef - El-Nady M. A. Evaluation of the productivity of two soils using productivity index. Egyptian Journal of Soil Science.2015;55(2): 171-184.
CrossRef - Armenise E., Redmile-Gordon M. A., Stellacci A. M., Ciccarese A., Rubino P. Developing a soil quality index to compare soil fitness for agricultural use under different managements in the Mediterranean environment. Soil and Tillage Research.2013;130:91-98. DOI: https://doi.org/10.1016/j.still.2013.02.013.
CrossRef - Andrews S. S., Karlen D. L., Mitchell J. P. A comparison of soil quality indexing methods for vegetable production systems in Northern California. Agriculture, ecosystems & environment. 2002;90(1), 25-45. DOI: https://doi.org/10.1016/S0167- 8809(01)00174-8.
CrossRef - Cliff N. The eigenvalues-greater-than-one rule and the reliability of components. Psychological bulletin.1988; 103(2): 276. DOI: https://doi.org/10.1037/0033- 2909.103.2.276.
- CrossRef
- Liebig M. A., Varvel G., Doran J. A simple performance? based index for assessing multiple agro ecosystem functions. Agronomy Journal.2001;93(2):313-318.DOI: 10.2134/agronj2001.932313x.
CrossRef - Wan J. G., Yang L. Z., & Shan Y. H. Application of fuzzy mathematics to soil quality assessment. Acta Pedologica Sinica.2001; 38:176-183.
- Xiang W. N., Gross M., Fabos J. G., & MacDougall E. B. A fuzzy-group multicriteria decisionmaking model and its application to land-use planning. Environment and planning B: Planning and Design.1992;19(1): 61-84.
CrossRef - Jiang H., Eastman J. R. Application of fuzzy measures in multi-criteria evaluation in GIS. International Journal of Geographical Information Science.2000;14(2):173-184. DOI: https://doi.org/10.1080/136588100240903.
CrossRef - Saaty T. L. How to make a decision: the analytic hierarchy process. European journal of operational research.1990;48(1):9-26. DOI: https://doi.org/10.1016/0377- 2217(90)90057-I.
CrossRef - Malczewski J. GIS? based multicriteria decision analysis: a survey of the literature. International journal of geographical information science.2006;20(7):703-726. DOI: https://doi.org/10.1080/13658810600661508.
CrossRef - Saaty T. L. Analytic hierarchy process. Encyclopedia of biostatistics.2005; DOI: https://doi.org/10.1002/0470011815.b2a4a002.
CrossRef - Salima B. A., de Bellefon M. Spatial Autocorrelation Indices. Handbook of Spatial Analysis. Statistical Journal of the IAOS.2018;36(1): 87-102
- Yan S. F., Yu S. E., Wu Y. B., Pan D. F., She D. L., Ji J. Seasonal variations in groundwater level and salinity in coastal plain of eastern China influenced by climate. Journal of Chemistry. 2015;(1)DOI: 10.1155/2015/905190.
CrossRef - Obalum SE, Chibuike GU, Peth S, Ouyang Y (2017) Soil organic matter as sole indicator of soil degradation. Environmental monitoring and assessment, 189(4), 176. Doi: 10.1007/s10661-017-5881-y.
CrossRef - Zhang. Q., Yang. Z., Li Y., Chen D., Zhang J., & Chen M. Spatial variability of soil nutrients and GIS-based nutrient management in Yongji County, China. International Journal of Geographical Information Science. 2010; 24(7): 965-981.
CrossRef - Delsouz Khaki B., Honarjoo N., Davatgar N., Jalalian A., Torabi Golsefidi H. Assessment of two soil fertility indexes to evaluate paddy fields for rice cultivation. Sustainability. 2017; 9(8): 1299. DOI: 10.3390/su9081299.
CrossRef - Mishra B. B. Indian system of soil classification: a way forward. Agric Res Technol Open Access J. 2016; 3(2): 555606.
CrossRef - Bhattacharyya T., Pal D. K., Mandal C., Chandran P., Ray S. K., Sarkar D., & Nimkhedkar S. S. Soils of India: historical perspective, classification and recent advances. Current Science. 2013;25:1308-132.


