Determination of Air Quality Life Index (AQLI) In Medinipur City of West Bengal (India) During 2019 to 2020: A Contextual Study
Samiran Rana
*

http://dx.doi.org/10.12944/CWE.17.1.12
Copy the following to cite this article:
Rana S. Determination of Air Quality Life Index (AQLI) In Medinipur City of West Bengal (India) During 2019 to 2020: A Contextual Study. Curr World Environ 2022;17(1). DOI:http://dx.doi.org/10.12944/CWE.17.1.12
Copy the following to cite this URL:
Rana S. Determination of Air Quality Life Index (AQLI) In Medinipur City of West Bengal (India) During 2019 to 2020: A Contextual Study. Curr World Environ 2022;17(1). Available From:
Download article (pdf) Citation Manager Publish History

Introduction
The Air Quality Index (AQI) doesn't precisely decide the unsafe impacts of air pollutants on human health. Although most developing countries utilize their own air quality indicators, they are unable to give the public a positive idea of how harmful air pollutants are. Particulate matter (solid and fluid particles such as ash, smoke, residue, and others that are suspended and noticeable all around) is a vital and significant pollutant in the ambient air that can shorten human LE and is estimated by an exceptionally evolved technique called the Air Quality Life Index (AQLI). Different research has shown that there is a link between human life expectancy and atmospheric particle (PM2.5) exposure. For instance, in the United States during the 1980s and 1990s, an immediate appraisal of the differential fluctuation of PM2.5 air pollution utilizing regression models, assembling data on LE, financial status, and populace attributes, showed that the decrease in ambient PM2.5 concentration per 10 μg/m3 expanded average human LE by 0.61 (SE ± 0.20) years.6 Using the same method, combining a dataset for 545 U.S. counties from 2000 to 2007, the county-specific (annual) average PM2.5, the county-specific (annual) LE, and socioeconomic status, smoking trend changes assess a reduction in fine particle concentration of 10 µg/m3 associated with an increase in human LE of 0.35 years (standard deviation of 0.16 years).7 To determine the relationship between PM2.5 density and LE in adults, county-level yearly average PM2.5 density data for the period 2010 to 2017 was collected concurrently with potentially confusing variables (including population data, financial conditions, and smoking trends) in a Taiwan-wide (China) study. Accordingly, using linear regression models, evidence was found that for every 10 micrograms per cubic meter of PM2.5 increment, the average LE of adults was diminished by 0.3 years.8 Using a generalized additive model and meta-analysis, the daily PM2.5 values achieved in 72 cities in China between 2013 and 2016 indicate that significantly longer LE can be achieved by reducing the atmospheric PM2.5 concentration.9 It is astonishing that even if particulate matter values (PM2.5) are taken as per WHO guidelines, the average LE loss of all people in the world is reduced by about 2.3 years when the average person is exposed to particulate matter concentrations of 33 µg/m³. And if the value of particulate matter is considered by different countries according to their own national standards, then, at that point, the average LE loss of some countries like Bangladesh, India, Pakistan, and even Singapore is more than 2.8 years in 2018.4
It is also possible to determine the AQLI from the annual fine particle or PM2.5 concentration. The historical studies by Aaron van Donkelaar et al. (2016) were used to measure prehistoric, long-term man-made atmospheric fine particle concentrations worldwide using aerosol optical depth (AOD) derived from satellite products3, which is extremely helpful for determining AQLI. Various studies have also observed a positive trend in atmospheric fine particle concentration (PM2.5) worldwide (especially in India), indicating an increase in the detrimental impacts on the cardiopulmonary system of the human body in the future, which increases the risk of lung cancer and mortality.10 Such as, the long-term trends in PM2.5 density have been observed from 1998 to 2018 using satellite product AOD, simulation, and surface-based monitors, where the worldwide PM2.5 density is 0.04 (±0.02) µg/m³/yr, and India has a positive trend of 1.13 (±0.15) µg/m³/yr has been registered. Again, between 2005 and 2013, a significant positive trend was observed in India, which was around 2.44 (±0.44) µg/m³/yr.11 Furthermore, measuring the world's population-weighted PM2.5 density using satellite-derived data (AOD) using a combined geophysical-statistical method at a resolution of 0.1° × 0.1° from 2004 to 2008 shows that particulate organic mass, secondary inorganic aerosol, and mineral dust are 11.9 (± 7.3) μg/m3, 11.1 (± 5.0) μg/m3, and 11.1 (± 7.9) μg/m3 respectively.12 The current research shows how particulate matter (PM) pollution shortens human LE. The appropriate response is that the destructive impact of atmospheric particulate matter adversely affects the entire human body system. Various experimental studies have clearly shown that fine particles can easily reach the lungs through the nasal section, even the circulatory system,13 and harm the lung walls, including the lung tissue. The known methods of destroying lung tissue are to reduce cell antioxidant levels by increasing reactive oxygen species (ROS) production, increase the production of inflammatory chemicals, and inhibit the calcium balance in the cell.5 Subsequently, chronic inflammatory lung disease, ischemic cardiac disease, cancer in the pulmonary system, stroke, and pneumonia are more likely to develop, which further increases the morbidity and mortality rate.14 Like molecular vector, particulate matter (PM) even enters the central nervous system (brain) through the first cranial nerve (olfactory nerve) which later passes and obliterates gradually the blood-brain barrier (BBB). It can also cause inflammation, DNA damage symptoms, and Alzheimer's disease,15 even in children’s brains.16 The constant release of particulate matter from industries, coal combustion, vehicles, and so on makes these complex diseases more uncomfortable, which results in a reduced average LE of human beings.17
Using the most acceptable and modified formulations of the Energy Policy Institute University of Chicago (EPIC) developed by Michael Greenstone and Claire Qing Fan (2018),4 the average human LE loss for atmospheric particulate matter pollution in 2019 and 2020 is determined separately in the respective cities, where the required PM2.5 concentration is measured by Plantower Particulate Matter Sensor (PMS3003) and BreezoMeter (BM) air quality app ground-based monitors.
Study Area, Materials, and Methods
Study Area
Notable town Medinipur is the base camp of the Paschim Medinipur district of West Bengal, situated 23 meters above sea level, with warm heat and humidity, covering an area of 18.36 square kilometers. According to 2011 statistics, the population of Medinipur Municipality, which consists of 25 wards, is 169,127 people. 10% of the population is under six years of age. As per the report of Medinipur Municipality, Aadhaar estimates that by mid-2020, the total population of Medinipur is about 107661 males and 104065 females, where the population density is 11531.9 (per sq km). Extensive transportation and quick urbanization are significant sources of air pollutants (especially PM10 and PM2.5) in integrated Medinipur city; where vehicle emissions, household incineration, and street dust are the primary sources of pollution.
Materials, and Methods
To measure the concentration of PM2.5 (μg/m3), four significant densely populated areas (S1 to S4) with heavy traffic were selected in Medinipur city (residential urban area) as shown in table 1 with specific coordinates and used sensor or app. The current concentration of PM2.5 from 7 March 2019 to 31 December 2020 was estimated by using the Plantower Particulate Matter Sensor and the BreezoMeter (BM) Air Quality app that provides ground-based PM2.5 data. As there is no conclusive PM2.5 data for 2019, the leftover days of PM2.5 data have been retrieved from the Pollution Control Board (WBPCB). For 2019, the deficit has been filled by adding 65 days of retrieved PM2.5 data to all stations to accurately determine the annual PM2.5 value in the respective city. From these four geological areas displayed in Figure 1, the concentration of PM2.5, excluding S1 (estimating the daily average), was estimated to have different movements every morning, afternoon, evening, and late evening over a 1-hour integration period. Thus, the value of PM2.5 is obtained by determining the average PM2.5 per day for four periods from S2 to S4. In the case of missing date data, the values of the previous and next date have been replaced by an average.
The BM air quality app has been used to measure the PM2.5 concentration at Medinipur station 1 (S1). The hyperlocal, real-time, highly accurate BM app provides data from the nearest available monitoring station.18 The BreezoMeter (BM) Ltd. company has made an application that shows a worldwide guide of air pollution. As well as showing air quality indicators, the application additionally incorporates the quality of every impurity, a conjecture and history of air quality indicators, allergen concentration, and proposals for individuals with pulmonary disorders, children, and sports.
 |
Figure 1: Geographic Location of Air Monitoring Station of Medinipur. Click here to view Figure |
The application can be introduced on an Android phone, where it screens the client's developments by means of GPS and cautions them, assuming that they are in a low air quality region. The principal contrast between the current technique for estimation and the BreezoMeter idea is that the current strategy utilizes the public pollution checking organization, which shows information only about nearby static estimation communities. Furthermore, BreezoMeter gathers worldwide information from an assortment of sources, like climate information, traffic streams, GPS, and information assortments from estimation focuses. This ostensibly massive amount of data is gathered and verified on the server before being used to display a total air quality indicator. The diffused interpolation algorithms utilized for displaying depend on machine learning or AI methods. The organization (BreezoMeter) offers the application's interconnection with smart cities, smart homes, automotive circles, and more. Since the precision of the algorithm is routinely checked by different statistical techniques and since the algorithm consolidates AI and can adjust dependent on previous experience, the application works in real-time regardless of whether the source information isn't accessible in real-time. BreezoMeter's algorithm is currently fit for examining pollution dissipating in real-time, implying that air pollution shifts several times each day dependent on the dynamics, relevance, and area of the individual utilizing the application and is constrained by complex flow dynamics.19,20,21
The Plantower Particulate Matter Sensor (Model No- PMS3003) instrument has been used to determine the PM2.5 concentration of the remaining three stations (S2, S3, and S4) in the city of Medinipur. The PMS3003 Sensor (size: 50mm long × 43mm wide × 21mm high; weight: ≈ 40g; validity from manufacturer's report: ± 10% in the 100 to 500 μg/m3 range). The digital, real-time, low-cost PMS3003 laser light dispersion PM2.5 sensor, which measures PM2.5 concentration at regular intervals throughout the year, is used multiple times per day (morning, afternoon, evening, and late evening) as an everyday average during the 1-hour integration time.22 An exceptional element of the Plantower sensor (PMS) is that atmospheric particle size (in the range of 0.3 to 10 microns) can be measured at specific integration times in the air around coastal and urban areas using laser light scattering principles.
Table 1: Location, Coordinates, Used Air Quality Sensor/Detector of Air Monitoring Station in Medinipur City.
|
Air Monitoring Station No. |
Air Monitoring Station Locations (Zone) |
Coordinates |
Used Air Quality Sensor/Detector |
|
S1 |
Rabindra Nagar, Medinipur, West Bengal 721101, India (central) |
N 22°25'28.4196" E 87°19'09.894" |
BreezoMeter (BM) Air Quality app |
|
S2 |
Abasgarh, Medinipur, West Bengal 721102, India (North- Eastern) |
N 22°26'25.296" E 87°19'37.65" |
Plantower particulate matter sensor (PMS3003) |
|
S3 |
Tantigeria, Medinipur, West Bengal 721102, India (North-western) |
N 22°25'59.8332" E 87°18'27.324" |
Plantower particulate matter sensor (PMS3003) |
|
S4 |
Mahatabpur, Medinipur, West Bengal 721101, India (Southern) |
N 22°24'22.896" E 87°19'00.444" |
Plantower particulate matter sensor (PMS3003) |
The suboptimal reference analyzer is used to choose the fitting meantime, regularly generating a surging sound mark over a long time (for example, 24 hours) and therefore displaying similar errors.23,24 The inclusion of commercially accessible Plantower PM sensors has been chosen because of the promising results, rationality of use, general functionality, and minimal cost of lab approval studies.25,26,27
The reduction in human LE due to particulate matter pollution is based on a pair of semi-experimental variation studies, especially in the Chinese setting, derived from the impact of coarse particles on the northern and southern border populace of the China Huai River. The results showed that ‘an additional 10 micrograms per cubic meter of PM10 exposure reduces LE by 0.64 yrs’ with a 95% confidence interval (95% CI) value of 0.21 years to 1.07 years.1 The methodology used in this study is based on the University of Chicago Energy Policy Institute's (EPIC) epidemiological estimates and provides the most acceptable and modified equation for determining global AQLI using a standard 0.65 PM2.5 to PM10 baseline ratio,28 which is based on 589 pairs of data across more than fifty cities and regions.
The result is finally converted to:
[(0.64 years ÷ 10 μg/m3 of PM10) × (1μg/m3 of PM10 ÷ 0.65 μg/m3 PM2.5)] = 0.98 years per 10 μg/m3 PM2.5
Due to global PM10 data unavailability, EPIC recommends that "additional sustainable exposure to fine particles or PM2.5 reduces LE by 0.98 years per 10 micrograms per cubic meter," which was followed by a pair of experimental results by Chen et al. (2013) and Ebenstein et al. (2017) on the impacts of long-term PM pollution on permanent residents of both the north and south sides of the China Huai River. It also evaluates the current advanced polluted area setting by incorporating the key link between long-term PM exposure and human LE.1,2,29 Historical research shows that previous man-made long-term global PM2.5 values were estimated using an integrated geophysical-statistical method including AOD data from satellite products (such as MODIS and MISR), models (GEOS-Chem Chemical transport), and ground-based monitors that provide PM2.5 data worldwide, which is highly effective in determining AQLI.3 Since only atmospheric fine particle (PM2.5) data is used for air pollution worldwide, its standard values are used. Thus, the current ground-based annual concentration of PM2.5 has been used to determine AQLI in this study.
Results
Details of required PM2.5 values obtained by BreezoMeter and PMS3003 readings at four stations for AQLI determination in Medinipur city in 2019 and 2020 are given in table 2. The monthly change in the concentration of PM2.5 from 2019 to 2020 at different air observation centers in Medinipur city is shown in figure 2. The 24-hour average PM2.5 values obtained by BreezoMeter from the Medinipur S1 station had almost the same minimum and maximum values in both years. In S1, the lowest and highest values were 7.5 μg/m3 and 172 μg/m3, respectively. The annual average values of PM2.5 at S1 stations in 2019 and 2020 were 26.98 (±5.73) μg/m3 and 26.20 (±4.04) μg/m3, respectively.
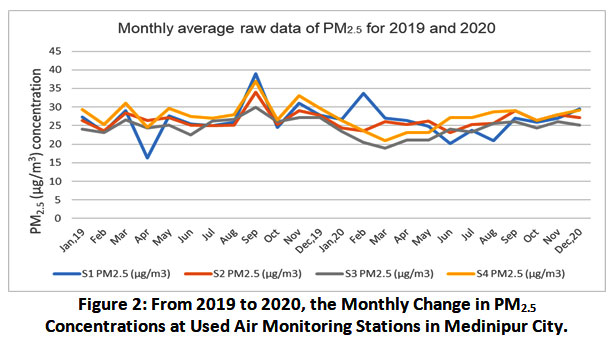 |
Figure 2: From 2019 to 2020, the Monthly Change in PM2.5 Concentrations at Used Air Monitoring Stations in Medinipur City. Click here to view Figure |
The lowest, highest, and annual mean ranges of PM2.5 concentration as an average of four times daily obtained from the Plantower Particulate Matter Sensor (PMS3003) device in 2019 and 2020 for stations other than S1 were 2.22 to 4.23 μg/m3, 145 to 181 μg/m3, and 23.2 (±2.86) to 29 (±3.83) μg/m3, respectively, as shown in table 2.
Table 2: Number of Observed Data, Minimum, Maximum, and Annual Mean Value of PM2.5 (μg/m3) in Different Air Monitoring Stations of Medinipur City for the Years 2019 and 2020.
|
Station Name |
Year |
Min. |
Max. |
Annual Mean ± SD |
|
S1 |
2019 |
7.5 |
172 |
26.98 ± 5.73 |
|
2020 |
7.5 |
172 |
26.20 ± 4.04 |
|
|
S2 |
2019 |
2.22 |
180.33 |
26.93 ± 2.93 |
|
2020 |
4.23 |
173.34 |
25.90 ± 2.69 |
|
|
S3 |
2019 |
3.34 |
170.36 |
25.79 ± 2.44 |
|
2020 |
2.80 |
145 |
23.20 ± 2.86 |
|
|
S4 |
2019 |
2.56 |
181 |
29.00 ± 3.83 |
|
2020 |
3.14 |
167.12 |
26.63 ± 2.83 |
Comparing the mean value of PM2.5 for each station obtained from PMS3003, the lowest average value of PM2.5 at the S3 station in 2020 and the highest mean value of PM2.5 at the S4 station in 2019 were 23.20 (±2.86) μg/m3 and 29 (±3.83) μg/m3, respectively. Table 3 shows the AQLI results that meet the WHO guidelines for 2019 and 2020, obtained by determining the yearly mean concentration of PM2.5. Since the current yearly mean concentration of PM2.5 in Medinipur city is well below the national standard in India (40 μg/m3)30 for each station; the average LE loss per person cannot be measured according to the national standard. But according to WHO guidelines (the yearly mean concentration of PM2.5 is 10 μg/m3, 31), the yearly mean concentration of PM2.5 in those years is much higher in Medinipur city.
Table 3: Air Quality Life Index: Best Estimate and 95% CI of Average Life Years Lost in 2019 and 2020 by Fulfilling WHO Guidelines at S1 to S4 Monitoring Station of Medinipur City.
|
Station Name |
Year |
Cuts average LE/Person; if Medinipur City met the WHO Guidelines*. |
|
|
Best Estimate (Years) |
95% CI: (0.32-1.64) |
||
|
S1 |
2019 |
1.67 |
0.54 – 2.78 |
|
2020 |
1.59 |
0.51 – 2.65 |
|
|
S2 |
2019 |
1.66 |
0.54 – 2.77 |
|
2020 |
1.56 |
0.5 – 2.6 |
|
|
S3 |
2019 |
1.55 |
0.5 – 2.58 |
|
2020 |
1.3 |
0.4 – 2.16 |
|
|
S4 |
2019 |
1.87 |
0.6 – 3.11 |
|
2020 |
1.63 |
0.53 – 2.72 |
|
*The Annual Average Concentration of PM2.5 is 10 μg/m3
Based on the ground-based current annual PM2.5 values of each station, the average LE loss per person at the S1 station was 1.67 years (95% CI: 0.54-2.78 years) and 1.59 years (95% CI: 0.51-2.65 years) in 2019 and 2020, respectively. The same goes for the rest of the stations, where the average LE loss per person was 1.66 years (95% CI: 0.54–2.77 years) and 1.56 years (95% CI: 0.5–2.6 years); 1.55 years (95% CI: 0.5–2.58 years) and 1.3 years (95% CI: 0.4–2.16 years); 1.87 years (95% CI: 0.6–3.11 years) and 1.63 years (95% CI: 0.53–2.72 years) in 2019 and 2020 for S2, S3 and S4 respectively.
Discussion
The results of this study show that the annual standard of PM2.5 concentration in each monitoring station in Medinipur city in 2019 and 2020 is much higher than the WHO annual standard (10 μg/m3) and the U.S. Environmental Protection Agency (EPA) annual standard (12 μg/m3) announced in 2012 but much lower than the Indian NAAQS annual standard (40 μg/m3). Since the average human LE loss is largely proportional to the concentration of PM2.5 levels, a slight change in the value of annual PM2.5 affects AQLI. In this contextual study, it is not known whether there is any statistically significant difference in the concentration of fine particles (PM2.5) obtained from the four monitoring stations in the city of Medinipur as a slight change in the yearly mean concentration of PM2.5 for AQLI measurement. The results of Table 3 show that the AQLI value of each station in 2019 is slightly higher than that in 2020, which indicates that the people of Medinipur city have a higher risk of cardiopulmonary illness and pulmonary cancer associated with PM2.5 in 2019.
Conclusion
From this contextual study, it can be concluded that the annual concentration of PM2.5 obtained from BreezoMeter and PMS3003 at four selected stations (S1 to S4) in Medinipur city ranged from 26.93 to 29.00 µg/m³ in 2019 and 23.20 to 26.63 µg/m³ in 2020. The average LE loss in Medinipur city varied from 1.3 years to 1.87 years per person. However, since the expected LE reduction is directly related to the mortality rate, the AQLI results suggest that the mortality rate in 2019 is higher than in 2020. With every 10 micrograms of long-term PM2.5 exposure, there is a risk of cardiopulmonary mortality and lung cancer mortality increasing by 6% and 8%, respectively,10 so it may be said that cardiopulmonary disease and lung cancer are responsible for the average LE loss of Medinipur residents in 2019 and 2020. Authorities at the metropolitan level in Medinipur need to take preventive steps to decrease the destructive effects of particulate matter by reducing the origin of required PM emissions and providing a healthier climate in the future.
Acknowledgments
I might want to convey my exceptional thanks and appreciation to my guide, Dr. Anita Kumar, Adjunct Faculty/Guide/Supervisor of Shri JJT University, Rajasthan, for her capable direction and backing. I might likewise want to extend my appreciation to the Department of Physiology, Shri JJT University, Rajasthan, for giving me all the facilities that were required. A special thanks also to my colleagues, Mr. Gauranga Khanra and Mr. Uttam Kumar Maity.
Funding Sources
The author has not gotten monetary help for research, authorship, or publication of this article.
Conflict of Interest
The author has no conflict of interest with any monetary, individual, or other relationship with other individuals or organizations that might influence the work.
References
- Ebenstein A, Fan M, Greenstone M, He G, Zhou M. New evidence on the impact of sustained exposure to air pollution on life expectancy from China’s Huai River Policy. Proc Natl Acad Sci U S A. 2017;114(39):10384-10389. doi:10.1073/pnas.1616784114.
CrossRef - Greenstone M, Fan CQ. Introducing the Air Quality Life Index. Energy Policy Inst Univ Chicago. 2018;(November):1-34.
- Van Donkelaar A, Martin R V., Brauer M, et al. Global Estimates of Fine Particulate Matter using a Combined Geophysical-Statistical Method with Information from Satellites, Models, and Monitors. Environ Sci Technol. 2016;50(7):3762-3772. doi:10.1021/acs.est.5b05833.
CrossRef - Michael Greenstone; Qing (Claire) F. Air Quality life Index (AQLI). Annu Update. 2020;(July):1-21.
- Xing YF, Xu YH, Shi MH, Lian YX. The impact of PM2.5 on the human respiratory system. J Thorac Dis. 2016;8(1):E69-E74. doi:10.3978/j.issn.2072-1439.2016.01.19
- Pope CA, Ezzati M, Dockery DW. Fine-Particulate Air Pollution and Life Expectancy in the United States. N Engl J Med. 2009;360(4):376-386. doi:10.1056/nejmsa0805646.
CrossRef - Andrew C, Pope CA, Dockery DW, Wang Y, Ezzati M, Francesca Dominici. The Effect of Air Pollution Control on Life Expectancy in the United States: An Analysis of 545 US counties for the period 2000 to 2007. J Invest Dermatol. 2015;135(2):612-615. doi:10.1097/EDE.0b013e3182770237.
CrossRef - Chen CC, Chen PS, Yang CY. Relationship between fine particulate air pollution exposure and human adult life expectancy in Taiwan. J Toxicol Environ Heal - Part A Curr Issues. 2019;82(14):826-832. doi:10.1080/15287394.2019.1658386.
CrossRef - Qi J, Ruan Z, Qian Z, et al. Potential gains in life expectancy by attaining daily ambient fine particulate matter pollution standards in mainland China: A modeling study based on nationwide data. PLoS Med. 2020;17(1):1-16. doi:10.1371/JOURNAL.PMED.1003027.
CrossRef - Pope III CA, Burnett RT, Thun MJ, Calle EE, Krewski D, Thurston GD. Lung cancer, Cardiopulmonary mortality, and long-term exposure to Fine Particulate Air Pollution. J Am Med Assoc. 2002;287(9):1132-1141. http://jama.jamanetwork.com/article.aspx?doi=10.1001/jama.287.9.1132.
CrossRef - Hammer MS, Van Donkelaar A, Li C, et al. Global Estimates and Long-Term Trends of Fine Particulate Matter Concentrations (1998-2018). Environ Sci Technol. 2020;54(13):7879-7890. doi:10.1021/acs.est.0c01764.
CrossRef - Philip S, Martin R V., Van Donkelaar A, et al. Global chemical composition of ambient fine particulate matter for exposure assessment. Environ Sci Technol. 2014;48(22):13060-13068. doi:10.1021/es502965b.
CrossRef - Ryan J, Owen AJ. The impact of the climate crisis on brain health. Nat Aging. 2021;1(5):416-417. doi:10.1038/s43587-021-00062-2.
CrossRef - Ling SH, van Eeden SF. Particulate matter air pollution exposure: role in the development and exacerbation of chronic obstructive pulmonary disease. Int J Chron Obstruct Pulmon Dis. 2009;4:233-243. doi:10.2147/copd.s5098.
CrossRef - Peeples L. How air pollution threatens brain health. Proc Natl Acad Sci U S A. 2020;117(25):13856-13860. doi:10.1073/pnas.2008940117.
CrossRef - Calderón-Garcidueñas L, Torres-Jardón R, Kulesza RJ, Park S Bin, D’Angiulli A. Air pollution and detrimental effects on children’s brain. The need for a multidisciplinary approach to the issue complexity and challenges. Front Hum Neurosci. 2014;8(AUG):1-7. doi:10.3389/fnhum.2014.00613.
CrossRef - Philip S, Martin R V., Snider G, et al. Anthropogenic fugitive, combustion and industrial dust is a significant, underrepresented fine particulate matter source in global atmospheric models. Environ Res Lett. 2017;12(4). doi:10.1088/1748-9326/aa65a4.
CrossRef - The World’s Most Accurate Air Quality App | BreezoMeter. Accessed September 4, 2021. https://www.breezometer.com/air-quality-app
- Soe R. Smart Governance for Cities: Perspectives and Experiences.; 2020. http://link.springer.com/10.1007/978-3-030-22070-9
- Adamec V, Herman D, Schullerova B, Urbanek M. Modelling of Traffic Load by the DataFromSky System in the Smart City Concept. EAI/Springer Innov Commun Comput. Published online 2020:135-152. doi:10.1007/978-3-030-22070-9_7.
CrossRef - Breezometer. One, Two, Three, Breathe. Sci Publ. Published online 2016.
CrossRef - Alfano B, Barretta L, Del Giudice A, et al. Correction to: A review of low-cost particulate matter sensors from the developers’ perspectives (Sensors 2020, 20, 6819). Sensors. 2021;21(9). doi:10.3390/s21093060.
CrossRef - Zheng T, Bergin MH, Johnson KK, et al. Field evaluation of low-cost particulate matter sensors in high-and low-concentration environments. Atmos Meas Tech. 2018;11(8):4823-4846. doi:10.5194/amt-11-4823-2018.
CrossRef - Bulot FMJ, Johnston SJ, Basford PJ, et al. Long-term field comparison of multiple low-cost particulate matter sensors in an outdoor urban environment. Sci Rep. 2019;9(1):1-13. doi:10.1038/s41598-019-43716-3.
CrossRef - Kelly KE, Whitaker J, Petty A, et al. Ambient and laboratory evaluation of a low-cost particulate matter sensor. Environ Pollut. 2017;221:491-500. doi:10.1016/j.envpol.2016.12.039.
CrossRef - Brzozowski K, Maczy?ski A, Rygua A. Monitoring road traffic participants’ exposure to PM10 using a low-cost system. Sci Total Environ. 2020;728. doi:10.1016/j.scitotenv.2020.138718.
CrossRef - Sensing the Air Quality: Research on Air Quality Sensors. Accessed December 17, 2021. https://aqicn.org/sensor/.
- Zhou X, Cao Z, Ma Y, Wang L, Wu R, Wang W. Concentrations, correlations and chemical species of PM2.5/PM10 based on published data in China: Potential implications for the revised particulate standard. Chemosphere. 2016;144:518-526. doi:10.1016/j.chemosphere.2015.09.003.
CrossRef - Chen Y, Ebenstein A, Greenstone M, Li H. Evidence on the impact of sustained exposure to air pollution on life expectancy from China’s Huai River policy. Proc Natl Acad Sci U S A. 2013;110(32):12936-12941. doi:10.1073/pnas.1300018110.
CrossRef - Chowdhury S, Dey S, Guttikunda S, Pillarisetti A, Smith KR, Girolamo L Di. Indian annual ambient air quality standard is achievable by completely mitigating emissions from household sources. Proc Natl Acad Sci U S A. 2019;166(22):10711-10716. doi:10.1073/pnas.1900888116.
CrossRef - Ambient (outdoor) air pollution. Accessed September 4, 2021. https://www.who.int/news-room/fact-sheets/detail/ambient-(outdoor)-air-quality-and-health.


