Guru Ghasidas University Campus Greenery for off setting Carbon Dioxide and Improving Students’ Academic Performance
K K Chandra1
*
 , V Omesh1
and Rahul Bhadouria2
, V Omesh1
and Rahul Bhadouria2
1
School of Environmental Sciences,
Jawaharlal Nehru University,
New Delhi,
Delhi
India
http://dx.doi.org/10.12944/CWE.17.1.19
The greenery in academic institution reduces CO2 and creates stress free environment to the students' learning. Guru Ghasidas Central University, Bilaspur, India, spread in 262 ha with ample green space, is an education hub for over 9000 students. The land use pattern, greenery, and tree CO2stock were assessed by laying out 54 sample plots (0.1 ha) across the university. Students’ likelihood of greenery and its effects on students' behavior and academic performance were evaluated during 2019-20.. The university has 2/3 green space, 10.64% area under water bodies, and a total built-up area restricted to 15.22%. A total of 61 tree species were identified with a population of 124662 trees on the campus with the highest abundance of Peltophorumferrugineum (17.31%), Eucalyptus globulus (13.69%) among planted tree species. In naturally occurring tree species, Acacia niloticaoccupied highest (88.35%) followed by Buteamonosperma (10.04%). The trees of the university campus stocked 10942.6 tons of CO2. Analysis showed that students rated higher preference to campus greenery with 2.71 points in 0-4 points Likert scale, and improved student’s academic performance.
Copy the following to cite this article:
Chandra K. K, Omesh V, Badouria R. Guru Ghasidas University Campus Greenery for off setting Carbon Dioxide and Improving Students’ Academic Performance. Curr World Environ 2022;17(1). DOI:http://dx.doi.org/10.12944/CWE.17.1.19
Copy the following to cite this URL:
Chandra K. K, Omesh V, Badouria R. Guru Ghasidas University Campus Greenery for off setting Carbon Dioxide and Improving Students’ Academic Performance. Curr World Environ 2022;17(1).
Download article (pdf) Citation Manager Publish History

Introduction
University is a student-centric place where teaching-learning practices take place for producing future generations.1-3 Students spend most of the time in a university environment to attend class, sit in examinations, and do other extracurricular activities. All these tasks demand direct attention and raise mental fatigue and stress in students.4-6The green campus allows a place as a pedagogy and enhances the environmental awareness among students by utilizing green practices on a day-to-day basis.7,8. Students often use the university green space to relax and reduce stress.9,10
Numerous recent reports state that in students of the United Kingdom, psychological symptoms increase by 11% between the first years to the second year5, and cause anxiety and depression in university students.Similarly, 22% of university students in the Netherlands reported psychological issues.11 These issues are common among students worldwide and can hurt their academic performance, physical health, and well-being.12-14 In this condition, greenery relieves stress, improves attentiveness in students, and only a quick view of green trees from classrooms is found helpful in quick restoration of concentration with a decrease in fatigue.7,15,16,17Large green outdoor spaces boost physical activity in students and keep them active throughout the years18. Several studies have confirmed the importance of green campuses for stress reduction in university students19-21, maintaininghappiness21,22,23, and improvingacademic performances.8,17,24Furthermore, green space in university campuses positively correlates with students, perceived quality of life25; they feel relaxed and have more favorable attitudes with greenery than a campus without greenery.26 As a result, it is believed that a green environment in a university would aid in the quick recovery of students' stress and academic pressure.27 It seems that most universities do not yet adopt the concept of a green campus, and students are studying stressfully.12,28,29 Thus, every effort to green university environment may benefit student development.3,30,31However, such studies highlighting role of green space in educational institutions are sparse in the country.
Universities are mainly located near the city where air pollutants come from industry and traffic. Cities are the centers of economic development and growth. Although urban regions now account for about half of India's GDP, growing urbanization is a primary driver of global change, including land-use changes, habitat loss, biodiversity reduction, climate change, and pollution both within and beyond the city. Moreover, the air quality inside the classroom may be poor when students share a small space, which causes an increase in CO2 levels. The green cover can help improve the air quality of the university environment, benefiting overall health in the long term.32Green plants fix atmospheric CO2 and maintain ambient levels.33,34Van Duijn et al.35 showed that the plants inside the classrooms may reduce the CO2 by 10-20%. Plants are also able to cut airborne volatile organic compounds by 50%.36 Worldwide, millions of educational institutes and universities are engaged in sustainable education to cater to manpower. They have to utilize their vast area lands for dual objectives first to attract diverse minds and a better environment of teaching-learning practices and second to absorb CO2 from the atmosphere and climate change.
In India, 760 universities, 38,498 colleges, 20 Indian Institute of Management, 23 Indian Institute of Technology, 23 National Law Universities, and 31 National Institute of Technologies serve the nation and occupy a vast land area37 for a future world. In addition, several research institutes such as the Indian Agriculture Research Institute, Tata Institute of Fundamental Research, Indian Space Research Organization, Bhabha Atomic Research Centre, etc., also contribute to the country's holistic development. All these institutions have a vast area of land that offers plantations and greenery to better the researcher, students and to protect the fragile environment from climate change. If these lands are promoted to a green education approach, it will undoubtedly enhance the confidence level in educational systems in many countries and improve its overall capability.38Therefore, the main objective of the present study is to assess greenery in university, tree abundance, and CO2 stocks, and students’ likelihood of restoration of perceived knowledge, academic performance, and students’ connectedness to nature.
Material and Methods
Location of Study Area
The study was conducted at Guru Ghasidas Central University (GGU), Bilaspur (22.1293?N, 82.1360?E), spreads over an area of 262 ha area, in Chhattisgarh State of Central India (Fig. 1). The area's climate is tropical, with an extended dry season during the winter. The city's minimum temperature reaches 10?C during January, and the maximum temperature touch 46?C during the middle of May. Mean annual rainfall in the city for 2019-20 was recorded 1280 mm year-1 with the onset of South-West and South-East monsoon.
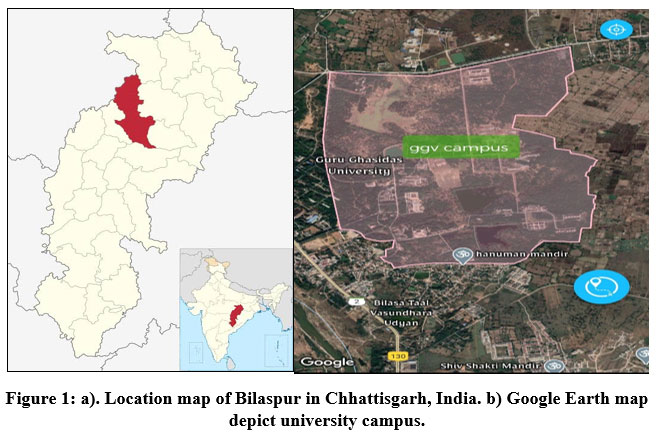 |
Figure 1: a). Location map of Bilaspur in Chhattisgarh, India. b) Google Earth map depict university campus. |
Greenery in the university environment was analyzed, and land use pattern was determined using Google earth map. Fifty-four sample plots of 50 ×50 m (0.25 ha) were laid out randomly in different locations across the University on a map, transact for a field visit, and enumerated tree population and measurement. The geographical coordinates for each plot were identified with the help of a Global positioning system (GPS). Trees encountered in the sample plot were measured DBH, tree height. The tree's relative abundance (RA) was calculated by counting trees above 20 cm diameter at breast height occurring in sample plots, divided by the total number of trees in all sample plots, and multiplied by 100. The tree's height was determined using Abney’s level and DBH by measuring tape. Data on individual trees were used to estimate the volume of the trees using equation V = π r2 x h. Above-ground biomass (AGB) was computed by formula AGB (t) = V (m3) × SG (kg m3). The specific gravity (SG) value of individual tree species was obtained from FSI39. The below-ground biomass (BGB) was estimated by multiplying the AGB by 26%.40 Total biomass was calculated by adding ABG and BGB, and carbon stocks were estimated by multiplying the total dry biomass with the default carbon fraction (0.475). The estimated carbon stock was converted into CO2 stock by multiplying the carbon stock by 3.666.41,42
Student Participants for data collection and Analysis Students likelihood
In this study, the role of the green university for offsetting CO2 and students’ likelihood and connectedness to greenery for restoring perceived knowledge, academic performance was analyzed following methods Bogerdet al.43 Data were collected through questionnaires served through online internet mode to students during February- March 2019. A total of 480 students who completed the questionnaire were included in the analysis. For the investigation, six departments, namely Forestry, Wildlife & Environmental Sciences, Life Sciences, Mathematical Sciences, Pharmacy, Institute of Technology, and Social Sciences, were chosen randomly, and 80 students from each department were voluntarily selected. The sample comprised 56.25% female (N=270) and 46.56% male (N=210) between the age group from 20 to 22 years. The questionnaire contained 15 questions related to greenery and student’s preference, knowledge restoration likelihood, etc., as simple as anyone can understand, took approximately 10 minutes to complete.
Students’ preference was assessed following suggested methods43,44,45consist aesthetic values and behavioral characteristics. Students rated the items on a five-point Likert scale such as 0 (strongly disagree-SD), 1 (disagree-D), 2 (somehow agree-SHA), 3 (agree -A), and 4 (strongly agree-SA). The score points rated by students were averaged, and scores reflecting higher in 0 to 4 point scale indicate a stronger likelihood preference. All the questions asked were related to the outdoor greenery of the university (plantations, naturally growing species, departmental gardens, water bodies, etc.). The item assessed likelihood preference, restoration of perceived knowledge, academic performance, attentive concentration, reduction in mental stress and fatigue, etc., were given in questionnaire.44,46, and also tried to include a question to determine students’ connectedness to nature, level of awareness on environmental protection, etc.
Statistical Analysis
To validate the study data, statistically SPSS 16.0 version were employed. Data were analyzed for clustering of students’ observations with different departments of the university47.Effect sizes are expressed as mean score values with 95% confidence intervals (95% CI). Similarly, students, connectedness with nature, awareness, and interest in plant care and protection are also assessed at CI 95% among university students representing different departments.
Results
Greenery in University Environment and CO2 stocks
The results show that the university has utilized land appropriately, focusing long term greenery and conservation of nature. Green space estimated in 2/3 area consists 66.07% of the total geographical area of the university, and 10.64% area is utilized as artificial ponds for water conservation (Fig. 2). The total built-up area, including buildings, roads, sports complex, covered 15.22%. A total of 61 tree species were identified across the university, where Acacia nilotica and Buteamonosperma were the most abundant naturally occurring tree species with the highest abundance of 88.55% and 10.04%, respectively, out of total natural trees populations (109801 trees) (Fig.3a). Among plantations, Peltophorumferrugineum was the most abundant (17.31%), followed by Eucalyptus globulus(13.69%), Tectonagrandis (9.42%), Cassia siamia (6.78%), Dalbergiasissoo (5.04%) with the populations of 14861 trees under plantation category (Fig. 3b). These plantations were aged 40-50 years, while naturally occurring tree species aged 4 to 60 years. The tree volume determined the highest 5237.75 m3 for A. nilotica under naturally occurring trees with 97176 population while P. ferrugineum scored second-most volume holding trees (666.10 m3) with 2573 population (Table 1). These tree species also stocked higher CO2 than the other species, as 70.36% CO2 stock was found in A. nilotica and 8.21% CO2 in P. ferrugineum in the entire greenery of the university. There was a significant difference in the CO2 stocks of tree species at p <0.05. The naturally occurring trees, mainly A. nilotica was well adopted in the area, germinate profusely, form greenery rapidly, and render all the benefits of trees without extra cost and care. However, the presence of thorns is the only negative point restricting the trees near departments where students visit and sit regularly. The total number of trees, estimated at 7786.72 m3 in the university, formed a luxurious green campus with 6383.97 tons of biomass and 10942 tons of CO2 stocks (Fig. 4). Greenery coupled with water bodies was found to reduce the temperature by 1-2° C of the university compared to adjacent cities and favor the habitat of a diverse group of flora, migratory birds, and other wildlife communities on the campus.
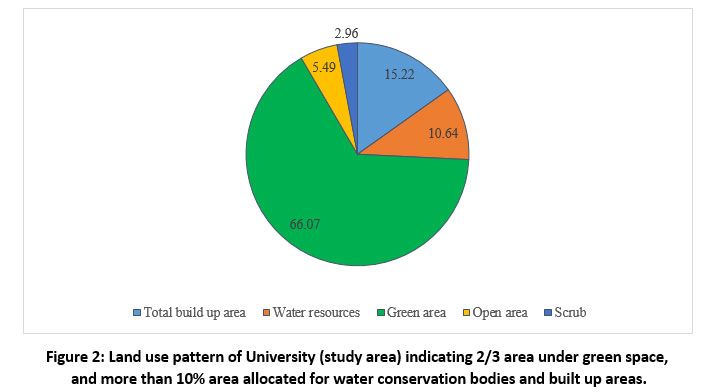 |
Figure 2: Land use pattern of University (study area) indicating 2/3 area under green space, and more than 10% area allocated for water conservation bodies and built up areas. |
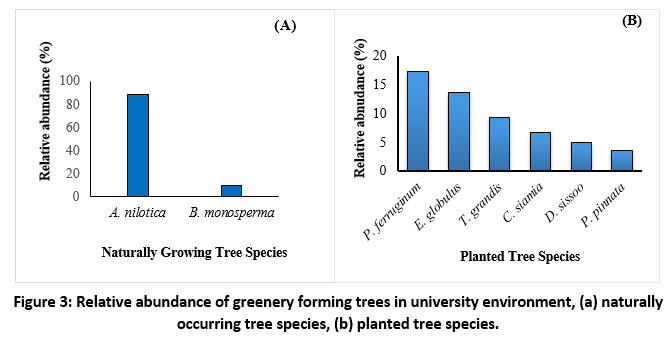 |
Figure 3: Relative abundance of greenery forming trees in university environment, (a) naturally occurring tree species, (b) planted tree species. |
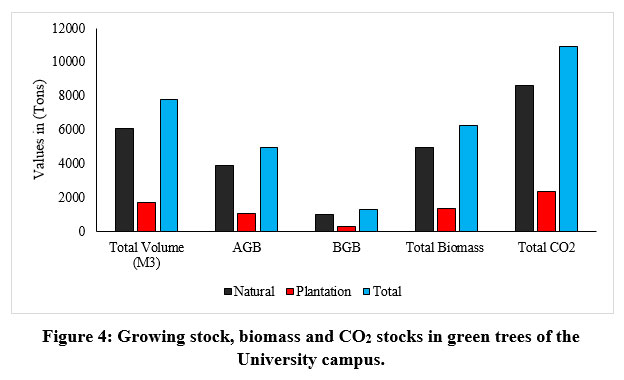 |
Figure 4: Growing stock, biomass and CO2 stocks in green trees of the |
Table 1: Tree populations in GGV campus, its volume and CO2 stocks.
|
S. No. |
Scientific name |
No of Trees |
Volume (m3) |
AGB (T) |
BGB (T) |
Total Biomass (T) |
Total CO2 (T) |
|
1 |
Acacia auriculiformis |
340 |
9.78 |
6.55 |
1.70 |
8.25 |
14.37 |
|
2 |
Acacia catechu |
5 |
0.16 |
0.11 |
0.03 |
0.14 |
0.24 |
|
3 |
Acacia leucopholea |
40 |
1.08 |
0.73 |
0.19 |
0.92 |
1.59 |
|
4 |
Acacia nilotica |
97176 |
5237.75 |
3509.29 |
912.42 |
4421.71 |
7699.74 |
|
5 |
Aeglemarmelos |
15 |
0.87 |
0.77 |
0.20 |
0.97 |
1.69 |
|
6 |
Ailanthus excelsa |
70 |
5.76 |
2.05 |
0.53 |
2.58 |
4.50 |
|
7 |
Albizialebbeck |
335 |
49.64 |
26.51 |
6.89 |
33.40 |
58.16 |
|
8 |
Albiziaprocera |
250 |
15.07 |
9.64 |
2.51 |
12.15 |
21.16 |
|
9 |
Alstoniascholaris |
250 |
43.86 |
15.83 |
4.12 |
19.95 |
34.74 |
|
10 |
Anacardiumoccidentale |
70 |
4.08 |
1.91 |
0.50 |
2.41 |
4.19 |
|
11 |
Annonasquamosa |
80 |
4.66 |
2.56 |
0.67 |
3.23 |
5.62 |
|
12 |
Neolamarckiacadamba |
50 |
2.83 |
1.74 |
0.45 |
2.20 |
3.82 |
|
13 |
Artocarpusheterophyllus |
20 |
1.21 |
0.66 |
0.17 |
0.84 |
1.46 |
|
14 |
Azadirachtaindica |
530 |
96.29 |
66.73 |
17.35 |
84.08 |
146.41 |
|
15 |
Bauhinia variegata |
30 |
1.75 |
1.22 |
0.32 |
1.54 |
2.69 |
|
16 |
Bombaxceiba |
120 |
7.77 |
4.78 |
1.24 |
6.02 |
10.48 |
|
17 |
Buteamonosperma |
11034 |
654.01 |
304.11 |
79.07 |
383.18 |
667.26 |
|
18 |
Cassia fistula |
45 |
3.01 |
2.25 |
0.58 |
2.83 |
4.93 |
|
19 |
Cassia siamea |
1009 |
102.06 |
62.77 |
16.32 |
79.09 |
137.72 |
|
20 |
Casuarinaequisetifolia |
15 |
0.88 |
0.54 |
0.14 |
0.68 |
1.19 |
|
21 |
Ceibapentandra |
60 |
5.80 |
1.62 |
0.42 |
2.05 |
3.56 |
|
22 |
Citrus limon |
30 |
1.68 |
1.31 |
0.34 |
1.65 |
2.87 |
|
23 |
Cleistanthuscollinus |
310 |
5.65 |
3.96 |
1.03 |
4.99 |
8.68 |
|
24 |
Dalbergiasissoo |
750 |
128.62 |
83.34 |
21.67 |
105.01 |
182.87 |
|
5 |
Delonixregia |
300 |
63.45 |
39.02 |
10.15 |
49.17 |
85.62 |
|
26 |
Diospyrosmelanoxylon |
12 |
0.71 |
0.48 |
0.13 |
0.61 |
1.06 |
|
27 |
Eucalyptus globulus |
2035 |
99.47 |
67.24 |
17.48 |
84.73 |
147.54 |
|
28 |
Ficusbenghalensis |
15 |
4.93 |
3.03 |
0.79 |
3.82 |
6.66 |
|
29 |
Ficusglomerata |
15 |
3.45 |
2.12 |
0.55 |
2.67 |
4.65 |
|
30 |
Ficusracemosa |
20 |
8.95 |
5.50 |
1.43 |
6.93 |
12.08 |
|
31 |
Ficusreligiosa |
12 |
3.68 |
2.26 |
0.59 |
2.85 |
4.97 |
|
32 |
Gmelinaarborea |
76 |
2.01 |
1.12 |
0.29 |
1.42 |
2.46 |
|
33 |
Halesiadiptera |
5 |
0.29 |
0.12 |
0.03 |
0.15 |
0.27 |
|
34 |
Lagerstroemia parviflora |
45 |
2.94 |
1.88 |
0.49 |
2.37 |
4.13 |
|
35 |
Leucaenaleucocephala |
415 |
24.77 |
14.89 |
3.87 |
18.76 |
32.66 |
|
36 |
Madhucalatifolia |
5 |
0.32 |
0.24 |
0.06 |
0.30 |
0.52 |
|
37 |
Mangiferaindica |
320 |
68.75 |
39.94 |
10.39 |
50.33 |
87.64 |
|
38 |
Meliaazadirach |
55 |
3.20 |
1.79 |
0.47 |
2.26 |
3.94 |
|
39 |
Mimusopselengi |
70 |
4.08 |
3.26 |
0.85 |
4.11 |
7.16 |
|
40 |
Morus alba |
5 |
0.29 |
0.18 |
0.05 |
0.22 |
0.39 |
|
41 |
Murrayakoenigii |
40 |
2.33 |
1.58 |
0.41 |
2.00 |
3.48 |
|
42 |
Peltophorumferrugineum |
2573 |
666.10 |
409.65 |
106.51 |
516.16 |
898.82 |
|
43 |
Phyllanthusemblica |
68 |
3.98 |
3.19 |
0.83 |
4.02 |
6.99 |
|
44 |
Pithecellobiumdulce |
55 |
8.90 |
5.47 |
1.42 |
6.89 |
12.00 |
|
45 |
Plumeriarubra |
35 |
2.08 |
1.04 |
0.27 |
1.31 |
2.28 |
|
46 |
Polyalthialongifolia |
43 |
3.08 |
1.90 |
0.49 |
2.39 |
4.16 |
|
47 |
Pongamiapinnata |
537 |
34.52 |
21.23 |
5.52 |
26.75 |
46.59 |
|
48 |
Populusdeltoides |
10 |
0.58 |
0.23 |
0.06 |
0.29 |
0.51 |
|
49 |
Psidiumguajava |
90 |
5.25 |
3.23 |
0.84 |
4.07 |
7.09 |
|
50 |
Putranjivaroxburghii |
650 |
39.87 |
24.52 |
6.37 |
30.89 |
53.79 |
|
51 |
Roystonearegia |
40 |
2.56 |
1.57 |
0.41 |
1.98 |
3.45 |
|
52 |
Samaneasaman |
10 |
0.67 |
0.41 |
0.11 |
0.52 |
0.90 |
|
53 |
Santalum album |
2 |
0.12 |
0.08 |
0.02 |
0.10 |
0.18 |
|
54 |
Saracaasoca |
120 |
7.08 |
3.51 |
0.91 |
4.42 |
7.70 |
|
55 |
Streblusasper |
2 |
0.17 |
0.12 |
0.03 |
0.15 |
0.27 |
|
56 |
Syzygiumcumini |
410 |
98.95 |
64.02 |
16.65 |
80.67 |
140.47 |
|
57 |
Tamarindusindica |
15 |
0.63 |
0.47 |
0.12 |
0.59 |
1.03 |
|
58 |
Tectonagrandis |
1401 |
82.50 |
52.56 |
13.66 |
66.22 |
115.31 |
|
59 |
Terminaliaarjuna |
330 |
79.18 |
49.25 |
12.80 |
62.05 |
108.06 |
|
60 |
Terminaliacatappa |
10 |
3.46 |
2.13 |
0.55 |
2.68 |
4.67 |
|
61 |
Ziziphusmauritiana |
1182 |
69.16 |
47.03 |
12.23 |
59.25 |
103.18 |
Students’ likelihood togreenery and its impact on academic performance
The results of the preference likelihood and restoration of perceived knowledge of university students to greenery are given in Table 2. The extensive greenery of the university received the higher preference ratings of 2.71 (95% CI 1.46–3.05) points and perceived knowledge restoration with 2.19 points (Table 2). Students rated the highest score of 3.12 (95% CI 2.53-3.67) points to the greenery needs for concentration and 2.10 points for enhancing their academic performance. Students are convinced and satisfied significantly with the green space for reducing mental stress and fatigue, particularly during examinations and intensive classroom teaching when sitting with plantations adjacent to their departments (Mean score 2.33 points, CI 1.66-2.82). Greenery was also found beneficial in creating an attractive and congenial learning environment than the campus without green space. Overall, 30.89% of respondents agreed with greenery, and 31.97% of students rated the somehow agreed scale. The percent of strongly agreed students was 19.22%, while strongly disagreed students to the greenery in university environment were 7.11%. These demonstrate that the majority of the students require green space for restorative likelihood, maintaining concentration during intensive studies, and reducing mental stress.
Table 2: Analysis of student’s likelihood on preference and perceived restoration knowledge and academic performances to green space of a university. (Students rated on scale from 0-strongly disagree to 4-strongly agree). (N=480).
|
S. No. |
Particulars |
Students Likelihood Responses (%) |
Mean Score value (SD) |
Cluster Interval (CI) 95% |
||||
|
SD |
D |
SHA |
A |
SA |
||||
|
1 |
Students, Preference (Attractiveness of green campus) |
3.57 |
10.20 |
17.91 |
48.33 |
20.00 |
2.71 (0.62) |
1.46- 3.05* |
|
2 |
Improve perceived knowledge restoration |
8.33 |
14.58 |
36.66 |
30.00 |
10.41 |
2.19 (0.73) |
1.78-2.66* |
|
3 |
Reduce fatigue and mental stress |
5.62 |
10.20 |
44.16 |
24.58 |
15.41 |
2.33 (0.55) |
1.60- 2.82* |
|
4 |
Enhance academic performance |
14.16 |
10.62 |
36.04 |
29.16 |
10.00 |
2.10 (0.77) |
1.75-2.71* |
|
5 |
Feel attentive/ concentrate viewing greenery |
6.45 |
3.33 |
12.5 |
30.20 |
47.50 |
3.12 (0.82) |
2.53-3.67** |
|
6 |
Create attractive learning environment |
4.58 |
16.25 |
44.58 |
23.12 |
11.45 |
2.20 (0.48) |
1.48-2.88* |
|
|
Overall |
7.11 |
10.86 |
31.97 |
30.89 |
19.12 |
|
|
Note: SD (strongly disagree), D (disagree), SHA (somehow agree), A (agree), SA (strongly agree)
* significant at <0.05, ** significant at <0.01
Table 3 present the students, connectedness to nature, awareness of environmental benefits, and nature care habits. Students rated the highest of 2.89 points (CI 1.72-3.51) to green covers helps maintenance of ecosystem followed by coolness and thermal comfort during summer (2.05 points, CI 0.88-2.90), indicative that students feel the benefits of trees and greenery and are well aware of environmental conservation. However, their connectedness to nature and plant care and protection was weak, with scores 1.83 (CI 0.80-2.67) and 1.08 (CI 0.62-1.60), respectively. These demonstrate that university students need more encouragement and integration of activities that connect and increase their involvement in nature, such as planting, care, protection, etc
Table 3: Assessment of students, connectedness to nature and environmental awareness with regard to university environment. (The rating was on a scale 0 strongly disagree to 4 strongly agree). (N=480).
|
S. No. |
Particulars |
Students Likelihood Response (%) |
Mean Score (SD) |
Cluster Interval (CI) 95% |
||||
|
SD |
D |
SHA |
A |
SA |
||||
|
1 |
Connectedness to nature (nature lover) |
9.79 |
13.50 |
62.70 |
11.00 |
3.01 |
1.83 (0.73) |
0.80-2.67* |
|
2 |
You care plants of the University |
30.30 |
41.50 |
19.80 |
7.33 |
1.25 |
1.08 (0.62) |
0.62-1.60* |
|
3 |
Increase coolness and thermal comfort during summer |
00.00 |
6.00 |
70.50 |
15.60 |
7.90 |
2.05 (0.77) |
0.88-2.90* |
|
4 |
Climate smart/ resilient campus |
12.70 |
18.12 |
44.37 |
22.70 |
2.11 |
1.83 (0.69) |
0.72-2.05 |
|
5 |
Greenery invites birds and helps ecosystem |
1.04 |
5.00 |
8.54 |
74.37 |
11.04 |
2.89 (0.94) |
1.70-3.51* |
|
|
Overall |
10.76 |
16.82 |
41.18 |
26.20 |
5.06 |
|
|
Discussion
Greenery in universities and other higher educational institutes is a good choice for students' quality of life as it impacts positive health and well-being.3,6,8,17,43 The currentliterature indicates the increasing psychological issues in university students’ worldwide3,4,5,11,12,13,14; greenery could relieve stress and improve students concentration to restore perceived knowledge.7,8,16 Students prefer trees aesthetically pleasing48 and therefore landscape development in educational institutions should be linked to the psychological restoration of students to harness the enhanced benefit of tree species over other vegetation.49
Land use status and tree species in GGV campus
Land use pattern of the university indicated that about 2/3 of geographical areas of the campus maintains green space which makes the campus attractive and aesthetic. The native species such as A. nilotica and B. monosperma occurred naturally without any extra efforts and care, formed a significant area of greenery in the university, and sequestered the highest amount of CO2 may also be given preference during selection. The only drawback of the species is the presence of thorns, which restrict students' preference near departments. Among planted species, P. ferrugineum and E. globulus were most abundant in the university developed all around different departments to provide green space to students during their time on the campus. There was significant variation in growing stock and CO2 stock in these species due to fluctuation in population, growth, and the varied rate of carbon fixation. Similar variation in tree carbon stock was reported with a difference in the rate of photosynthesis of the species, and carbon fixation potential35,50-53 also supports the results. Overall, more than 0.1 million trees in the university campus made the campus luxurious, full of greenery, and aesthetically attractive.
Moreover, trees contribute to CO2 load reduction from the university environment and make the university cool by modifying thermal comfort and becoming a habitat for a variety of birds and wildlife animals. Other researchers also showed that plants might reduce the CO2 concentration of classrooms and outdoor by 0-20% compared to class without plants.35Gromke et al.54 have been reported that shade trees help maintain thermal comfort during warmer weather by releasing water vapor from the leaf surface and reducing the air temperature to 1-2ºC than the area without green cover. Thus the green trees contribute to the outdoor climate of the campus, and students’ wellbeing as well.6,15
Greeneryand its impact on academic performance
The study also illustrates the student’s preferences, the likelihood of restoring knowledge, and its impact on academic performance. The result showed that university students need green environments and gave a higher rating to the restoration likelihood than those without. Students rated highest to green space for enhanced concentration and somehow agreed with other likelihoods such as reduced fatigue, creating attractive teaching-learning practices, etc. It supports the findings of other researchers showing that respondents of Europe, North American, and Asia like trees and parks to reduce stress and maintain their attentiveness.3,35,43,55,56,57In contrary to other studies, the present study was undertaken to find the students likelihood who are directly benefitted from the university's green space than showing nature posters, which is a more reliable observation.
Moreover, Stress Recovery Theory 58 and Attention restoration theory59 also suggest that after interaction with a green environment, emotional response triggers instantly and initiates a positive affective response, which induces physical and psychological behavior. The person quickly recovers from mental fatigue. The present results are also similar to the findings from another study, which demonstrate higher ratings of restoration likelihood to greenery.60 Students agreed that green space in academic institutes improves academic performance by maintaining concentration and attentiveness during exams and helps in creating an attractive learning environment around the year. Markevychet al.61 also studied the relationship of greenery on students’ academic performance. The green space acts as an academic booster for students who spend time with greenery62 by reducing mental fatigue63, increasing concentration64, and increasing self-discipline65 through classroom engagement.66 Some other literature contrasts the relationship between green space and academic achievement3,17,67 and extended exposure to greenery from classrooms24,68 but few studies differ the hypothesis that greenery helps writing test scores.6,69 This highlights the need for more research on the impact of greenery on students writing and perform better on tests.
Students involvement in plant care activities
The findings show that university students are well aware of the benefits of greenery on environmental conservation and also rated higher points. They feel that trees on the campus tend to decrease the temperature during summer and make the campus relaxed and comfortable. However, students seem reluctant in plant care and connectedness to nature at the same time. Students rated weak points to these attributes and identified it as a severe issue for university students who are poorly involved in planting and protection activities. Several studies concluded that students' connectedness to nature can vary with the respondents' demographic profile, which can modify the associations between environmental stimuli and likelihood.70,71Bogerd et al.43 reported that students with higher connectedness to the green environment rated strong preference and restoration likelihood than the students with poor connectedness to green space, but the present result differs from these findings. Therefore, to encourage the students towards strong connectedness to nature and their involvement in plant care, a program such as “one student one plant”,memory planting, green army, and nature lover groups may be initiated and promoted. Moreover, some credit scores may also be allotted in the curriculum to attract and motivate university students on a mandatory basis to environment and greenery.
Conclusions
The campus greening of educational institutions improves knowledge restoration and academic performances. However, this needs a holistic approach of land use patterns for sustainable education to the future generation. The present study deals with the tree species population in the University campus and their impact on students’ academic performance considering 54 sample plots and 480 students for judging students’ academic performance following a five-point Likert scale. That indicates that campus greening helps the environment in terms of CO2 absorption and pollution free and improves the students’ performances. The results show that about 66.07% of greening stocked 10942 tons of CO2 and a 3.12 point score for students’ concentration. However, the student’s involvement in plant care activities was found weak. To attract students towards nature building, activity-based programs may be initiated. Further experimental research is needed to consolidate a deep understanding of the greenery in the academic performance of university students. Furthermore, a long-term study to assess the C sequestration potential of individual species available in educational institutes to formulate policies to mitigate greenhouse gas may suffice the need of the future generation.
Acknowledgement
Authors are thankful to Dean and Head, School of Natural Resources, Department of Forestry, Wildlife and Environmental Sciencesfor providing necessary permission and facilities for the research work.
Conflicts of interest
Authors declared no conflict.
Funding Source
There is no funding source.
References
- Horne WR. How students spend their time In: Bornstein N, Casazzo M, editors. The learning assistance review, 2000. 52000: 22-34.
- Sharma R, Pradhan L, Kumari M, Bhattacharya P.Assessment of Carbon Sequestration Potential of Tree Species in Amity University Campus Noida. In Environmental Sciences Proceedings 2020, (3, No. 1: p. 52).
CrossRef - Krishna M, Rani BSBP, Chakravarthi GK, Madhavrao B, Chowdary SMB. Predicting Student Performance using Classification and Regression Trees Algorithm. International Journal of Innovative Technology and Exploring Engineering.2020;9(3): DOI:10.35940/ijitee.C8964.019320
CrossRef - Storrie K, Ahern K, Tuckett A.A systematic review: students with mental health problems- a growing problem. International Journal of Nursing Practice.2010;16(1):1-6. https://doi.org/10.1111/j.1440-172X.2009.01813.x
CrossRef - Macaskill A. The mental health of university students in the United Kingdom. British Journal of Guidance and Counselling.2013;41(4): 426-441.
CrossRef - Browning MHEM, Rigolon A. School Green Space and Its Impact on Academic Performance: A Systematic Literature Review. Int. J. Environ. Res. Public Health. 2019; 16: 429. http//doi.10.3390/ijerph16030429
CrossRef - Li D. Sullivan WC.Impact of views to school landscapes on recovery from stress and mental fatigue. Landscape and Urban Planning. 2016;148:149-158.
CrossRef - Kuo M, Klein SE, Browning MH, Zaplatosch J. Greening for academic achievement: prioritizing what to plant and where. Landscape and Urban Planning. 2021;206, 103962.
CrossRef - Speake J, Edmondson S, Nawaz H. Everyday encounters with nature: students’ perceptions and use of university campus green spaces. HUMAN GEOGRAPHIES Journal of Studies and Research in Human Geography. 2013;7(1): 21-31.
CrossRef - Seitz CM, Reese RF, Strack RW, Frantz S, West B. Identifying and improving green spaces on a College campus: A Photo-voice study. Ecopsychology.2014;6(2): 98-108.
CrossRef - Schmidt E, Simons M. Psychischeklachtenonderstudenten. LandelijkseStudentenVakbond (LSVb) 2013.
- Robotham D. Stress among higher education students: towards a research agenda. Higher Education.2008;56(6): 735-746.
CrossRef - Suhrcke M, Da Paz Nieves C.The impact of health and health behaviors on educational outcomes in high-income countries: a review of the evidence. Copenhagen: World Health Organization 2011.
- Arsenio WF, Loria S. Coping with negative emotions: connections with adolescents’ academic performance and stress. The Journal of Genetic Psychology. 2014; 175(1): 76-90.
CrossRef - de Vries S, Langers F, Donders JL, Willeboer JL, van den Berg AE. Meer groen op hetschoolplein: eeninterventiestudie (More greenery in schoolyards: an intervention study). Alterra report 2474, 2013, WUR-Alterra, Wageningen. https//doi:10.1016/j.ufug.2013.10.003
CrossRef - Lee KE, Williams KJH, Sargent LD, Williams NSG, Johnson KA. 40-second green roof views sustain attention: the role of micro-breaks in attention restoration. Journal of Environmental Psychology.2015;2: 82-189.
CrossRef - Shoari N, Ezzati M, Doyle YG. Nowhere to Play: Available Open and Green Space in Greater London Schools. J Urban Health 2021; 98, 375–384. https://doi.org/10.1007/s11524-021-00527-0
CrossRef - Pagels P, Raustorp A, Ponce de Leon A, Martensson F, Kylin M, Boldemann C. A repeated measurement study investigating the impact of school outdoor environment upon physical activity across ages and seasons in Swedish second, fifth and eighth graders. BMC Public Health.2014;14: 803.
CrossRef - Bringslimark T, Hartig T, Patil GG. The psychological benefits of indoor plants: a critical review of the experimental literature. Journal of Environmental Psychology. 2009; 29(4): 422-33.
CrossRef - Hartig T, Mitchell R, de Vries S, Frumkin H. Nature and Health. In: Fielding JE, editor. Annual Review of Public Health, Vol. 35. Annual Review of Public Health. 352014. p. 207. 2013. https://doi.org/10.1146/annurev-publhealth-032013-182443
CrossRef - Mcsweeney J, Rainham D, Johnson SA, Sherry SB, Singleton J. Indoor nature exposure (INE): a health-promotion framework. Health Promotion International.2015;30(1): 126-139. https://doi.org/10.1093/heapro/dau081
CrossRef - Bowler DE, Buyung-Ali LM, Knight TM, Pullin AS. A systematic review of evidence for the added benefits to health of exposure to natural environments. BMC public health. 2010; 10: 456. https://doi.org/10.1186/1471-2458-10-456
CrossRef - Lachowycz K, Jones AP. Toward a better understanding of the relationship between green space and health: development of a theoretical framework. Landscape and Urban Planning.2013;118: 62-69.
CrossRef - Benfield JA, Rainbolt GN, Bell PA, Donovan GH. Classrooms with nature views: evidence of differing student perceptions and behaviors. Environment and Behavior. 2013; 47(2): 140-157
CrossRef - McFarland A, Waliczek T, ZajicekJ.The relationship between student use of campus green spaces and perceptions of quality of life. Hort. Technology. 2008;18(2): 232-238.
CrossRef - Hartig T, Staats H. The need for psychological restoration as a determinant of environmental preferences. Journal of Environmental Psychology.2006; 26(3): 215-226.
CrossRef - Fjortoft I. Landscape as playscape: The effects of natural environments on children's play and motor development. Children, Youth and Environments. 2004; 14(2): 21-44.
- Reddy KJ, Menon KR, Thattil A. Academic Stress and its Sources among University Students. Biomed Pharmacol J. 2018; 11(1): DOI: https://dx.doi.org/10.13005/bpj/1404
CrossRef - Hurst CS, Baranik LE, Daniel F. College student stressors: a review of the qualitative research. Stress and Health. 2013; 29(4): 275-285. https://doi.org/10.1002/smi.2465
CrossRef - van den Berg AE, Wesselius JE, Maas J, Tanja-DijkstraK.Green walls for a restorative classroom environment: a controlled evaluation study. Environment and Behavior. 2016:0013916516667976.
CrossRef - Ragula A, Chandra KK.Tree species suitable for roadside afforestation and carbon sequestration in Bilaspur, India. Carbon Management, July 2020. https:doi.10.1080/17583004.2020.1790243
CrossRef - Teeuwisse S, Haxe L, van Alphen A. Schonelucht; groen en de luchtkwaliteit in de stad. EindrapportInterregproject ‘Toepassingfunctioneelgroen: luchtgroen, klimaatgroen, social groen (Clean air; greenery and urban air quality. Final report from the interregional project titled ‘Functional applications of greenery: for air, climate and society’). Publication by the Municipality of Tilburg/Municipality of Sittard-Geleen/Royal Haskoning DHV Rotterdam, 2013.
CrossRef - Kaur J, Jhamaria C. Urban air pollution and human health: a review. Current World Environment. 2021;362-377.
CrossRef - Watts A, Kline J, Haight R. Planting trees to mitigate climate change: Policy incentives could lead to increased carbon sequestration. Science Findings 236. Portland, OR: U.S. Department of Agriculture, Forest Service, Pacific Northwest Research Station. 5 p, 2021.
- vanDuijn B, Hesselink JK, Kester M, Jansen J, Spitters H. Report ‘Plant in de klas’ [Plants in the classroom]. Product Board for Horticulture/Fytagoras/Netherlands Organization for Applied Scientific Research (TNO), 2011.
- Pegas PN, Alves CA, Nunes T, Bate-Epey EF, Evtyugina M, Pio, CA.Could house plants improve indoor air quality in schools? Journal of Toxicology and Environmental Health, Part A.2012;75: 22-23, 1371-1380.
CrossRef - MHRD, Ministry of Human Resource and Development. NIRF ranking report, 2019. https://www.nirfindia.org/2019/Ranking2019.html
- Shannaq B, Ibrahim FJ, Adebiaye R. The impact of the green learning on the students’ performance. Asian Journal of Computer Science and Information Technology, 2012;2(7): 190-193.
- FSI, State of Indian Forest Report, 1996. Forest Survey of India, 1996.
- Eggleston HS, Buendia L, Miwa K. Guidelines for national greenhouse gas inventories. Hayama, Japan: IPCC National Greenhouse Gas Inventories Programme; 2006.
- IPCC. IPCC Guidelines for National Greenhouse Gas Inventory; IPCC/IGES: Hayama, Japan, 2006.
- Chandra KK, Singh AK. Carbon stock appraisal of naturally growing trees on farmlands in plain zone districts of Chhattisgarh, India. Tropical Ecology. 2018; 59(4): 679-689.
- Bogerd NVD, Dijkstra SC, Seidell JC, Maas J. Greenery in the university environment: Students’ preferences and perceived restoration likelihood. PloS One. 2018; 13(2): e0192429.
- Staats H, Kieviet A, Hartig T. Where to recover from attentional fatigue: an expectancy-value analysis of environmental preference. Journal of Environmental Psychology. 2003; 23(2): 147-157.
CrossRef - White M, Smith A, Humphryes K, Pahl S, Snelling D,Depledge M. Blue space: The importance of water for preference, affect, and restorativeness ratings of natural and built scenes. Journal of Environmental Psychology. 2010;30(4): 482-493.
CrossRef - Jahncke H, Eriksson K, Naula S. The effects of auditive and visual settings on perceived restoration likelihood. Noise and Health. 2015; 17(74): 1-10. https://doi.org/10.4103/1463-1741.149559
CrossRef - TwiskJWR.Practical guides to biostatistics and epidemiology: Applied Multilevel Analysis 4ed. New York: Cambridge University Press, 182 p. 2006.
- Paddle, E, Gilliland J. Orange is the new green: exploring the restorative capacity of seasonal foliage in schoolyard trees. Int. J. Environ. Res. Public Health, 2016, 13: 497.
CrossRef - Lindal PJ, Hartig T. Effects of urban street vegetation on judgments of restoration likelihood. Urban For. Urban Greening.2015;14: 200-209.
CrossRef - Martin AR, Sean C,Thomas. A reassessment of carbon content in tropical trees. Plos one.2011;6: e23533.
- Jimenez Perez J, Trevino Garza EJ, YerenaYamallel JI. Carbon concentration in pine-oak forest species of the Sierra Madre Oriental. Revistamexicana de ciencias forestales.2013;4: 7.
- Liu X. Trogisch S, He J, Niklaus PA, Bruelheide H, Tang Z, Erfmeier A, Scherer-Lorenzen M, Pietsch KA, Yang B, Kuhn P, Scholten T, Huang Y, Wang C, Staab M, Leppert KN, Wirth C, Schmid B, Ma K. Tree species richness increases ecosystem carbon storage in subtropical forests, Proceedings of the Royal Society of London B. 2018;28520181240. https://doi/10.1098/rspb.2018.1240
CrossRef - Dayathilake DDTL, Lokupitiya E, Wijeratne VPIS, Estimation of aboveground and belowground carbon stocks in urban freshwater wetlands of Sri Lanka. Carbon Balance and Manage. 2020; 15: 17. https://doi.org/10.1186/s13021-020-00152-5
CrossRef - Gromke C, Blocken B, Janssen W, Merema B, Hooff TV, Timmermans H. CFD analysis of transpirational cooling by vegetation: case study for specific meteorological conditions during a heat wave in Arnhem, Netherlands. Building and Environment. 2015; 83: 11-26.
CrossRef - Ozguner H, Kendle AD. Public attitudes towards naturalistic versus designed landscapes in the city of Sheffield (UK). Landscape and Urban Planning. 2006; 74(2): 139-157.
CrossRef - Dopko RL, Zelenski JM, Nisbet EK. Nature salience increases judgments of environmental satisfaction. Ecopsychology. 2014; 6(4): 207-217.
CrossRef - Maiti R, Rodriguez HG, KumariCA.Trees and shrubs with high carbon fixation/concentration. Forest Research.2015;S1:003. Hppp://doi.10.4172/2168-9776.S1-003
CrossRef - Ulrich RS. Aesthetic and affective response to natural environment. Behavior and the natural environment.1983:85-125.
CrossRef - Kaplan S. The Restorative Benefits of Nature: Towards an Integrative Framework. Journal of Environmental Psychology. 1995;15:169-182.
CrossRef - Bagot KL, Allen FCL, Toukhsati S. Perceived restorativeness of children’s school playground environments: nature, playground features and play period experiences. Journal of Environmental Psychology. 2015; 41: 1-9.
CrossRef - Markevych I, Feng X, Astell-Burt T, Standl M, Sugiri D, Schikowski T, Koletzko S, Herberth G, Bauer CP, von Berg A. Residential and school green space and academic performance: evidence from the GINI plus and LISA longitudinal studies of German adolescents. Environ. Pollution.2019;245: 71-76.
CrossRef - Leung WTV, Tam TYT, Pan WC, Wu CD, Lung SCC, Spengler JD. How is environmental greenness related to students’ academic performance in English and mathematics? Landscape Urban Planning.2019;181: 118-124.
CrossRef - Corraliza JA, Collado S. Nearby nature as a moderator of stress during childhood. Psicothema. 2011; 23: 221-226
- Kuo F, Taylor AF. A potential natural treatment for attention-deficit/hyperactivity disorder: evidence from a national study. Am. J. Public Health.2011;94: 1580-1586
CrossRef - Taylor AF, Kuo F, Sullivan WC. Views of nature and self-discipline: Evidence from inner city children. J. Environ. Psychol. 2002;22: 49-63.
CrossRef - Kuo F, Penner M, Browning M.Do lessons in nature boost subsequent classroom engagement? Refueling students in flight. Front. Psychol. 2018;8: 6-15.
CrossRef - Twohig-Bennett C, Jones A. The health benefits of the great outdoors: a systematic review andmeta-analysis of green space exposure and health outcomes. Environ. Res. 2018; 166: 628-637.
CrossRef - ChawlaL, Keena K, Pevec I, Stanley E. Green schoolyards as havens from stress and resources for resilience in childhood and adolescence. Health & Place. 2014;28:1-13. 10.1016/j.healthplace.2014.03.001
CrossRef - Tallis H, Bratman GN, SamhouriJF,Fargione J. Are California elementary school test scores more strongly associated with urban trees than poverty? Front. Psychol. 2018; 9:
CrossRef - Regan CL, Horn SA.To nature or not to nature: associations between environmental preferences, mood states and demographic factors. Journal of Environmental Psychology. 2005;25 (1): 57-66.
CrossRef - Korpela KM, Ylen M, Tyrvainen L, Silvennoinen H. Determinants of restorative experiences in everyday favorite places. Health and Place.2008;14(4): 636-652.
CrossRef


