Air Quality Assessment with Human Health Effects for Kota Metropolis, Rajasthan India.
Kuldeep Kamboj
*
 and Anil Kumar Mathur
1
Department of Civil Engineering,
University Department,
Rajasthan Technical University,
Kota,
Rajasthan
India
http://dx.doi.org/10.12944/CWE.17.2.10
Copy the following to cite this article:
Kamboj K, Mathur A. K. Air Quality Assessment with Human Health Effects for Kota Metropolis, Rajasthan (India). Curr World Environ 2022;17(2). DOI:http://dx.doi.org/10.12944/CWE.17.2.10
Copy the following to cite this URL:
Kamboj K, Mathur A. K. Air Quality Assessment with Human Health Effects for Kota Metropolis, Rajasthan (India). Curr World Environ 2022;17(2).
Download article (pdf)
Citation Manager
Publish History

Introduction
Air pollution kills about 6.9 million people worldwide, as per the World Health Organisation (WHO) 1. Particulate matter (PM) is the 4th leading cause of 85 risk factors as per the Global Burden of Disease study, leading to more than 5 million deaths in 2017 1,2. 46 Indian cities are among the 100 most polluted cities globally, attributed to the high concentration of air pollutants 3. In 2019, more than 1.13 lakh deaths in Rajasthan were due to air pollution 4. According to the literature, the primary air pollutants in the Indian scenario are Particulate matter (PM2.5 and PM10), Sulphur dioxide (SO2), Nitrogen dioxide (NO2), Ozone (O3), Carbon monoxide (CO), Lead (Pb), and (NH3)5–7.
Atmospheric particulate matter (PM) is one of the key contributors to urban and rural air pollution 8. PM2.5 (aerodynamic diameter ? 2.5 ?m) 9 and PM10 (aerodynamic diameter ? 10 ?m) 10 with significant health problems, including chronic respiratory disease 11, premature mortality 12, aggravated asthma 13, acute respiratory 14, emergency visits, and hospital admissions symptoms 15,16, and decrease in lung function 17.
Other air pollutants include Sulphur dioxide (SO2), which adversely affects the mucous upper respiratory tract and nose membranes 17,18. 10-minute exposures at 4000 ppb reduce mean lung function values among groups of healthy individuals. It is among the most significant contributors to acid rain, which has several adverse effects on soil, water, property, and materials 19,20.
Nitrogen dioxide (NO2) concentrations in Indian cities due to increased vehicles show an alarmingly high increasing trend 7,21,22. Continuous exposure to NO2 with as little concentration (0.1 ppm) for 1-3 years increases the incidence of emphysema and bronchitis and affects lung performance. Further NO2 concentration exceeding 1 ppm leads to decreased lung function and increased airway responsiveness to broncho-constrictions in healthy subjects. It also contributes to acid rains 23.
The parameters to be selected for assessing air quality in Kota metropolis, Rajasthan (India), is PM2.5, PM10, SO2, and NO2. The data is collected for all air quality monitoring stations from January 2018 to December 2021 for 4 years. This study also estimates the AQI and EF to determine the pollution category and critical level of pollutants. Very few studies have estimated human health risks due to air pollutants in Kota city. Hence, AirQ+ software is employed to assess the effect of particulate matter on human beings.
Study Area & Observation Period
The study area selected for assessing air quality is Kota metropolis, Rajasthan (India). Kota comes under the category of smart cities in India, consisting of 512 square meters of the geographical area in a dumber-like shape. The topmost length and width of the Kota district are 153 kilometres from north to south and 84 kilometres from east to west, respectively. The longitude and latitude of the district lie between 75º 37' to 77º 26' and 24º 25' to 25º 51', respectively 24,25.
The parameters selected from the literature review analysis for air quality assessment in Kota are PM10, PM2.5, SO2, and NO2. There are six manual and one continuous air sampling station situated in different localities of Kota city to measure air quality in the metropolis. The GPS coordinates of air quality monitoring stations are shown in Figure 1 and Table 1. The observation period for the study is four years, from 1st January 2018, to 31st December 2021. The data is collected from Regional Office, Rajasthan State Pollution Control Board (RSPCB), Kota.
The data are collected for PM10, PM2.5, SO2, and NO2 and then segregated for seasonal and annual analysis. The segregated data were then compared with Indian National Ambient Air Quality Standards (NAAQS), as mentioned in Table 2, to determine the pollution. The effect of the meteorological parameters such as Temperature and Rainfall is also taken into account to determine pollution. Health impacts are evaluated with the help of AirQ+ Software. The overall research methodology followed in this research work is graphically present in Figure 2.
Table 1: Monitoring Stations for Air Quality in Kota metropolis.
Sr. No. | Station | Longitude | Latitude | Station Type |
Fire Station, Shrinathpuram | 75.82 | 25.13 | Manual | |
Municipal Corporation Building | 75.83 | 25.16 | Manual | |
Rajasthan Technical University | 75.80 | 25.13 | Manual | |
RSPCB, Regional Office | 75.86 | 25.12 | Manual | |
Samcore Glass Limited | 75.91 | 25.17 | Manual | |
Sewage Treatment Plant, Balita | 75.84 | 25.22 | Manual | |
Shrinathpuram Stadium | 75.82 | 25.14 | Continuous |
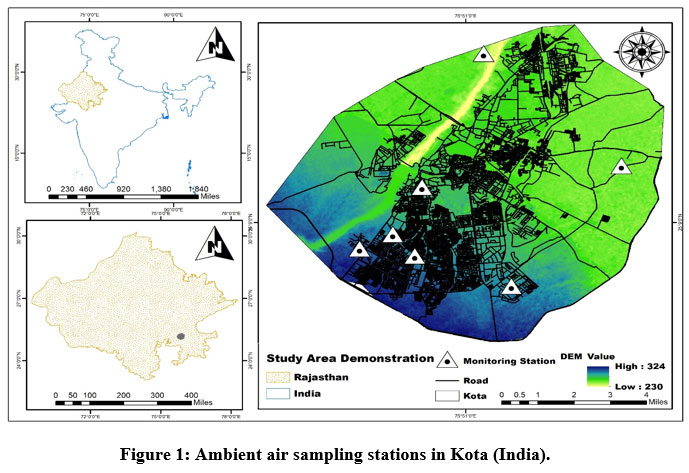 | Figure 1: Ambient air sampling stations in Kota (India). |
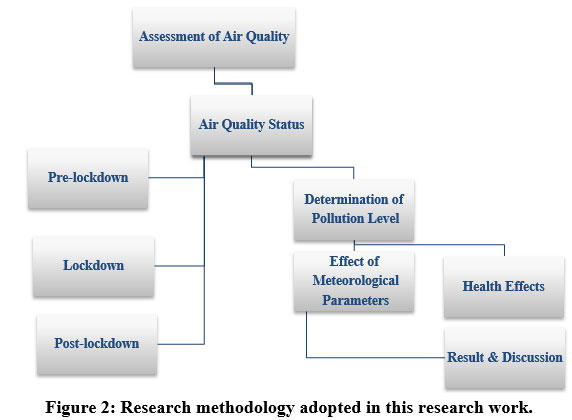 | Figure 2: Research methodology adopted in this research work. |
Table 2: NAAQS for air pollutants prescribed by CPCB18,26–28.
Pollutant (µg/m3) | TWA | Ambient air concentration | |
Non-sensitive area | Sensitive area | ||
SO2 | Yearly | ? 50 | ? 20 |
24 hour | ? 80 | ? 80 | |
NO2 | Yearly | ? 40 | ? 30 |
24 hour | ? 80 | ? 80 | |
PM10 | Yearly | ? 60 | ? 60 |
24 hour | ? 100 | ? 100 | |
PM2.5 | Yearly | ? 40 | ? 40 |
24 hour | ? 60 | ? 60 | |
*TWA: Time-weighted average
Air Quality Index
The weighted values of each air pollutant are converted into a single number by the air quality index (AQI). The CPCB method to calculate AQI in India is a two-step process, (i) Calculation of subindex for each air pollutant, and (ii) Maximum operator system to define AQI 18,29. AQI range with respective category and colour code is tabulated in Table 3.
The governing equation to calculate the subindex () is shown in equation 1.
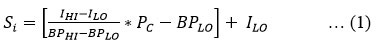
Where,
= AQI corresponding to ,
= AQI corresponding to ,
= Breakpoint concentration higher or equivalent to specified air pollutant concentration,
= Breakpoint concentration lower or equivalent to specified air pollutant concentration, and
= concentration of air pollutants.
The estimation of AQI is based on the maximum operator system, as shown in equation 2.
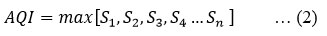
AQI range with respective category and colour code is mentioned in Table 3.
Table 3: AQI range with respective category and colour code.
AQI category | Colour | AQI Range |
Severe | Maroon | 401 to 500 |
Very poor | Red | 301 to 400 |
Poor | Orange | 201 to 300 |
Moderate | Yellow | 101 to 200 |
Satisfactory | Green | 51 to 100 |
Good | Light green | 0 to 50 |
Exceedance Factor
The ratio of the annual average concentration of critical pollutant to the annual national standard for critical pollutant is termed as exceedance factor. EF is divided into various categories depending on the values mentioned in Table 4. The Exceedance factor is to be calculated by the following equation 18,30,31:
Where,
= Exceedance Factor,
= Annual concentration of pollutant, and
= Annual standard concentration of pollutant.
Table 4: Pollution level related to exceedance factor (EF).
Category | Excee dance factor | Level of pollution |
>1.5 | Critical pollution (C) | |
1.0–1.4 | High pollution (H) | |
0.5–0.9 | Moderate pollution (M) | |
<0.5 | Low pollution (L) |
Health Effects of Particulate Matter
An assessment of human health risk due to long-term exposure to a particular air pollutant is estimated in this study with the help of WHO-invented software, AirQ+ 11–16. This software utilises concentration-response functions to execute the assessment of human health risk.
The long-term and short-term effects of PM2.5 and PM10 on current concentration are analysed in this study. LTEs and STEs are evaluated on the following basis: (a) Annual PM2.5 and PM10 concentration, (b) Population data, (c) incidence rate per lac population or cause-specific death rate, (d) Acceptable limits of Specific pollutant, and (e) WHO prescribed relative risk (RR) values 15. ENACs are provided by the AirQ+ software 14. Relative risk (RR) values obtained through the literature survey are tabulated in Table 511,15–17.
Table 5. Relative risk values for PM10 and PM2.5 14,16,17.
Mortality / Morbidity | Incidences per Lac Population | RR (CI: 95 %) |
LTEs of PM2.5 | ||
Stroke Mortality | 436 | 1.062 (1.04 - 1.083) |
IHD Mortality | 436 | 1.062 (1.04 - 1.083) |
COPD Mortality (Adults) | 101 | 1.062 (1.04 - 1.083) |
ALRI Mortality | 49 | 1.062 (1.04 - 1.083) |
Lung Cancer Mortality (Adults) | 132 | 1.062 (1.04 - 1.083) |
All Causes Mortality (Adults) | 1013 | 1.062 (1.04 - 1.083) |
STEs of PM2.5 | ||
All Causes Mortality (Adults) | 1013 | 1.012 (1.004 - 1.020) |
CVD Hospital Admission | 101 | 1.009 (1.007 - 1.016) |
Respiratory Disease Hospital Admission | 1260 | 1.019 (0.998 - 1.040) |
LTEs of PM10 | ||
Bronchitis Prevalence in Kids | 66 | 1.117 (1.04 - 1.189) |
Chronic Bronchitis Incidence | 1013 | 1.080 (0.98 - 1.190) |
Infant Mortality (Post neonatal) | 497 | 1.040 (1.02 - 1.070) |
STEs of PM10 | ||
Frequency of Asthma Symptoms | 66 | 1.028 (1.006 - 1.064) |
Results
Assessment of Air Quality
The selected monitoring period for this study was four years, from 1st January 2018 to 31st December 2021. Monthly and seasonal variations of NO2, SO2, PM10, and PM2.5 for all monitoring stations are shown in Figures 3, 4, 5, and 6, respectively. The calculated AQIs for all the monitoring stations are shown in Figure 7.
Table 6: Station-wise different air quality parameters in the Winter season.
2018 | |||||||
Parameter | AS-1 | AS-2 | AS-3 | AS-4 | AS-5 | AS-6 | AS-7 |
PM2.5 | 68.33 | 62.99 | 87.58 | 92.26 | 66.35 | 66.75 | 66.18 |
PM10 | 172.00 | 156.00 | 209.00 | 228.00 | 166.50 | 163.50 | 163.21 |
SO2 | 7.26 | 7.21 | 6.86 | 8.40 | 7.39 | 7.00 | 14.37 |
NO2 | 28.53 | 27.70 | 27.19 | 28.41 | 27.16 | 27.70 | 25.19 |
AQI | 148 | 137 | 187 | 208 | 144 | 142 | 142 |
2019 | |||||||
PM2.5 | 62.92 | 71.63 | 95.86 | 93.61 | 70.00 | 66.64 | 64.06 |
PM10 | 128.25 | 145.50 | 193.25 | 190.75 | 142.00 | 135.25 | 129.80 |
SO2 | 7.96 | 7.18 | 8.39 | 8.05 | 7.49 | 6.97 | 8.86 |
NO2 | 26.32 | 25.72 | 26.84 | 25.98 | 25.24 | 24.98 | 40.62 |
AQI | 119 | 139 | 220 | 212 | 133 | 124 | 120 |
2020 | |||||||
PM2.5 | 55.03 | 71.85 | 53.54 | 87.14 | 70.81 | - | 62.18 |
PM10 | 102.50 | 133.75 | 100.00 | 164.25 | 130.25 | - | 115.26 |
SO2 | 6.13 | 6.35 | 6.62 | 6.44 | 6.31 | - | 9.06 |
NO2 | 24.70 | 24.62 | 23.22 | 23.67 | 23.52 | - | 27.25 |
AQI | 101 | 140 | 89 | 190 | 136 | - | 110 |
2021 | |||||||
PM2.5 | 95.37 | 102.84 | 87.85 | 127.84 | 108.09 | - | 92.88 |
PM10 | 147.75 | 161.25 | 135.75 | 199.50 | 169.75 | - | 146.33 |
SO2 | 7.87 | 8.46 | 7.97 | 8.59 | 8.05 | - | 10.08 |
NO2 | 31.97 | 28.96 | 29.46 | 29.61 | 28.78 | - | 32.55 |
AQI | 218 | 243 | 193 | 306 | 260 | - | 210 |
*AS: Air Station
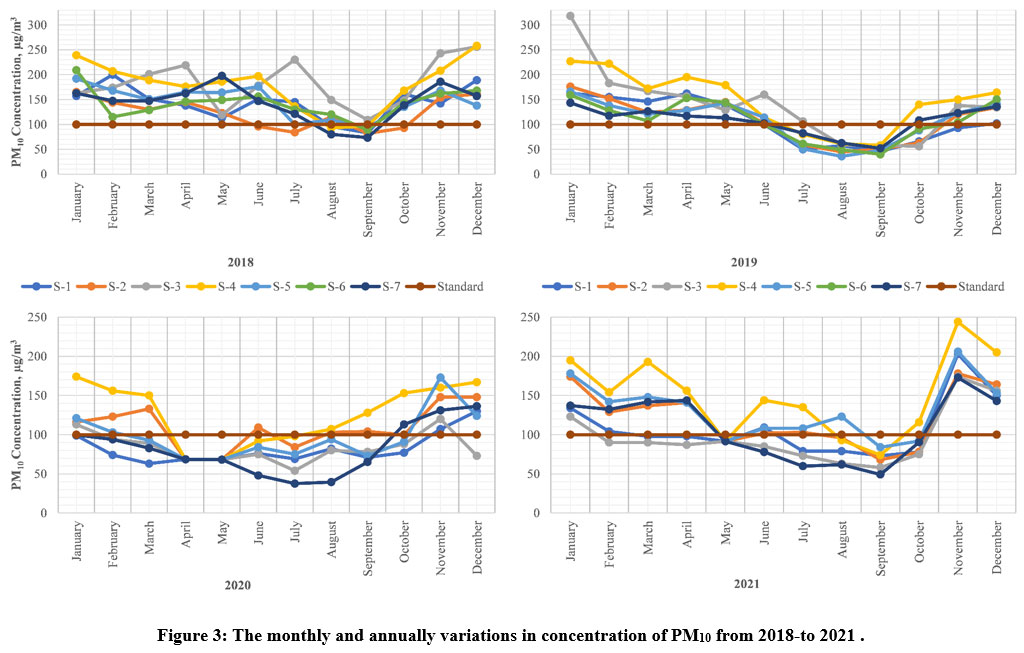
 | Figure 3: The monthly and annually variations in concentration of PM10 from 2018-to 2021 . |
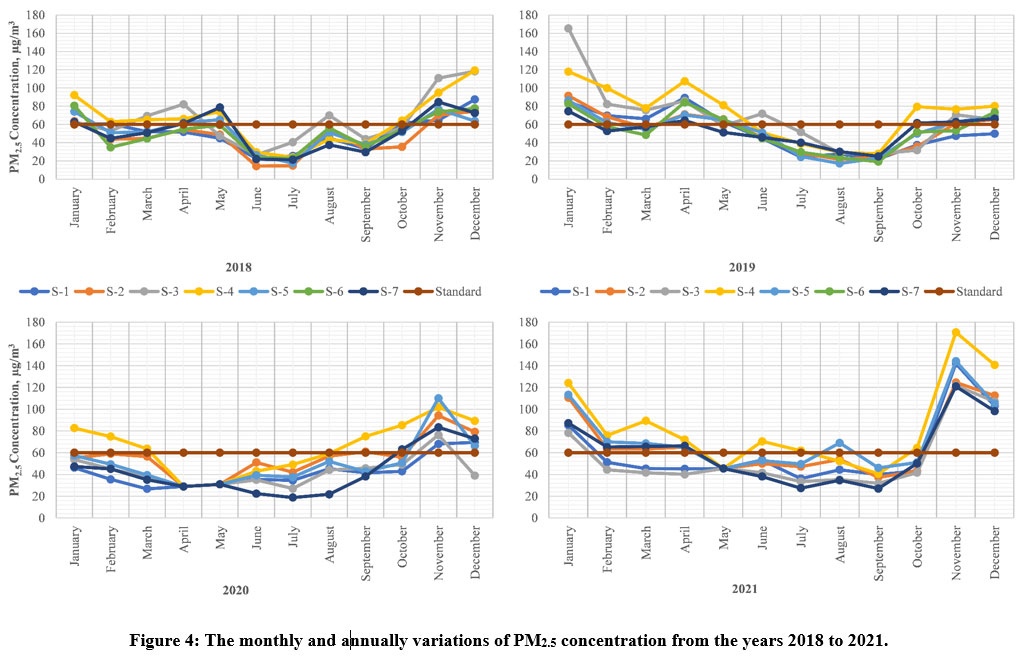 | Figure 4: The monthly and annually variations of PM2.5 concentration from the years 2018 to 2021. |
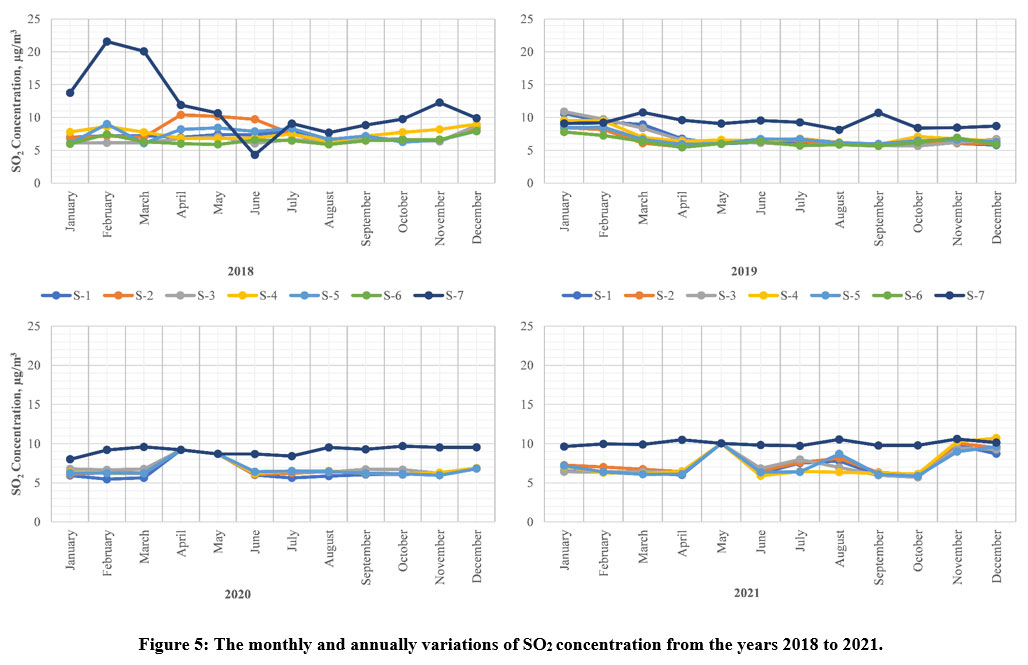
 | Figure 5: The monthly and annually variations of SO2 concentration from the years 2018 to 2021. |
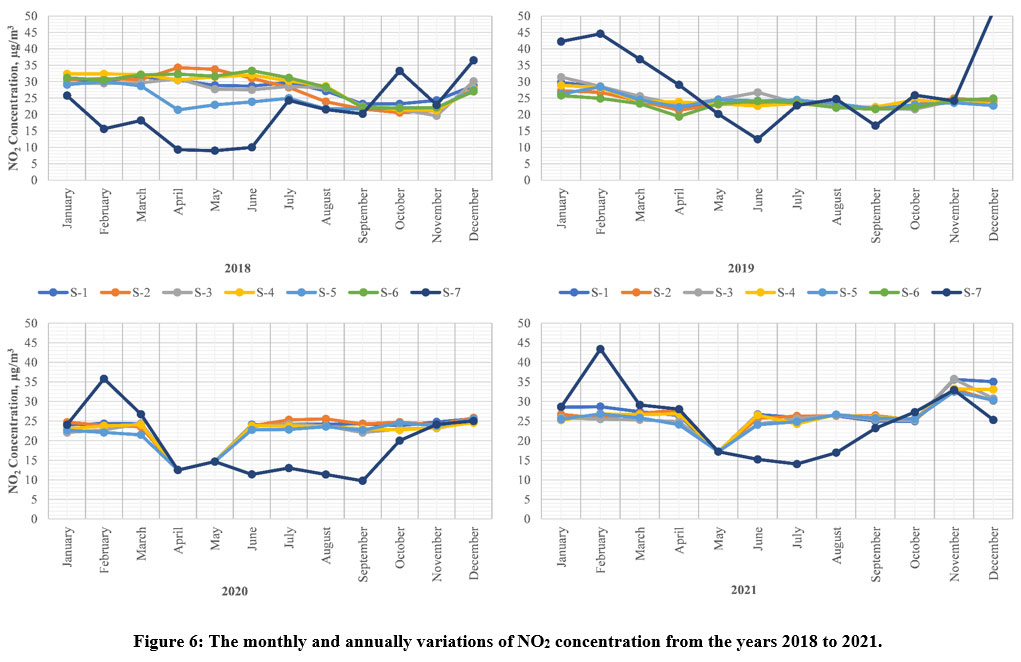 | Figure 6: The monthly and annually variations of NO2 concentration from the years 2018 to 2021. |
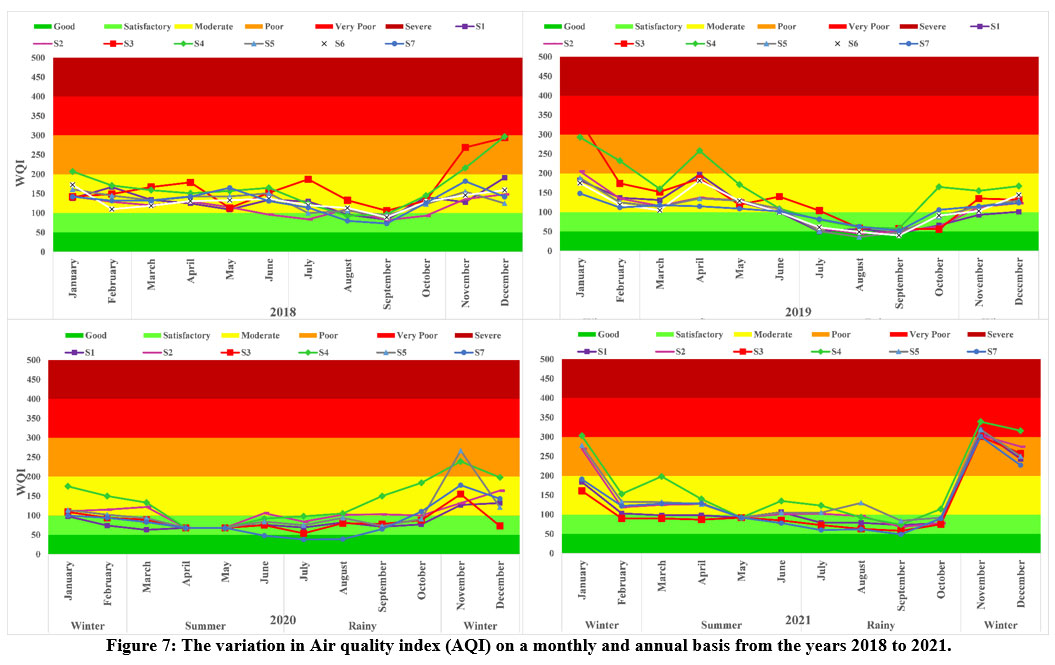 | Figure 7: The variation in Air quality index (AQI) on a monthly and annual basis from the years 2018 to 2021. |
It is clear from Table 6 that the AS-4 (Regional Office, RSPCB) air quality monitoring station is in the topmost position in the Winter season among all stations. It is observed from the analysis of monitored data that the air quality of this area is continuously deteriorating. Particulate matter is the leading cause of the worst air quality in this area. This area's PM2.5 and PM10 concentrations were 92.26 and 228 µg/m3 in 2018, 95.86 and 193.25 µg/m3 in 2019, 87.14 and 164.25 µg/m3 in 2020, and 127.84 and 199.50 µg/m3 in 2021, respectively.
The AS-3 (Rajasthan Technical University) air quality monitoring station is lower in particulate matter concentrations than other stations. The monitored PM2.5 and PM10 concentrations were 87.58 and 209 µg/m3 in 2018, 62.92 and 128.25 µg/m3 in 2019, 53.54 and 100 µg/m3 in 2020, and 87.14 and 164.25 µg/m3 in 2021, respectively. The variation in concentration of PM10 and PM2.5 on a monthly and annual basis for all monitoring stations is shown in Figures 3 and 4.
The CPCB permissible limits of PM10 and PM2.5 are 100 and 60 micrograms per meter cube, respectively. Not a single location follows the CPCB standards for PM10 providing significant evidence of being an air pollutant. A similar scenario is observed for PM2.5 except for two stations (AS-1 and AS-3) in 2020. It has been observed that the station with a high PM2.5 concentration also has a higher concentration of PM10 and vice versa in the Winter season.
Shreenathpuram stadium (AS-7) always has a high concentration of SO2, but the concentrations were almost seven times lower than the prescribed limit of 80 µg/m3 mentioned in Indian NAAQS. All other stations have almost similar trends for SO2 in the Winter season each year during the observation period of 4 years. The highest and lowest concentration of SO2 were 14.37 and 6.86 µg/m3 in 2018, 8.86 and 6.97 µg/m3 in 2019, 9.06 and 6.13 µg/m3 in 2020, and 10.08 and 7.87 µg/m3 in 2021, respectively. The variation in concentration of SO2 on a monthly and annual basis for all monitoring stations is shown in Figure 5.
Monitoring station AS-7 also has a high concentration of NO2, but the concentration is almost two times lower than the prescribed limit of 80 micrograms per meter cube set by the CPCB India. The maximum and minimum concentrations of NO2 were 28.53 and 25.19 µg/m3 in 2018, 40.62 and 24.98 µg/m3 in 2019, 27.25 and 23.22 µg/m3 in 2020, and 32.55 and 28.78 µg/m3 in 2021, respectively. The variation in concentration of NO2 on a monthly and annual basis for all Sampling locations is shown in Figure 6.
Air Quality Index (AQI) is also calculated from the method given by the Central Pollution Control board, India. The AQI results exhibit a high dependency on the amount of particulate matter. Stations with a higher concentration of particulate matter (PM2.5 and PM10) also have higher AQI and Vice Versa values. The largest and lowest concentration of AQI were 208 and 137 in 2018, 220 and 119 in 2019, 190 and 89 in 2020, and 306 and 193 in 2021, respectively. The AQI varied from 89 (satisfactory) to 306 (very poor) during the observation period during the Winter seasons. The variation in AQI on a monthly and annual basis for all monitoring stations is shown in Figure 7.
Table 7: Station-wise air quality parameters in the Summer season.
2018 | |||||||
Parameters | AS-1 | AS-2 | AS-3 | AS-4 | AS-5 | AS-6 | AS-7 |
PM2.5 | 42.85 | 40.63 | 47.41 | 58.67 | 51.30 | 45.47 | 53.12 |
PM10 | 138.25 | 123.50 | 179.25 | 187.00 | 163.75 | 145.00 | 163.71 |
SO2 | 7.25 | 9.33 | 6.51 | 7.07 | 7.65 | 6.19 | 11.74 |
NO2 | 29.86 | 32.43 | 28.94 | 31.56 | 24.22 | 32.35 | 11.62 |
AQI | 126 | 116 | 153 | 158 | 143 | 130 | 142 |
2019 | |||||||
PM2.5 | 65.79 | 59.66 | 72.93 | 79.38 | 60.30 | 60.70 | 54.71 |
PM10 | 136.75 | 125.00 | 153.00 | 165.00 | 126.50 | 126.00 | 114.73 |
SO2 | 6.99 | 6.14 | 6.83 | 6.59 | 6.34 | 6.05 | 9.74 |
NO2 | 23.42 | 22.87 | 24.95 | 23.42 | 23.85 | 22.50 | 24.62 |
AQI | 125 | 117 | 143 | 165 | 118 | 117 | 110 |
2020 | |||||||
PM2.5 | 30.55 | 41.85 | 33.20 | 41.66 | 34.67 | - | 29.37 |
PM10 | 68.89 | 94.64 | 75.14 | 94.54 | 78.39 | - | 66.83 |
SO2 | 7.38 | 7.56 | 7.76 | 7.57 | 7.63 | - | 9.04 |
NO2 | 18.87 | 18.62 | 18.79 | 18.76 | 17.85 | - | 16.32 |
AQI | 69 | 95 | 75 | 95 | 78 | - | 67 |
2021 | |||||||
PM2.5 | 47.35 | 55.96 | 40.22 | 69.31 | 57.97 | - | 53.89 |
PM10 | 99.13 | 117.88 | 88.38 | 146.13 | 122.13 | - | 113.74 |
SO2 | 7.14 | 7.43 | 7.41 | 7.15 | 7.17 | - | 10.06 |
NO2 | 24.43 | 24.41 | 22.90 | 24.30 | 22.81 | - | 22.40 |
AQI | 99 | 112 | 88 | 131 | 115 | - | 109 |
It is clear from Table 7 that the AS-4 (Regional Office, RSPCB) air quality monitoring station is again in the topmost position in the Summer season among all stations. It is observed from the analysis of monitored data that the air quality of this area is continuously deteriorating. Particulate matter is the leading cause of the worst air quality in this area. This area's PM2.5 and PM10 concentrations were 58.67 and 187 µg/m3 in 2018, 79.38 and 165 µg/m3 in 2019, 41.66 and 94.54 µg/m3 in 2020, and 146.13 and 69.31 µg/m3 in 2021, respectively.
The AS-2 (Municipal Corporation) air quality monitoring station is lower in particulate matter concentrations than other stations. The monitored PM2.5 and PM10 concentrations were 40.63 and 123.50 µg/m3 in 2018, 59.66 and 125 µg/m3 in 2019, 41.85 and 94.64 µg/m3 in 2020, and 55.96 and 117.88 µg/m3 in 2021, respectively. The variation in concentration of PM10 and PM2.5 on a monthly and annual basis for all monitoring stations is shown in Figures 3 and 4.
The CPCB standards for PM10 and PM2.5 are 100 and 60 micrograms per meter cube, respectively. Not a single location follows the CPCB standards for PM10 except in 2020, providing significant evidence of being an air pollutant in Summers. A different scenario is observed for PM2.5. The PM2.5 concentration is within prescribed limits in Summers except in 2020. It has been observed that the station with a high PM2.5 concentration also has a higher concentration of PM10 and vice versa in the Summer season.
The concentrations of SO2 were almost seven times lower than the prescribed limit of 80 µg/m3 mentioned in Indian NAAQS for all stations in Summers during the observation period of 4 years. All stations have almost similar trends for SO2 in the Winter season each year during the observation period. The highest and lowest concentration of SO2 were 11.74 and 6.19 µg/m3 in 2018, 9.74 and 6.05 µg/m3 in 2019, 9.04 and 7.38 µg/m3 in 2020, and 10.06 and 7.14 µg/m3 in 2021, respectively. The variation in concentration of SO2 on a monthly and annual basis for all monitoring stations is shown in Figure 5.
The NO2 concentration is almost four times lower than the prescribed limit of 80 micrograms per meter cube set by CPCB India. The maximum and minimum concentrations of NO2 were 32.43 and 11.62 micrograms per cubic meter in 2018, 24.95 and 22.50 micrograms per cubic meter in 2019, 18.87 and 16.32 µg/m3 in 2020, and 24.43 and 22.40 µg/m3 in 2021, respectively. The variation in concentration of NO2 on a monthly and annual basis for all monitoring stations is shown in Figure 6.
Air Quality Index (AQI) is also calculated from the method given by the CPCB, India. The AQI results exhibit a high dependency on the amount of particulate matter. Stations with a higher concentration of particulate matter (PM2.5 and PM10) also have higher AQI and Vice Versa values. The largest and lowest concentration of AQI were 158 and 116 in 2018, 165 and 110 in 2019, 95 and 67 in 2020, and 131 and 88 in 2021, respectively. The AQI varied from 67 (satisfactory) to 165 (moderate) during the observation period during the Summer seasons. The variation in AQI on a monthly and annual basis for all monitoring stations is shown in Figure 7.
Table 8: Station-wise air quality parameters in the Rainy season.
2018 | |||||||
Parameter | AS-1 | AS-2 | AS-3 | AS-4 | AS-5 | AS-6 | AS-7 |
PM2.5 | 41.38 | 34.33 | 52.72 | 42.71 | 39.55 | 42.42 | 35.34 |
PM10 | 121.25 | 93.50 | 159.00 | 123.50 | 109.50 | 120.50 | 103.26 |
SO2 | 6.86 | 6.79 | 6.57 | 7.19 | 7.10 | 6.36 | 8.84 |
NO2 | 25.84 | 23.60 | 25.17 | 25.64 | 22.61 | 25.89 | 24.81 |
AQI | 114 | 94 | 139 | 116 | 106 | 114 | 102 |
2019 | |||||||
PM2.5 | 27.84 | 27.55 | 34.92 | 43.92 | 28.80 | 31.04 | 39.17 |
PM10 | 54.75 | 54.25 | 69.75 | 84.75 | 55.75 | 60.25 | 76.31 |
SO2 | 6.10 | 6.07 | 5.77 | 6.50 | 6.33 | 5.86 | 9.13 |
NO2 | 22.69 | 22.68 | 22.29 | 23.05 | 23.11 | 22.34 | 22.49 |
AQI | 55 | 54 | 70 | 85 | 56 | 60 | 76 |
2020 | |||||||
PM2.5 | 41.11 | 53.93 | 41.51 | 67.14 | 45.76 | - | 35.45 |
PM10 | 74.75 | 97.75 | 75.00 | 121.50 | 83.25 | - | 63.78 |
SO2 | 5.90 | 6.27 | 6.57 | 6.34 | 6.33 | - | 9.22 |
NO2 | 24.13 | 24.96 | 23.26 | 23.27 | 23.42 | - | 13.53 |
AQI | 75 | 98 | 75 | 124 | 83 | - | 64 |
2021 | |||||||
PM2.5 | 40.98 | 45.43 | 35.57 | 54.77 | 53.93 | - | 34.83 |
PM10 | 77.25 | 86.25 | 67.25 | 104.50 | 101.75 | - | 65.33 |
SO2 | 6.78 | 7.03 | 6.66 | 6.30 | 6.76 | - | 9.95 |
NO2 | 25.54 | 26.08 | 25.66 | 25.63 | 25.70 | - | 20.36 |
AQI | 77 | 86 | 67 | 103 | 101 | - | 65 |
It is clear from Table 8 that the AS-4 (Regional Office, RSPCB) air quality monitoring station is in the topmost position during the Rainy season among all stations. It is observed from the analysis of monitored data that the air quality of this area is continuously deteriorating. Particulate matter is the leading cause of the worst air quality in this area. This area's PM2.5 and PM10 concentrations were 42.71 and 123.50 micrograms per cubic meter in 2018, 43.92 and 84.75 micrograms per cubic meter in 2019, 67.14 and 121.50 µg/m3 in 2020, and 54.77 and 104.50 µg/m3 in 2021, respectively.
The AS-7 (Shreenathpuram Stadium) air quality monitoring station is lower in particulate matter concentrations than other stations. The monitored PM2.5 and PM10 concentrations were 35.34 and 103.26 micrograms per cubic meter in 2018, 39.17 and 76.31 micrograms per cubic meter in 2019, 35.45 and 63.78 µg/m3 in 2020, and 34.83 and 65.33 µg/m3 in 2021, respectively. The variation in concentration of PM10 and PM2.5 on a monthly and annual basis for all monitoring stations is shown in Figures 3 and 4.
The CPCB standards for PM10 and PM2.5 are 100 and 60 micrograms per meter cube, respectively. All monitoring location follows the CPCB standards for PM10 except for the 2018 Rainy season, providing significant improvement in the air quality. A different scenario is observed for PM2.5. All monitoring location follows the CPCB standards for PM2.5. It has been observed that the station with a high PM2.5 concentration also has a higher concentration of PM10 and vice versa in the Rainy season.
Shreenathpuram stadium (AS-7) always has a high concentration of SO2, but the concentrations were almost seven times lower than the prescribed limit of 80 µg/m3 mentioned in Indian NAAQS. Rest all stations have almost similar trends for SO2 in the Winter season each year during the observation period of 4 years. The highest and lowest concentration of SO2 was 8.84 and 6.36 micrograms per cubic meter in 2018, 9.13 and 5.77 micrograms per cubic meter in 2019, 9.22 and 5.90 µg/m3 in 2020, and 9.95 and 6.30 µg/m3 in 2021, respectively. The variation in concentration of SO2 on a monthly and annual basis for all monitoring stations is shown in Figure 5.
Monitoring station AS-2 (Municipal Corporation) has a high concentration of NO2 during the observation period. Still, the concentration is almost three times lower than the prescribed limit of 80 micrograms per meter cube set by the CPCB India for all stations. The maximum and minimum concentrations of NO2 were 25.89 and 22.61 micrograms per cubic meter in 2018, 23.11 and 22.29 micrograms per cubic meter in 2019, 24.96 and 13.53 µg/m3 in 2020, and 26.08 and 20.36 µg/m3 in 2021, respectively. The variation in concentration of NO2 on a monthly and annual basis for all sampling locations is shown in Figure 6.
Air Quality Index (AQI) is also calculated from the method given by the CPCB, India. The AQI results exhibit a high dependency on the amount of particulate matter. Stations with a higher concentration of particulate matter (PM2.5 and PM10) also have high AQI and Vice Versa. The largest and lowest concentration of AQI were 139 and 94 in 2018, 85 and 54 in 2019, 124 and 98 in 2020, and 103 and 65 in 2021, respectively. The AQI varied from 54 (satisfactory) to 139 (moderate) during the observation period during the Rainy seasons. The variation in AQI on a monthly and annual basis for all monitoring stations is shown in Figure 7.
Table 9: Station-wise air quality parameters annually.
2018 | |||||||
Parameter | AS-1 | AS-2 | AS-3 | AS-4 | AS-5 | AS-6 | AS-7 |
PM2.5 | 50.85 | 45.98 | 65.09 | 64.55 | 52.40 | 51.55 | 51.54 |
PM10 | 143.83 | 124.33 | 182.42 | 179.50 | 146.58 | 143.00 | 143.39 |
SO2 | 7.12 | 7.77 | 6.65 | 7.55 | 7.38 | 6.52 | 11.65 |
NO2 | 28.08 | 27.91 | 27.10 | 28.53 | 24.66 | 28.64 | 20.54 |
AQI | 129 | 116 | 155 | 153 | 131 | 129 | 129 |
2019 | |||||||
PM2.5 | 52.18 | 52.95 | 67.90 | 72.30 | 53.03 | 52.79 | 52.65 |
PM10 | 106.58 | 108.25 | 138.67 | 146.83 | 108.08 | 107.17 | 106.95 |
SO2 | 7.02 | 6.46 | 7.00 | 7.05 | 6.72 | 6.29 | 9.25 |
NO2 | 24.15 | 23.76 | 24.69 | 24.15 | 24.07 | 23.27 | 29.24 |
AQI | 104 | 106 | 126 | 141 | 105 | 105 | 105 |
2020 | |||||||
PM2.5 | 42.17 | 55.87 | 42.75 | 65.31 | 50.42 | - | 42.33 |
PM10 | 81.92 | 108.71 | 83.38 | 126.80 | 97.30 | - | 81.96 |
SO2 | 6.47 | 6.72 | 6.98 | 6.78 | 6.76 | - | 9.11 |
NO2 | 22.57 | 22.73 | 21.76 | 21.90 | 21.59 | - | 19.04 |
AQI | 82 | 93 | 83 | 118 | 97 | - | 82 |
2021 | |||||||
PM2.5 | 61.23 | 68.08 | 55.21 | 83.97 | 73.33 | - | 60.53 |
PM10 | 108.04 | 121.79 | 97.13 | 150.04 | 131.21 | - | 108.47 |
SO2 | 7.26 | 7.64 | 7.31 | 7.34 | 7.31 | - | 10.03 |
NO2 | 27.32 | 26.48 | 26.01 | 26.51 | 25.76 | - | 25.10 |
AQI | 105 | 127 | 97 | 180 | 144 | - | 106 |
It is clear from Table 9 that the AS-4 (Regional Office, RSPCB) air quality monitoring station is in the topmost position annual basis among all stations. It is observed from the analysis of monitored data that the air quality of this area is continuously deteriorating. Particulate matter is the leading cause of the worst air quality in this area. This area's PM2.5 and PM10 concentrations were 64.55 and 179.50 micrograms per cubic meter in 2018, 72.30 and 146.83 micrograms per cubic meter in 2019, 65.31 and 126.80 µg/m3 in 2020, and 83.97 and 150.04 µg/m3 in 2021, respectively.
The AS-1 (Fire Station) air quality monitoring station is lower in particulate matter concentrations than other stations. The monitored PM2.5 and PM10 concentrations were 50.85 and 143.83 micrograms per cubic meter in 2018, 52.18 and 106.58 micrograms per cubic meter in 2019, 42.17 and 81.92 µg/m3 in 2020, and 61.23 and 108.04 µg/m3 in 2021, respectively. The variation in concentration of PM10 and PM2.5 on a monthly and annual basis for all monitoring stations is shown in Figures 3 and 4.
The CPCB standards for annual PM10 and PM2.5 are 60 and 40 micrograms per meter cube, respectively. Not a single location follows standards for PM10 and PM2 .5, providing significant evidence of being air pollutants. It has been observed that the station with a high PM2.5 concentration also has a higher concentration of PM10 and vice versa in the Winter season.
Shreenathpuram stadium (AS-7) always has a high concentration of SO2, but the concentrations were almost four times lower than the prescribed limit of 50 µg/m3 mentioned in Indian NAAQS. All other stations have almost similar trends for SO2 each year during the observation period of 4 years. The highest and lowest concentration of SO2 were 11.65 and 6.52 micrograms per cubic meter in 2018, 9.25 and 6.29 micrograms per cubic meter 2019, 9.11 and 6.47 µg/m3 in 2020, and 10.03 and 7.26 µg/m3 in 2021, respectively. The variation in concentration of SO2 on a monthly and annual basis for all monitoring stations is shown in Figure 5.
The NO2 concentration is almost 1.5 times lower than the prescribed limit of 40 micrograms per cubic meter set by CPCB India. The maximum and minimum concentrations of NO2 were 28.64 and 20.54 micrograms per cubic meter in 2018, 29.24 and 23.27 micrograms per cubic meter in 2019, 22.57 and 21.76 µg/m3 in 2020, and 27.32 and 25.10 µg/m3 in 2021, respectively. The variation in concentration of NO2 on a monthly and annual basis for all sampling locations is shown in Figure 6.
Air Quality Index (AQI) is also calculated from the method given by the Central Pollution Control Board, India. The AQI results exhibit a high dependency on the amount of particulate matter. Stations with a higher concentration of particulate matter (PM2.5 and PM10) also have high AQI and Vice Versa. The largest and lowest concentration of AQI were 155 and 116 in 2018, 141 and 104 in 2019, 118 and 82 in 2020, and 180 and 97 in 2021, respectively. The AQI varied from 82 (satisfactory) to 155 (moderate) during the observation period each year. The variation in AQI on a monthly and annual basis for all monitoring stations is shown in Figure 7.
Exceedance Factor
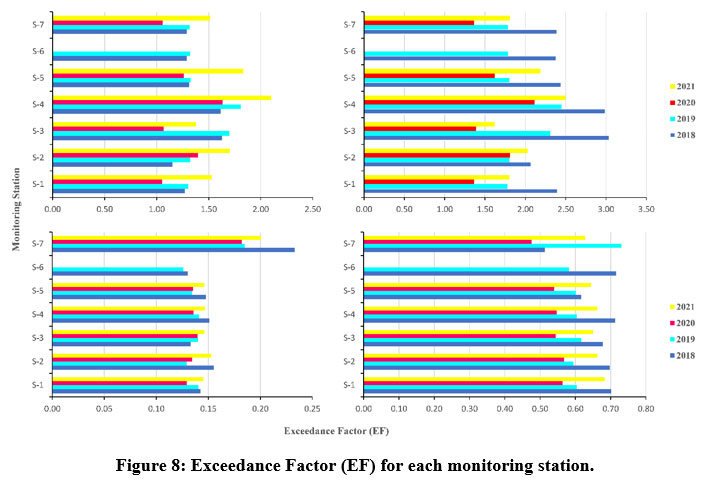
EF was more than 1 for all monitoring stations for PM10 and PM2.5, exhibiting High pollution (H), 0.5-.09 indicates Moderate pollution (M) for NO2, while less than .5 for SO2 exhibits Low pollution (L). The exceedance Factor (EF) for air quality parameters at each monitoring station is shown in Figure 8 and tabulated in Table 10.
Table 10. Exceedance Factor (EF) for air quality parameters at each monitoring station.
Parameter | Year | AS-1 | AS-2 | AS-3 | AS-4 | AS-5 | AS-6 | AS-7 |
PM2.5 | 2018 | 1.27 | 1.15 | 1.63 | 1.61 | 1.31 | 1.29 | 1.29 |
2019 | 1.30 | 1.32 | 1.70 | 1.81 | 1.33 | 1.32 | 1.32 | |
2020 | 1.05 | 1.40 | 1.07 | 1.63 | 1.26 | - | 1.06 | |
2021 | 1.53 | 1.70 | 1.38 | 2.10 | 1.83 | - | 1.51 | |
PM10 | 2018 | 2.40 | 2.07 | 3.04 | 2.99 | 2.44 | 2.38 | 2.39 |
2019 | 1.77 | 1.80 | 2.31 | 2.45 | 1.80 | 1.79 | 1.78 | |
2020 | 1.36 | 1.81 | 1.39 | 2.11 | 1.62 | - | 1.37 | |
2021 | 1.80 | 2.03 | 1.62 | 2.50 | 2.19 | - | 1.81 | |
SO2 | 2018 | 0.14 | 0.16 | 0.12 | 0.15 | 0.15 | 0.13 | 0.23 |
2019 | 0.14 | 0.12 | 0.15 | 0.14 | 0.13 | 0.14 | 0.19 | |
2020 | 0.12 | 0.13 | 0.14 | 0.14 | 0.14 | - | 0.18 | |
2021 | 0.14 | 0.15 | 0.15 | 0.16 | 0.16 | - | 0.20 | |
NO2 | 2018 | 0.70 | 0.70 | 0.68 | 0.71 | 0.62 | 0.72 | 0.51 |
2019 | 0.60 | 0.59 | 0.62 | 0.60 | 0.60 | 0.58 | 0.73 | |
2020 | 0.56 | 0.57 | 0.54 | 0.55 | 0.54 | - | 0.50 | |
2021 | 0.68 | 0.66 | 0.65 | 0.66 | 0.64 | - | 0.63 |
 | Figure 8: Exceedance Factor (EF) for each monitoring station. |
Health Effect of Particulate Matter
The average concentrations of PM10 and PM2.5 obtained from the Shreenathpuram station (AS-7) for Kota during the observation period are 110.2 and 51.8 µg/m3. LTEs and STEs of particulate matter pollution are estimated with these average values of PM10 and PM2.5. The estimated long-term impact of current PM2.5 concentration on human health is shown in Table 11. The PM2.5-induced long-term ENACs for all causes of mortality, COPD, ALRI, LC, IHD, and stroke were 4546, 435, 255, 806,1958, and 1772, respectively, Whereas the short-term ENACs for CVDHA (cardiovascular disease), RDHA (respiratory disease hospital admission), and all-cause mortality (adults) were 49, 1251, and 659, respectively. The estimated short-term impact of current PM2.5 concentration on human health is shown in Table 12.
Table 11: The estimated long-term impact of current PM2.5 concentration on human health.
All Causes Mortality (Adults) | ||
| Mean | Confidence Interval (CI) |
ENACs | 4546 | 3092 - 5795 |
Lung Cancer Mortality (Adults) | ||
ENACs | 806 | 403 - 1124 |
ALRI Mortality | ||
ENACs | 255 | 162 - 332 |
COPD Mortality (Adults) | ||
ENACs | 435 | 281 - 647 |
IHD Mortality | ||
ENACs | 1958 | 1321 - 3756 |
Stroke Mortality | ||
ENACs | 1772 | 1055 - 2826 |
The ENACs (long-term) for postneonatal infant mortality, the prevalence of bronchitis, and chronic bronchitis due to PM10 increased by 326006, 716, and 13700, respectively, Whereas the ENAC (short-term) for asthma symptoms in kids, was 322. The estimated LTEs and STEs of current PM10 concentration on human health are shown in Table 13.
Long-term effects of PM10 and PM2.5 are compared with National Capital Territory (NCT) Delhi (India) 14, Alwar (India) 32, and Tehran (Iran) 33. The maximum number of cases was for NCT Delhi, followed by Alwar, Kota, and Tehran. It is due to the difference between the annual concentration of particulate matter (PM10 and PM2.5) among these cities. The annual concentration of PM10 and PM2.5 were 292 and 73.53 micrograms per cubic meter at NCT Delhi, 158.75 and 73.53 µg/m3 at Alwar, and 110.2 and 51.8 µg/m3 at Kota, respectively. The annual PM2.5 concentration in Tehran (Iran) was 34.5 µg/m3. Different studies suggest that as the concentration of particulate matter increases, disease cases also increase. A comparison of Long-term effects among different cities is tabulated in Table 14.
Table 12: Estimated short-term impact of current PM2.5 concentration on human health.
Respiratory Disease Hospital Admission | ||
| Average | CI |
ENACs | 1251 | 0 - 2549 |
CVD Hospital Admission | ||
ENACs | 49 | 9 - 88 |
All Causes Mortality | ||
ENACs | 659 | 245 - 1062 |
Table 13: Long-term effects (LTEs) and short-term effects (STEs) of PM10 for Kota.
Infant Mortality (Post Neonatal) (LTEs) | |||
| Mean | CI | |
ENACs | 326006 | 180553 - 493915 | |
Chronic Bronchitis Incidences (Adults) | |||
ENACs | 13700 | 6645 - 16839 | |
Prevalence of Bronchitis in Kids | |||
ENACs | 716 | 0 - 1099 | |
Asthma Symptoms Kids (STEs) | |||
ENACs | 322 | 78 - 523 | |
|
|
|
|
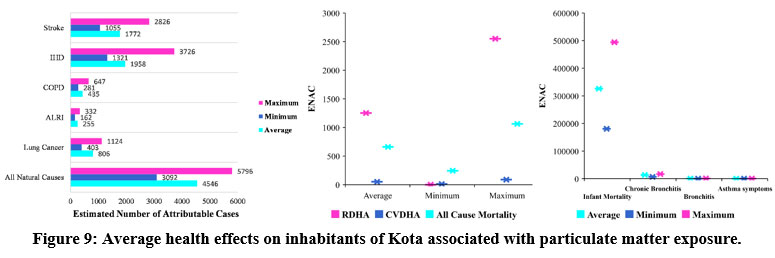 | Figure 9: Average health effects on inhabitants of Kota associated with particulate matter exposure. |
Table 14: Comparison of Long-term effects among different cities 14,32,33.
PM2.5 | Long Term Effect | Kota, India | Alwar, India | NCT, Delhi | Tehran, Iran |
All-natural causes mortality | 4546 | 12867 | 72254 | 6710 | |
COPD for adults | 435 | 1089 | 6545 | 172 | |
Lung cancer | 806 | 2225 | 7568 | 135 | |
Stroke | 1772 | 4353 | 28233 | 1145 | |
PM10 | All natural causes mortality | 326006 | 878494 | 150110 | - |
Chronic bronchitis in adults | 13700 | 32698 | 50810 | - | |
Bronchitis in children | 716 | 1799 | 1189 | - |
Discussion
The main reasons behind low concentrations of SO2 and NO2 are the absence of a source of their primary production, such as burning fossil fuels, and other reduction initiatives taken by the Government 18,20,34,35. The leading causes of higher PM10 and PM2.5 are natural dunes 36, cement plants 37, stone cutting industries 37, crushing industries38, municipal incineration, power plants, chemical plants 39, diesel and petrol stations 19, natural dust 9, stuble burning 40, vehicular population 36, etc.
Air quality varies enormously from day to day at a particular location due to the dynamics of the atmosphere, even though emissions may remain relatively constant. The factors affecting the atmosphere's dynamics are temperature, pressure, wind, moisture, and relative humidity 18.
The maximum concentration of air pollutants was observed in the Winter season, followed by the Summer and Rainy seasons of the observation period except the year 2020. High-pressure systems are generally encountered during Winter. High-pressure systems are related to clear sky, light winds, and atmospheric stability. When such a system becomes stagnant over an area for several days, air contaminants can cause air pollution problems.
While low-pressure systems (usually associated with cloudy skies, gusty winds, atmosphere instability, and the formation of fronts) and other meteorological parameters significantly contribute to the lower concentration of pollutants in the Summer and Rainy seasons.
The minimum concentration was detected during the Rainy season. The main reason behind it is that the precipitation occurred due to the study area's southwest monsoon and a low-pressure system. Rain always serves as a cleaning agent for the atmosphere, removing soluble gases and particulate matter in a washout process 41.
The Summer season in 2020 has the lowest concentrations of air pollutants compared to the Rainy season. It may be because India was affected by the outbreak of Coronavirus Disease of 2019 (Covid-19), the global-level infectious disease declared as a pandemic by WHO (World Health Organization) 7.
Many countries had started imposing complete lockdown across the globe resulting in full closure of business, trade, cultural, tourist, educational, and socio-economic activities. India went for a complete lockdown starting from 25th March 2020, which continued till 17th May 2020, as imposed by the Government of India 42,43.
This lockdown resulted in the complete halting of transportation, business activities, shops and malls, tourist and recreational centres, and other economic activities. This resulted in a significant decrease in fuel demand by almost 70% due to the non-movement of transport and domestic vehicles, regularly used for movement 44.
There are varied reasons which may be attributed to improvement in air quality in lockdown. Closure of industrial and transportation activities, reduced mining, and lesser economic activities have significantly reduced particulate matter concentrations. This also concurs that traffic pollution and industrial activities which are major point source contributors to deteriorating air quality. Sustainable remedial measures are to be considered as a major step towards reducing air pollution and having a proper balance with economic activities. However, it is noteworty that the lockdown was also forced in 2021, but it had less impact on air quality improvement compared to the lockdown in 2020 in India.
Conclusion
This study concludes that Kota metropolis is subjected to particulate matter pollution and inhabitants of the city are extremely susceptible to the adverse effects of PM10 and PM2.5. Urbanised areas are the prime hotspots that contribute significantly toward particulate matter concentrations. Lifestyle patterns, culture, land use patterns, and the presence of heavy industries are other socio-cultural factors contributing to air quality.
The absence of primary production sources of NO2 and SO2, such as burning fossil fuels, and other reduction initiatives taken by the Government, have a very significant impact on maintaining low levels of these pollutants.
Temperature and rainfall have significant impacts on the air quality of the Kota metropolis. Minimum concentration of pollutants was observed in the Rainy followed by Summer and Winter seasons. The range of AQI varies between the satisfactory to very poor category. EF was more than 1 for all monitoring stations for PM10 and PM2.5, exhibiting High pollution (H), 0.5-.09 exhibiting Moderate pollution (M) for NO2, while less than 0.5 for SO2 exhibits Low pollution (L). Human health risk assessment results reveal that cardiovascular and respiratory disease principally contributes to total mortality caused by particulate matter pollution.
Therefore, particulate matter pollution is a critical factor to be considered by the policymakers to ensure sustainability coupled with environmental concerns. Improving solid waste management, increasing green beltway, restricting open burning, planting some new species of plants in internal sources, prohibiting old vehicles, and shifting vehicles towards clean energy would be adequate to mitigate the effect of particulate matter on inhabitants.
Acknowledgements
We are grateful to CPCB and RSPCB for providing particulate matter data for the study.
Highly obliged towards University Departments, RTU, Kota (India), for providing financial support to this study.
Conflict of Interest
There is no conflict of interest between the authors.
Funding Sources
The authors are obliged for the financial support to perform this research work from University Departments, Rajasthan Technical University, Akelgarh-324010, Kota (India).
References
- Doreswamy, Harishkumar KS, Km Y, Gad I. Forecasting Air Pollution Particulate Matter (PM2.5) Using Machine Learning Regression Models. Procedia Comput Sci. 2020;171(2019):2057-2066. doi:10.1016/j.procs.2020.04.221
CrossRef - Power AL, Tennant RK, Jones RT, et al. Monitoring Impacts of Urbanisation and Industrialisation on Air Quality in the Anthropocene Using Urban Pond Sediments. Front Earth Sci. 2018;6(September):1-18. doi:10.3389/feart.2018.00131
CrossRef - Region & City PM2.5 Ranking. World Air Quality Report.; 2020. https://www.iqair.com/world-air-quality-report
- Initiative B, Pollution A. Articles The impact of air pollution on deaths, disease burden, and life expectancy across the states of India?: the Global Burden of Disease Study 2017. Published online 2019:26-39. doi:10.1016/S2542-5196(18)30261-4
CrossRef - Bahino J, Yoboué V, Galy-Lacaux C, et al. A pilot study of gaseous pollutants’ measurement (NO2, SO2, NH3, HNO3 and O3) in Abidjan, Côte d’Ivoire: Contribution to an overview of gaseous pollution in African cities. Atmos Chem Phys. 2018;18(7):5173-5198. doi:10.5194/acp-18-5173-2018
CrossRef - Zhu G, Guo Q, Xiao H, Chen T, Yang J. Multivariate statistical and lead isotopic analyses approach to identify heavy metal sources in topsoil from the industrial zone of Beijing Capital Iron and Steel Factory. Published online 2017. doi:10.1007/s11356-017-9055-9
CrossRef - Garg M, Goyal S, Bansal O. Effect of lockdown amid COVID-19 pandemic on air quality of most polluted cities of Punjab (India). J Earth Syst Sci. 2021;130(4):1157-1165. doi:10.1007/s12040-021-01713-z
CrossRef - Kuldeep, Sohil Sisodiya, and Anil K. Mathur (2022). Environmental Risk Assessment Ascribed to Particulate Matter for Kota City, Rajasthan (India). ECS Transactions, 107 (1) 543-559 (2022). https://iopscience.iop.org/article/10.1149/10701.0543ecst/pdf.
CrossRef - Tian Y, Jiang Y, Liu Q, et al. Temporal and spatial trends in air quality in Beijing. Landsc Urban Plan. 2019;185(January):35-43. doi:10.1016/j.landurbplan.2019.01.006
CrossRef - Tobías A, Carnerero C, Reche C, et al. Science of the Total Environment Changes in air quality during the lockdown in Barcelona ( Spain ) one month into the SARS-CoV-2 epidemic. Sci Total Environ. 2020;726:138540. doi:10.1016/j.scitotenv.2020.138540
CrossRef - Khaniabadi YO, Polosa R, Chuturkova RZ, et al. Human health risk assessment due to ambient PM10 and SO2 by an air quality modeling technique. Process Saf Environ Prot. 2017;111:346-354. doi:10.1016/j.psep.2017.07.018
CrossRef - kermani M, Arfaeinia H, Masroor K, et al. Health impacts and burden of disease attributed to long-term exposure to atmospheric PM10/PM2.5 in Karaj, Iran: effect of meteorological factors. Int J Environ Anal Chem. Published online 2020. doi:10.1080/03067319.2020.1807534
CrossRef - Manojkumar N, Srimuruganandam B. Health effects of particulate matter in major Indian cities. Int J Environ Health Res. 2021;31(3):258-270. doi:10.1080/09603123.2019.1651257
CrossRef - Afghan FR, Patidar SK. Health impacts assessment due to PM2.5, PM10 and NO2 exposure in National Capital Territory (NCT) Delhi. Pollution. 2020;6(1):115-126. doi:10.22059/POLL.2019.286454.662
- Markandeya, Verma PK, Mishra V, Singh NK, Shukla SP, Mohan D. Spatio-temporal assessment of ambient air quality, their health effects and improvement during COVID-19 lockdown in one of the most polluted cities of India. Environ Sci Pollut Res. 2021;28(9):10536-10551. doi:10.1007/s11356-020-11248-3
CrossRef - Goel A, Saxena P, Sonwani S, et al. Health benefits due to reduction in respirable particulates during covid-19 lockdown in india. Aerosol Air Qual Res. 2021;21(5):1-16. doi:10.4209/aaqr.200460
CrossRef - Rovira J, Domingo JL, Schuhmacher M. Air quality, health impacts and burden of disease due to air pollution (PM10, PM2.5, NO2 and O3): Application of AirQ+ model to the Camp de Tarragona County (Catalonia, Spain). Sci Total Environ. 2020;703(xxxx):135538. doi:10.1016/j.scitotenv.2019.135538
CrossRef - Kuldeep, Sisodiya S, Mathur AK, Verma P. Assessment of Urban Air Quality for Jodhpur City by the Air Quality Index (AQI) and Exceedance Factor (EF). In: Verma P, Samuel OD, Verma TN, Dwivedi G, eds. Advancement in Materials, Manufacturing and Energy Engineering, Vol. I. Springer Singapore; 2022:585-596.
CrossRef - Chen J, Wang B, Huang S, Song M. The influence of increased population density in China on air pollution. Sci Total Environ. 2020;735:139456. doi:10.1016/j.scitotenv.2020.139456
CrossRef - Shrivastava R, Neeta S, Geeta G. Air pollution due to road transportation in India: A review on assessment and reduction strategies. J Environ Res Dev. 2013;8(1):69-77.
CrossRef - Yu H, Russell A, Mulholland J, et al. Cross-comparison and evaluation of air pollution field estimation methods. Atmos Environ. 2018;179:49-60. doi:10.1016/j.atmosenv.2018.01.045
CrossRef - Chen TM, Gokhale J, Shofer S, Kuschner WG. Outdoor air pollution: Nitrogen dioxide, sulfur dioxide, and carbon monoxide health effects. Am J Med Sci. 2007;333(4):249-256. doi:10.1097/MAJ.0b013e31803b900f
CrossRef - Barone-Adesi F, Dent JE, Dajnak D, et al. Long-term exposure to primary traffic pollutants and lung function in children: Cross-sectional study and meta-analysis. PLoS One. 2015;10(11):1-16. doi:10.1371/journal.pone.0142565
CrossRef - Kuldeep, Sohil Sisodiya, and Anil K. Mathur. Noise Pollution Indices for Kota City, Rajasthan (India). Pollution Research 39 (November Supplementary Issue): S92-S100 (2020),
CrossRef - MSME-Development Institue. Brief Industrial Profile Of Kota District. Minist MSME, Gov India. Published online 2015:25. www.msmedijaipur.gov.in
CrossRef - Sarfraz M, Shehzad K, Shah SGM. The impact of COVID-19 as a necessary evil on air pollution in India during the lockdown. Environ Pollut. 2020;266:115080. doi:10.1016/j.envpol.2020.115080
CrossRef - Bhaskar BV, Mehta VM. Atmospheric particulate pollutants and their relationship with meteorology in Ahmedabad. Aerosol Air Qual Res. 2010;10(4):301-315. doi:10.4209/aaqr.2009.10.0069
CrossRef - CPCB. Revised National Ambient Air Quality Standards (NAAQS). 2009;826:1-18. https://cpcb.nic.in/upload/NAAQS_2019.pdf
CrossRef - Kuldeep, Sohil Sisodiya, Anil K. Mathur, Ali Zare, and Puneet Verma. Assessment and Spatial Distribution Mapping of Criteria Pollutants. Water Air Soil Pollution 233, 82 (2022).
CrossRef - Kumar, Porush; Kuldeep, kuldeep; Gautam N. An assessment of ambient air quality using AQI and exceedance factor for Udaipur City , Rajasthan ( India ). Weentech Proc Energy. 2021;7(December 2020):94-106.
CrossRef - Thi DO, Chi LAN, Toan VUDUC, Linh QHA, Chien VUVAN, Huyen VUTHU. RISK Assessment For PM10 And PM2.5 In Hanoi , Vietnam?: An Ecological Study. 2020;39(4):971-979.
- Kuldeep, Shivali Sen, Sohil Sisodiya, and Anil K. Mathur. Particulate Matter Associated Human Health Effects Determination through AirQ+ for Alwar, Rajasthan (India). ECS Transactions, 107 (1) 1073-1084 (2022). https://iopscience.iop.org/article/10.1149/10701.1073ecst/pdf
CrossRef - Ansari M, Ehrampoush MH. Meteorological Correlates and AirQ+ Health Risk Assessment of Ambient Fine Particulate Matter in Tehran, Iran. Vol 170. Elsevier Inc.; 2019. doi:10.1016/j.envres.2018.11.046
CrossRef - Biswal A, Singh T, Singh V, Ravindra K, Mor S. COVID-19 lockdown and its impact on tropospheric NO2 concentrations over India using satellite-based data. Heliyon. 2020;6(9):e04764. doi:10.1016/j.heliyon.2020.e04764
CrossRef - Chauhan A, Singh RP. Effect of lockdown on hcho and trace gases over India during March 2020. Aerosol Air Qual Res. 2021;21(4):1-19. doi:10.4209/aaqr.2020.07.0445
CrossRef - Rai PK. Multifaceted health impacts of Particulate Matter ( PM ) and its management?: An overview. Environ Skept Critics. 2015;4(1):1-26.
- Al-Thani H, Koç M, Isaifan RJ. A review on the direct effect of particulate atmospheric pollution on materials and its mitigation for sustainable cities and societies. Environ Sci Pollut Res. 2018;25(28):27839-27857. doi:10.1007/s11356-018-2952-8
CrossRef - Guttikunda SK, Nishadh KA, Jawahar P. Air pollution knowledge assessments (APnA) for 20 Indian cities. Urban Clim. 2019;27(August 2018):124-141. doi:10.1016/j.uclim.2018.11.005
CrossRef - de Jesus AL, Thompson H, Knibbs LD, et al. Two decades of trends in urban particulate matter concentrations across Australia. Environ Res. 2020;190(July):110021. doi:10.1016/j.envres.2020.110021
CrossRef - Guttikunda SK, Goel R. Health impacts of particulate pollution in a megacity-Delhi, India. Environ Dev. 2013;6(1):8-20. doi:10.1016/j.envdev.2012.12.002
CrossRef - Kundu A, Chatterjee S, Dutta D, Siddiqui AR. Meteorological trend analysis in Western Rajasthan (India) using geographical information system and statistical techniques. J Environ Earth Sci. 2015;5(5):90-100.
CrossRef - Bao R, Zhang A. Science of the Total Environment Does lockdown reduce air pollution?? Evidence from 44 cities in northern China. Sci Total Environ. 2020;731(1954):139052. doi:10.1016/j.scitotenv.2020.139052
CrossRef - Pathakoti M, Muppalla A, Hazra S, et al. Measurement report: An assessment of the impact of a nationwide lockdown on air pollution - A remote sensing perspective over India. Atmos Chem Phys. 2021;21(11):9047-9064. doi:10.5194/acp-21-9047-2021
CrossRef - Bassim Mohammed Hashim, Saadi K. Al-Naseri , Ali Al-Maliki NA-A. Bassim Mohammed Hashim.pdf. Impact COVID-19 lockdown NO2, O3, PM25 PM10 Conc Assess air Qual Chang Baghdad, Iraq. Published online
CrossRef


