Assessment of Water Quality Index and Non-Carcinogenic Risk for Ingestion of Nitrate for Drinking Purpose of Bhosga Reservoir, Karnataka, India
Shwetha Sarikar
*
 and Katepaga Vijaykumar
1
Department of Post Graduate Studies and Research in Zoology,
Gulbarga University,
Kalaburagi,
Karnataka
India
http://dx.doi.org/10.12944/CWE.17.2.18
Copy the following to cite this article:
Sarikar S, Vijaykumar K. Assessment of Water Quality Index and Non-Carcinogenic Risk for Ingestion of Nitrate for Drinking Purpose of Bhosga Reservoir, Karnataka, India. Curr World Environ 2022;17(2). DOI:http://dx.doi.org/10.12944/CWE.17.2.18
Copy the following to cite this URL:
Sarikar S, Vijaykumar K. Assessment of Water Quality Index and Non-Carcinogenic Risk for Ingestion of Nitrate for Drinking Purpose of Bhosga Reservoir, Karnataka, India. Curr World Environ 2022;17(2).
Download article (pdf)
Citation Manager
Publish History

Introduction
Water is widely regarded as a crucial and valued natural resource upon which every living being on our planet rely1. Reservoirs are recognized as ecological barometers of the city’s health because they maintain the micro-climate of any urban center, influencing the lives of those who live, particularly in semi-arid regions2. Aside from environmental factors, including rainfall, sedimentary rock, erosion, etc., anthropogenic variables such as urbanization, industries, and agricultural practices affect water quality3. Their delicate ecosystem must balance environmental stability with their surroundings, especially in the context of human encroachment and pollution4. The principal causes contributing to the degradation of reservoir conditions can be classified into two categories: (a) contaminants that originate from fixed point sources (pollutants through industrial wastes and water runoff). (b) pollutants arriving from non-point sources (nutrients from fertilizers, harmful pesticides from agricultural runoff, and human habitation spread across the reservoirs periphery5.
A water quality index (WQI) is a unique numeral which reveals the status of water by combining multiple water parameters like total hardness, dissolved oxygen, sulfate, and nitrate6. Further it simplifies and expresses logical data by reducing the collective data of various water parameters to a single value7. Water quality evaluation gives detailed information regarding water resources as well as the risk of contamination for various uses like drinking, irrigation, and fishing8,9. The application of the WQI is a valuable technique for evaluating reservoir water quality. It helps to recognize the general condition of individual water quality for domestic use10. In 1965, Horton proposed the concept of representing water quality status for the first time and then formulated numerous water quality indices that can quickly and accurately determine the total water quality of a region. Later, Brown introduced general WQI in 1970, which has undergone a more advanced modification that is better suited for a different purpose11. Many workers like Abukila (2015)12, Ameen (2019)1, Aigberua et al., (2020)13, Belokda et al., (2020)14, Uddin et al., (2020)15, Mohammed et al., (2021)16 worked on WQI of freshwaters. Similarly in India, Ravikumar et al., (2013)4, Kangabam et.al., (2017)17, Sharma and Tiwari (2018)18, Gupta et al., (2020)19, Roy et al., (2021)20, Dutt and Sharma (2022)21 conducted research on the WQI of rivers and lakes. An evaluation of the health risks associated with a supply of drinking water can show a connection between source of pollution and human health22. By statistically defining health concerns, it can provide an essential decision-making framework for the management and preservation of water supplies23. High nitrate intake from water will limit the body's ability to transport oxygen, which may cause multiple sclerosis and stomach cancer24. So far, no work on a classification study based on the WQI scores and non-carcinogenic risk for ingestion of nitrate from Bhosga reservoir has been reported.
Many countries face acute water scarcity, while water quality problems also exist for human consumption.Available water quality must be examined, which is especially important in semi-arid regions like Kalaburagi, Karnataka, which is characterized by spatially and temporally irregular rainfall, high evaporation, and transpiration. As a result, monitoring water quality is earnest in this area. The rationale behind the study is to use physicochemical parameters to determine the quality status and non-carcinogenic risk for ingestion of nitrate in the Bhosga reservoir, which lies in the semi-arid region, as people living around the reservoir make use of it for drinking. This research aids in the inspection of water quality as well as periodic monitoring to reduce human activity in this area.
Materials and methods
Study area
Bhosga reservoir is a perennial water body in the Kalaburagi district and is located on the outskirts, nearly 10 km away from the Kalaburagi city. Kalaburagi, which falls under 16°-12" to 17°- 46" latitude and 76°- 46" to 77°- 42" longitude, is located 454 meters above mean sea level (MSL). The total catchment area of the reservoir is 756 km2, and its eastern boundary is with a bund of about 10.66 meters in height, with the facility for overflow of excess water at one extremity. In contrast, the remaining edges are marked by the presence of agricultural fields (Fig. 1).
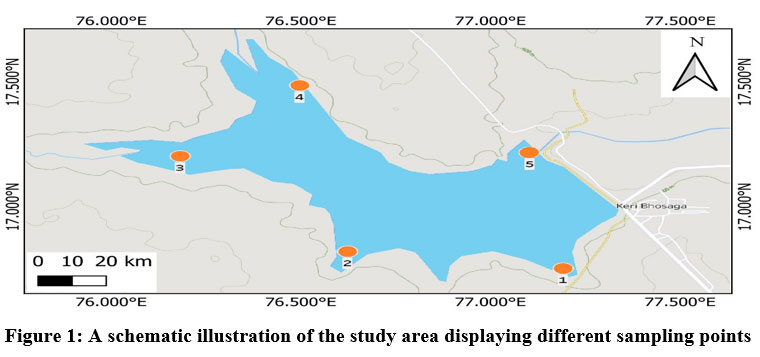 | Figure 1: A schematic illustration of the study area displaying different sampling points.
|
Data collection
Sample water were gathered from five sampling points in reservoir over a year, from October 2020 to September 2021, in pre-monsoon (PRM), post-monsoon (POM), and monsoon (MON) seasons. Site 1 & site 2 were situated near the village which is greatly affected by anthropogenic activities. Site 3 & site 4 were located near the agricultural field affected by agricultural runoff. Site 5 was outlet of the reservoir. In this study, ten physicochemical parameters were determined, namely electrical conductivity (EC), chloride (Cl-), pH, total hardness (TH), total alkalinity (TA), phosphate (PO43-), dissolved oxygen (DO), nitrate (NO3-), total dissolved solids (TDS), and sulfate (SO42-) to evaluate the entire WQI of Bhosga reservoir. Parameters such as pH, TDS, and EC have been deliberated on site with the aid of a pen-type digital meter. To estimate the dissolved oxygen, fixatives have been added to the samples at sites and examined by Winkler’s technique. The titration method was used to determine total alkalinity, chloride, and total hardness. The UV-visible spectrophotometer was used to analyze parameters such as phosphate, sulfate, and nitrate. Parameters were analyzed using standard techniques suggested by Trivedy and Goel25 and APHA26.
Water quality index calculation
The Weighted Arithmetic Index technique was utilized to deliberate WQI27,28, with the equation below Eq. (1):
.jpg)
Here, Qi refers to the rating quality of an ith parameter, & Wi is the unit weight of an ith quality of water parameter as shown in Eq. (2):
.jpg)
Where Vi denotes the actual amount of an ith water quality parameter, V0 represents the model value of water parameters (Vi =7) and DO (Vi =14.6), which is taken by Bora and Goswami8, Si indicates an ideal result of an ith parameter.
The equation utilized for evaluating unit weight (Wi) of each water quality Eq. (3):
.jpg)
Where Wi denotes unit weight that was assigned according to the formula adopted by Lkr et al.11 is presented in (Table 3), K represents the proportionality constant, which is calculated with the below Eq. (4):
.jpg)
Results from WQI ratings were then divided into five groups to assess water quality status (WQS)29, as indicated in (Table 1).
Health risk assessment
While pollutants could be reason for health issues even if it is under permitted limits for consumption, a health risk assessment is a crucial step in a comprehensive water quality assessment30. As per the International Agency for Research on Cancer (IARC), nitrate is non-carcinogenic agent. The USEPA-recommended method was employed in this analysis to estimate the potential health risk connected to nitrate exposure31. Since all other exposure pathways, including inhalation and dermal absorption, were insignificant, the drinking water ingestion pathway was regarded as the most notable source of exposure32. In the current study oral intake was taken into account for evaluating risk assessment.
The following equation can be used to determine the risk to human health
.jpg)
Where C signifies nitrate content within water (mg/L), IR values reported in the study are 2.2 and 0.95 L/day for adults and children, correspondingly. The exposure of duration (ED) is 6 years and 30 years, respectively. Exposure of frequency (EF) is set at 365 days per year (EF), AW stands for average body weight, which is 67.5 kg for adults and 16.5 kg for children. Average exposure time (AT) is expressed in days as 10,950 for adults and 2190 for children. HQ is the Hazardous quotient, and Rfd represents referral dosage value33. Hazardous quotient is classified into three categories based on standard values as follows, risk is considered acceptable if HQ < 1, intolerable if HQ > 1, and a higher HQ denotes a greater risk30.
Multivariate analysis
A correlation investigation is a statistical method utilized that represents the connection between two variables. Correlation coefficient values nearer to +1 or -1 specify the probability of a linear relationship amongst x and y variables19. A correlation was executed on MS Excel. The principal component analysis is a technique for reducing data and extracting a limited number of apparent elements for the purpose of analyzing correlations between observed variables and assessing variations and potential sources of physicochemical parameters in a reservoir15. Cluster analysis was used to predict element classification from multiple sources based on chemical similarities. Dendrograms are commonly used to illustrate hierarchical clustering because of intuitive resemblance associations amongst one sample & whole dataset. It aids into data interpretation of actual summary of the clustering system reveals an image of groups & their affection with an incredible decrease in an aspect of original data19. Principal Component Analysis (PCA) & Cluster Analysis (CA) and were executed on PAST- 4.03.
Results and discussion
Parameters of Water quality
A statistical overview of the selected parameters of water quality by five sample sites of Bhosga reservoir during POM, PRM, and MON seasons is presented in (Table 2). Electrical conductivity (EC) is significant because cations have an enormous impact on taste and therefore, on the high acceptance of drinking water. This is an indirect indicator of the total dissolved solids. Weathering of sedimentary rocks with anthropogenic sources is most likely the cause of increased conductivity34. The concentration of EC fluctuated between 248.8 to 315 µS/cm. In POM season, minimum EC mean values of the Bhosga reservoir were 275.12±15.15 µS/cm. Maximum mean values were 294.02±6.19 µS/cm in the PRM season due to high anthropogenic actions like household agricultural and waste runoff. The reported values were all below 350 µS/cm as per BIS35 standards. Similar observations were discovered by Toufeek et al., (2009)36 in Nasser lake values ranged from 216 to 260 µS/cm at different locations.
Table 1: WQI value, status and use of water sample29
WQI value | Water quality status (WQS) | Possible utilization |
0-25 | Excellent | Potable, irrigation and industrial purpose |
26-50 | Good | Potable, irrigation and industrial purpose |
51-75 | Poor | Irrigation and industrial |
76-100 | Very poor | Irrigation |
Above 100 | Not suitable | Appropriate treatment essential prior usage |
Table 2: Statistical analysis for parameters of water quality of Bhosga reservoir.
Parameters | Post-monsoon (POM) | Value | Pre-monsoon (PRM) | Value | Monsoon (MON) | Value |
EC (µS/cm) | 275.12±15.15 | (248.8-287.5) | 294.02±6.19 | (287-300.8) | 292.52±22.0 | (258.5-315) |
Cl- (mg/l) | 36.63±2.07 | (34.5-38.9) | 72.12±5.82 | (63.7-79.6) | 50.08±2.17 | (48.56-53.89) |
pH | 7.57±0.11 | (7.43-7.7) | 7.69±0.06 | (7.63-7.8) | 7.62±0.10 | (7.45-7.73) |
TH (mg/l) | 181.38±6.21 | (174.8-190.6) | 218.84±12.31 | (201.1-231.4) | 194.61±2.97 | (192.6-199.8) |
TA (mg/l) | 104.56±4.11 | (100.4-109.9) | 143.12±8.71 | (132.5-154.9) | 122.48±4.00 | (117.8-127.2) |
PO43- (mg/l) | 2.03±0.13 | (1.9-2.2) | 1.95±0.20 | (1.7-2.19) | 1.78±0.09 | (1.62-1.84) |
DO (mg/l) | 9.23±0.479 | (8.82-10.05) | 9.10±0.652 | (8.32-10.1) | 7.89±0.52 | (7.24-8.56) |
NO3- (mg/l) | 1.84±0.135 | (1.7-2.02) | 2.00±0.17 | (1.75-2.18) | 1.82±0.07 | (1.74.1.95) |
TDS (mg/l) | 153.16±5.32 | (145-158.3) | 154.6±13.45 | (138.8-175.8) | 144.96±8.42 | (138-159.5) |
SO42- (mg/l) | 4.34±0.10 | (4.23-4.5) | 4.25±0.25 | (3.96-4.59) | 4.05±0.24 | (3.65-4.32) |
Values have been given into Mean ± SD and the parameters are determined in mg/l with exception of Electrical conductivity (EC), Chloride (Cl-), pH, Total hardness (TH), Total alkalinity (TA), Phosphate (PO43-), Dissolved oxygen (DO), Nitrate (NO3-), Total dissolved solids (TDS), and Sulfate (SO42-).
Chloride (Cl-) is one of the vital indicators of pollution. The major anthropogenic sources of chloride in surface water are agricultural runoff and effluent from sewage water37. Cl- values fall between 34.5 and 79.6 mg/l. The mean Cl- concentration for the studied water sample was recorded at the lowest during the POM season at 36.63±2.07 mg/l and highest mean value of 72.12±5.82 mg/l at PRM season. Same trend of higher Cl- in PRM season was observed by Majagi et al., (2008)38 in the Karanja reservoir. It was determined that the chloride concentration of samples was far lesser permitted range of 250 mg/l by BIS35 standards. pH of water indicates the gradation of alkalinity or acidity in the solution. pH is critical indicator which could be utilized to assess water quality as well as water pollution levels1. The pH of Bhosga reservoir from five sampling sites ranges from 7.43 to 7.8, indicating that the water in Bhosga reservoir is almost neutral to alkaline. The lowest average value was found to be 7.57±0.11 in the POM season. The highest average value was found to be 7.69±0.06 in the PRM season, which could be attributed to increased evaporation rates combined with human interference, which is partly due to increased photosynthetic activity by proliferating algae38. The mean pH values were within the BIS35 prescribed range. In this research, a limited range in pH is found throughout the seasons due to a modest yearly change in free carbon dioxide. Upadhyay and Chandrakala (2016)39 reported studies on physicochemical parameters of Dalvoy lake and observed maximum range of pH was 7.5 with a minimum pH range of 7.7 at different sites. The total hardness (TH) of water is because of presence of various ions of calcium and magnesium40. The concentration of hardness ranging from 174.8 to 231.4 mg/l. The contents were relatively low at 181.38±6.21 mg/l in the POM season and higher at 218.84±12.3 mg/l in PRM season. This may be due to a reduction in water size as the amount of evaporation increases41. A similar trend was investigated by Bora and Goswami (2017)8 recorded in Kolong river with maximum value of 296 mg/l and a minimum of 52 mg/l. Total alkalinity (TA) is primarily determined by carbonate hydroxide content & includes contributions from phosphate, silicates, & other bases42. TA of Bhosga reservoir values was found to range between 100.4 to 154.9 mg/l. The lowest TA mean values were recorded at 104.56±4.11 mg/l during the POM season. Maximum average values were recorded at 143.12±8.71 mg/l during the PRM season, which is probably because of the existence of surplus free CO2 resulting from the decomposition procedure in conjugation along with a mixture of domestic waste43. The values were under permitted limits of 200 mg/l as recommended by BIS35. This observation is in conformity with the observations of Yadav et al., (2015)44 values ranged from 175 to 200 mg/l in the Pahuj river.
Phosphate (PO43-) is essential for organisms growth as well as nutrients that limit primary production of the ecosystem. Phosphate is present in a low concentration, which acts as a high nutrient that contributes to algal blooms45. PO43- value varies from 1.62 to 2.2 mg/l. The lowest mean values were reported at 1.78±0.09 mg/l in MON season, & maximal average value was 2.03±0.13 mg/l at POM season. As per BIS35, all observed readings were under the acceptable range of 5 mg/l. These concentrations are in conformity with the observation of Sharma and Tiwari (2018)18 in Nachiketa lake value ranging by 0.05 to 0.10 mg/l. Dissolved oxygen (DO) is critical in all aquatic ecosystems because it regulates organism metabolic processes. The primary sources of dissolved oxygen in water are oxygen diffusion and photosynthetic activity, primarily affected by temperature, total dissolved salt, and water movement44. The DO value varies from 7.24 to 10.05 mg/l. Least mean values were noted at 7.89±0.52 mg/l in the MON season because of water dilution caused by rainwater addition46. The highest mean values were observed at 9.23±0.47 mg/l in the POM season because cold water holds more dissolved oxygen than warm water. Many factors influence dissolved oxygen levels, including temperature, microbial population, pressure, and sampling time17. The turbulent behavior of water sources, a decrease in temperature, and photosynthesis can lead to an increase in DO47. The results align with results of Lkr et al., (2020)11 the DO values ranging from 7.37 to 9.44 mg/l in Doyang river.
High nitrate (NO3-) levels detect deterioration in water quality caused by wastewater discharged into lakes. Nitrate is the most abundant form of inorganic nitrogen incorporated into freshwater because it is highly oxidized. Nitrate concentrations in freshwater appear to rise due to fertilizers, manures, and sewage contamination44. The NO3- of the Bhosga reservoir from five sampling sites ranges from 1.74 to 2.18 mg/l. Observed mean values of nitrate had been observed at a minimum of 1.82±0.07 mg/l in MON season, & maximal average value of 2.00±0.17 mg/l during the PRM season, primarily because of agricultural activity, including the use of inorganic nitrogen fertilizers and manures17. The nitrate values in all water samples are far below the allowable range of 45 mg/l by BIS35. Such observation also reported by Ameen (2019)1 value varing from 2.18 to 3.17 mg/l. Concentration of TDS in water specifies degree of mineralization. The solids dissolved in water come from natural sources and vary depending on region, rainfall, and inflowing water37. TDS value ranges from 138 to 175.8 mg/l. The MON season recorded minimum average values of 144.96±8.42 mg/l, and maximum average values were observed at 154.6±13.45 mg/l at PRM season. The result observed was under the permitted range of 500 mg/l as per BIS35. Gupta et al., (2017)49 recorded the minimum value of 108 mg/l & maximal value of 234 mg/l in the Narmada river.
Sulfate (SO42-) is present in high amounts in all natural waters, especially with high salt content. Sulfate is another essential chemical parameter used to evaluate the odor and taste of potable water47. SO42- values fluctuated between 3.65 to 4.5 mg/l. The lowest mean concentration of sulfate observed was 4.05±0.24 mg/l in MON season, and maximum value observed was 4.34±0.10 mg/l in POM season. Observed values were under permissible limits as per BIS35 standards 150 mg/l. The same trend of values was recorded by Solanki and Saraswat (2021)50 values ranging between 3.3 to 9.3 mg/l in Narmada river. Each of ten parameters of analyzed water were under allowable range of drinking water specified by BIS35 standards.
Water Quality Index (WQI)
WQI deliberated using the ‘Weighted Arithmetic Index’ technique, which involves estimating unit weight responsible for each of the designated physicochemical parameters. The optimum unit weight is assigned to pH 0.208 and DO 0.3536, thus indicating the importance of such two parameters in the quality of water assessment & its substantial effect upon index. The recorded values of selected physicochemical parameters of all the five sampling points of every season & corresponding WQI values are indicated in (Table 4; Fig. 2). The seasonal shifts in WQI were shown to be positively correlated. All five locations reported their highest WQI values during the MON season, following PRM and POM seasons. Identical observations have been made by researchers like Lkr et al.11, Bora and Goswami8. These findings suggest that water quality from all five sampling sites comes within category of Samples of good water (25appropriate to industrial, potable, and irrigation purpose (Table 1). The current work reveals that the values of sites 3 and 4 experience a sharp increase in values nearer to >50 due to slight anthropogenic activities and agricultural runoff in the MON season. Out of the ten parameters considered for this study, WQI values of pH and DO have an effect due to an increase in pH and a decrease in DO concentration, as revealed by the statistical analysis of WQI.
Table 3: The weights (Wi) of parameters utilized in WQI deliberation.
Parameters | BIS standards (Si) | Unit weight (Wi) |
EC | 300 | 0.00589 |
Cl- | 250 | 0.00707 |
pH | 6.5-8.5 | 0.208 |
TH | 300 | 0.00589 |
TA | 120 | 0.01473 |
PO43- | 5 | 0.35361 |
DO | 5 | 0.35361 |
NO3- | 45 | 0.03929 |
TDS | 500 | 0.00354 |
SO42- | 150 | 0.01179 |
| ?Wi= 1.000 | ||
Table 4: Overall of WQI of Bhosga reservoir with status of water quality.
Study sites | POM | PRM | MON | |||
WQI | WQS | WQI | WQS | WQI | WQS | |
S1 | 44.7 | Good | 46.7 | Good | 47.1 | Good |
S2 | 44.0 | Good | 46.1 | Good | 48.3 | Good |
S3 | 44.9 | Good | 46.8 | Good | 49.3 | Good |
S4 | 45.4 | Good | 47.4 | Good | 49.8 | Good |
S5 | 39.5 | Good | 43.4 | Good | 46.2 | Good |
S1-Site 1, S2-Site 2, S3-Site 3, S4-Site 4 and S5-Site 5; POM- Post-monsoon, PRM-Pre-monsoon and MON-Monsoon season.
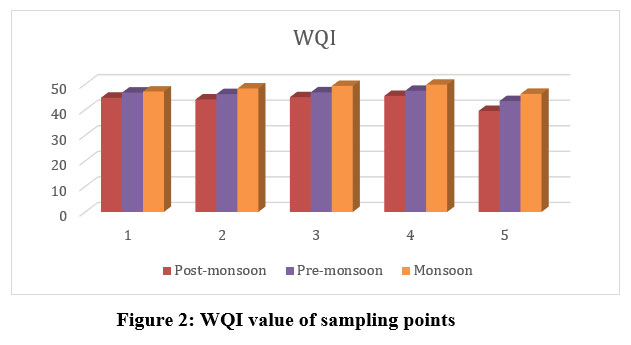 | Figure 2: WQI value of sampling points.
|
Health risk assessment
High nitrate intake from water will limit the body's ability to transport oxygen, which may cause methemoglobinemia, multiple sclerosis, thyroid gland hypertrophy, and stomach cancer24. The USEPA human health risk assessment methodology was used to determine the potential health impacts of nitrate intake for both adults and children30,32. According to the study findings, the seasonal HQ values for adults and children were ranging from 0.035 to 0.044 and 0.061 to 0.078, correspondingly. Seasonal HQ average results for adult and children were ranging between 0.036 to 0.040 and 0.065 to 0.071, respectively as shown in (Table 5). Compared to adults, children are more susceptible to environmental health problems. As the HQ results for both adults and children were below 1, indicating neither adults nor children had any negative effects.
Table 5: Seasonal non-carcinogenic health risks value of nitrate intake for adults and children.
Sampling sites | POM | PRM | MON | |||
Adult | Children | Adult | Children | Adult | Children | |
S1 | 0.036 | 0.064 | 0.038 | 0.068 | 0.036 | 0.064 |
S2 | 0.039 | 0.069 | 0.043 | 0.077 | 0.037 | 0.065 |
S3 | 0.035 | 0.062 | 0.041 | 0.073 | 0.036 | 0.065 |
S4 | 0.034 | 0.061 | 0.035 | 0.062 | 0.035 | 0.062 |
S5 | 0.041 | 0.072 | 0.044 | 0.078 | 0.039 | 0.070 |
Average | 0.037 | 0.065 | 0.040 | 0.071 | 0.036 | 0.065 |
S1-Site 1, S2-Site 2, S3-Site 3, S4-Site 4 and S5-Site 5; POM- Post-monsoon, PRM-Pre-monsoon and MON-Monsoon season.
Correlation
Correlation analysis was used in this work to determine the relationship between each pairing of physicochemical parameters of the Bhosga reservoir52. The physicochemical relationships among the various parameter (Table 6) show higher (>0.7), moderate (0.5-0.7), and lower (0.3-0.5) resemblance. Dissolved oxygen correlates highly with phosphate, sulfate and nitrate. pH and electrical conductivity exhibit a high resemblance. Total hardness is highly correlated with chloride, and total alkalinity. Phosphate and sulfate are positively correlated with nitrate. There are some less correlated ions, and the remaining several correlation cases are negative. The sulfate, phosphate, and nitrate are most likely derived from agricultural runoff. Total alkalinity, total hardness, and chloride may be caused by anthropogenic activities.
Table 6: Correlation of physico-chemical parameters of Bhosga reservoir.
| pH | EC | TDS | DO | TH | TA | Cl- | PO43- | SO42- | NO3- |
pH | 1 |
|
|
|
|
|
|
|
|
|
EC | 0.732* | 1 |
|
|
|
|
|
|
|
|
TDS | -0.092 | 0.337*** | 1 |
|
|
|
|
|
|
|
DO | -0.982 | -0.803 | 0.007 | 1 |
|
|
|
|
|
|
TH | 0.441*** | -0.258 | -0.749 | -0.34 | 1 |
|
|
|
|
|
TA | 0.026 | -0.458 | -0.976 | 0.09 | 0.768* | 1 |
|
|
|
|
Cl- | 0.051 | -0.576 | -0.845 | 0.037 | 0.911* | 0.87* | 1 |
|
|
|
PO43- | -0.78 | -0.84 | 0.007 | 0.751* | -0.009 | 0.044 | 0.321*** | 1 |
|
|
SO42- | -0.952 | -0.619 | 0.079 | 0.96* | -0.523 | 0.001 | -0.167 | 0.561** | 1 |
|
NO3- | -0.92 | -0.793 | 0.18 | 0.888* | -0.291 | -0.111 | 0.063 | 0.946* | 0.767* | 1 |
*High loading (0.7); **Moderate (0.5-0.7); ***weak loading (0.3-0.5)
Principal component analysis
Principal component analysis is a tool for investigation and description that seeks to pinpoint the essential components affecting the chemical composition of water53. PCA revealed two significant components with an eigenvalue of >1 and accounting for 90.60% of the total variance. PC1, which accounts for 52.03% of total variance, is constrained by inputs accompanying with agricultural runoff. It is categorized by high positive loadings for DO, PO43-, SO42-, NO3-, moderate loading with TDS, and negative loading with EC. PC2 explains 38.57% of the total variance has higher loadings for TA, TH, and Cl-, with moderate loading for pH. This component demonstrates the impact of anthropogenic activities (Fig. 3).
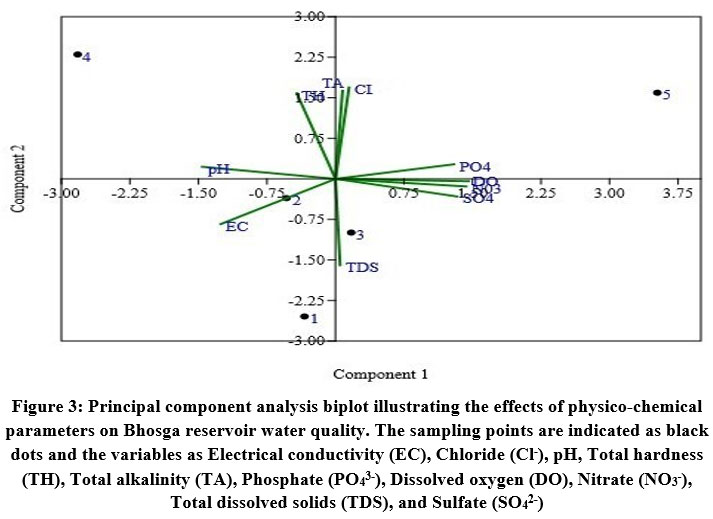 | Figure 3: Principal component analysis biplot illustrating the effects of physico-chemical parameters on Bhosga reservoir water quality. The sampling points are indicated as black dots and the variables as Electrical conductivity (EC), Chloride (Cl-), pH, Total hardness (TH), Total alkalinity (TA), Phosphate (PO43-), Dissolved oxygen (DO), Nitrate (NO3-), Total dissolved solids (TDS), and Sulfate (SO42-).
|
Cluster analysis
Cluster analysis is a classification method intended to produce a collection of clusters in which objects are related to one another and are unique from those belonging to other clusters54. For datasets analyzed for sampling points, cluster analysis (CA) has two main clusters. The five sampling points, signified with five sampling sites for reservoir water, are separated into two main clusters. The first cluster consists of three sampling points 1, 2, and 3 contaminated due to anthropogenic activities. Cluster two consists of two sampling points 4 and 5 contaminated due to agricultural runoff (Fig. 4)
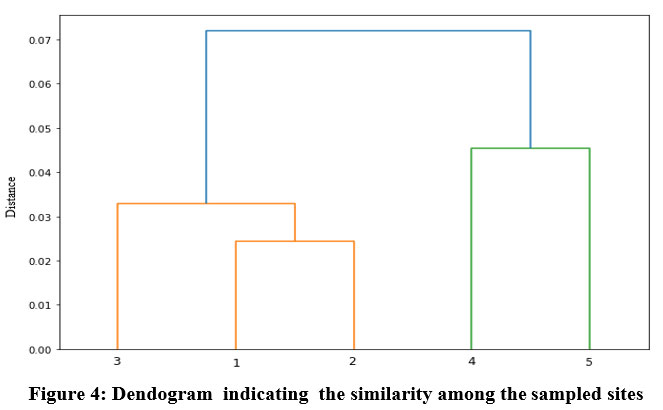 | Figure 4: Dendogram indicating the similarity among the sampled sites.
|
Conclusion
The water quality index method and non-carcinogenic risk assessment model for nitrate ingestion, which was utilized for assessing the appropriateness and health status of Bhosga reservoir for drinking purposes, revealed that Bhosga reservoir water fits into the good water category and does not pose any health issue regarding nitrate intake. The current analysis was conducted to evaluate the quality of the Bhosga reservoir using a variety of physicochemical parameters. The water samples were observed as appropriate for drinking purposes, and contamination levels were within the allowable range set by BIS standards. According to the observations, WQI values and non-carcinogenic risk for nitrate ingestion of all five selected sampling sites were in desirable water quality positions & HQ results for both adults and children were below 1 throughout POM, PRM, & MON seasons in all five sites chosen from Bhosga reservoir, indicating neither adults nor children had any negative effect. In the current study, pH and DO were found to have a significant impact on the reservoirs WQI. Presently, it does not show any significant threat to various domestic uses. As a result, it suggested a regular physical treatment, like filtering of reservoir water, be employed to minimize the load of nutrients and provide a good qualitative supply of water to residents of this area.
Acknowledgment
The authors would like to express gratitude to the Gulbarga University, Kalaburagi for the financial support and for providing laboratory facilities for undertaking the present work.
Funding Sources
The authors declare that no funds, grants, or other support were received during the preparation of this manuscript.
Conflict of Interest
The authors declare no conflict of interests.
References
- Ameen H. A. Spring water quality assessment using water quality index in villages of Barwari Bala, Duhok, Kurdistan Region, Iraq. Appl Water Sci 2019;(8)1-12. https://doi.org/10.1007/s13201-019-1080-z
CrossRef - Xu F, Li P, Du Q, Yang Y, Yue B. Seasonal Hydrochemical characteristics, Geochemical evolution, and pollution sources of lake Sha in an arid and semiarid region of Northwest China. Expos Health 2022;1-14. https://doi.org/10.1007/s12403-022-00488-y
CrossRef - Nsabimana A, Wu J, Wu J, Xu F. Forecasting groundwater quality using automatic exponential smoothing model (AESM) in Xianyang City, China. Hum. Ecol. Risk Assess 2022;1-22. https://doi.org/10.1080/10807039.2022.2087176
CrossRef - Ravikumar P, Aneesul Mehmood M, Somashekar R. K. Water quality index to determine the surface water quality of Sankey tank and Mallathahalli lake, Bangalore urban district, Karnataka, India. Appl Water Sci 2013;3(1)247-261. https://doi.org/ 10.1007/s13201-013-0077-2
- Semiromi F. B, Hassani A. H, Torabian A, Karbassi A. R, Lotfi F. H. Water quality index development using fuzzy logic: A case study of the Karoon River of Iran. Afr J Biotechnol 2011;10(50)10125-10133. https://doi.org/10.5897/AJB11.1608
- Uddin M. G, Nash S, Olbert A. I. A review of water quality index models and their use for assessing surface water quality. Ecol Indic 2021;(122)1-21. https://doi.org/10.1016/j.ecolind.2020.107218
- Abbasi S. A. Water Quality Indices. Elsevier, Amsterdam. 2012;1-357.
- Bora M, Goswami D. C. Water quality assessment in terms of water quality index (WQI): case study of the Kolong River, Assam, India. Appl Water Sci 2017;7(6)3125-3135. https://doi.org/10.1007/s13201-016-0451-y
- Tiwari M. H, Tiwari P. Assessment of water quality status and zooplanktons of river Bhagirathi in Uttarkashi. J Water and Environmental Nanotechnology 2020;5(1)92-101. https://dx.doi.org/10.22090/jwent.2020.01.008
- Khandare H. W, Ramteke S. Y, Yenkie R. O. Groundwater quality assessment using water quality index in Mendki and surrounding area of Bhramapuri taluka of Chandrapur district, Maharashtra, India. Int J Innov Res Sci Eng Technol 2020;9(5)2863-2870.
- Lkr A, Singh M. R, Puro N. Assessment of water quality status of Doyang river, Nagaland, India, using water quality index. Appl Water Sci 2020;10(1)1-13. https://doi.org/10.1007/s13201-019-1133-3
- Abukila A, F. Assessing the drain estuaries water quality in response to pollution abatement. Water Sci 2015;29(1)1-18. https://doi.org/10.1016/j.wsj.2015.02.002
- Aigberua A, Tarawou T, Erepamowei Y. Environmental assessment of Imiringi River in South-South Nigeria: the water quality index approach. Curr World Environ 2020;15(1):59. https://doi.org/10.12944/CWE.15.1.09
- Belokda W, Damsiri Z, Natij L, Khalil K, Loudiki M, Dahbi A, Elkalay K (2020) Assessment of physico-chemical parameters of freshwater in the Sidi Abderrahmane reservoir, Safi, Morocco. African J Aquat Sci 2020;45(3):259-268. https://doi.org/10.2989/16085914.2019.1692777
- Uddin M. R, Hossain M. M, Akter S, Ali M. E, Ahsan M. A. Assessment of some physicochemical parameters and determining the corrosive characteristics of the Karnaphuli estuarine water, Chittagong, Bangladesh. Water Sci 2020;34(1)164-180. https://doi.org/10.1080/11104929.2020.1803662
- Mohammed S, Nyade P. K, Abdul-Hamid M, Hodgson I. O. A. Water quality indicators of the Nima Creek, and potential for sustainable urban agriculture in Ghana. Water Sci 2021;35(1):39-48. https://doi.org/10.1080/11104929.2021.1883321
- Kangabam D. R, Bhoominathan S. D, Kanagaraj S, Govindaraju M. Development of a water quality index (WQI) for the Loktak Lake in India. Appl Water Sci 2017;7(6)2907-2918. https://doi.org/10.1007/s13201-017-0579-4
- Sharma R. C, Tiwari V. Seasonal physico-chemical characterization of water of sacred lake Nachiketa Tal, Garhwal Himalaya. Appl Water Sci 2018;8(6):1-9. https://doi.org/10.1007/s13201-018-0802-y
- Gupta D, Shukla R, Barya M. P, Singh G, Mishra V. K. Water quality assessment of Narmada River along the different topographical regions of the central India. Water Sci 2020;34(1)202-212. https://doi.org/10.1080/11104929.2020.1839345
- Roy M, Shamim F, Chatterjee S. Evaluation of Physicochemical and Biological Parameters on the Water Quality of Shilabati River, West Bengal, India. Water Sci 2021;35(1):71-81. https://doi.org/10.1080/23570008.2021.1928902
- Dutt V, Sharma N. Potable water quality assessment of traditionally used springs in a hilly town of Bhaderwah, Jammu and Kashmir, India. Environ Monit and Assess 2022;194(1):1-20. https://doi.org/10.1007/s10661-021-09591-0
- Ji Y, Wu J, Wang Y, Elumalai V, Subramani T. Seasonal variation of drinking water quality and human health risk assessment in Hancheng City of Guanzhong Plain, China. Expos health 2020;12(3)469-485. https://doi.org/10.1007/s12403-020-00357-6
- Yin Z, Duan R, Li P, Li W. Water quality characteristics and health risk assessment of main water supply reservoirs in Taizhou City, East China. Hum Ecol Risk Assess 2021;27(8)2142-2160. https://doi.org/10.1080/10807039.2021.1958670
- Wu J, Zhou H, He S, Zhang Y. Comprehensive understanding of groundwater quality for domestic and agricultural purposes in terms of health risks in a coal mine area of the Ordos basin, north of the Chinese Loess Plateau. Environ Earth Sci 2019;78(15)1-17. https://doi.org/10.1007/s12665-019-8471-1
- Trivedi R. K, Goel P. K. Chemical and biological methods for water pollution studies, Environmental Publication, Karad. 1986;1-215.
- APHA. Standard Methods for Examination of Water and Wastewater. American Public Health Association, 2005;1-8.
- Horton R. K. An index number system for rating water quality. J Water Pollut Control Fed 1965;37(3)300–306.
- Brown R. M, McClelland N. I, Deininger R. A, Tozer R. G. A water quality index-do we dare? Water Sew Works 1970;117339-117343.
- Brown R. M, McClelland N. I, Deininger R. A, O’Connor M. F. A water quality index-crashing the psychological barrier. Indic Environ Qual, 1972;(1)173-182.
- Li P, He X, Guo W. Spatial groundwater quality and potential health risks due to nitrate ingestion through drinking water: a case study in Yan’an City on the Loess Plateau of northwest China. Hum Ecol Risk Assess 2019;25(1-2)11-31. https://doi.org/10.1080/10807039.2018.1553612
- USEPA. Risk assessment guidance for superfund, vol I., Human health evaluation manual (Part A). Office of Emergency and Remedial Response, Washington DC. 1989.
- Wang L, Li P, Duan R, He X.Occurrence, controlling factors and health risks of Cr6+ in groundwater in the Guanzhong Basin of China. Expos Health 2022;14(2)239-251. https://doi.org/10.1007/s12403-021-00410-y
- Zhang Z, Guo Y, Wu J, Su F. Surface water quality and health risk assessment in Taizhou City, Zhejiang Province (China). Expos health 2022;14(1)1-16. https://doi.org/10.1007/s12403-021-00408-6
- Alobaidy A. H. M. J, Abid H. S, Maulood B. K. Application of water quality index for assessment of Dokan lake ecosystem, Kurdistan region, Iraq. J Water Resour Prot 2010(2)792-798. https://doi.org/10.4236/jwarp.2010.29093
- BIS-10500. Indian standard drinking water specifications. Bureau of Indian Standards, New Delhi, India. 2012;1-11.
- Toufeek M. A, Korium M. A. Physicochemical characteristics of water quality in Lake Nasser water. Glob J Environ Res 2009;3(3):141-148.
- Chalapathi K, Madhavi K, Ramalingaiah D, Jesintha N, Amin A, Gori G, Jaini J. Studies on Physico-chemical parameters of Kanigiri Reservoir, Nellore District, Andhra Pradesh. Int J Curr Microbiol Appl Sci 2018;7(8)979-996. https://doi.org/10.20546/ijcmas.2018.708.111
- Majagi S. H, Vijaykumar K, Vasanthkaumar B. Concentration of heavy metals in Karanja reservoir, Bidar district, Karnataka, India. Environ Monit Assess, 2008;138(1)273-279. https://doi.org/10.1007/s10661-007-9796-x
- Upadhyay A, Chandrakala M. Water quality assessment of Dalvoy Lake water, Mysore, Karnataka, India. Int J Sci Environ Technol 2016;5(5)3254-3261.
- Anwar K. M, Aggarwal V. Analysis of groundwater quality of Aligarh city (India): using water quality index. Curr World Environ 2014;9(3)851-857.
- Hujare M. S. Seasonal variation of physico-chemical parameters in the perennial tank of Talsande, Maharashtra. Ecotoxicol Environ Monit 2008;18(3)233-242.
- Qureshimatva U. M, Maurya R. R, Gamit S. B, Patel R. D, Solanki H. A. Determination of physico-chemical parameters and water quality index (Wqi) of Chandlodia lake, Ahmedabad, Gujarat, India. J Environ Anal Toxicol 2015;5(288)2161-0525.
- Thakor F.J, Bhop D. K, Dabhi H. R, Panday S. N, Chauhan N. B. Water quality index (WQI) of Pariyej lake Dist. Kheda-Gujarat. Curr World Environ 2011;6(2)225-231.
- Yadav K. K, Gupta N, Kumar V, Sharma S, Arya S. Water quality assessment of Pahuj River using water quality index at Unnao Balaji, MP, India. Int J Sci Basic Appl Res 2015;19(1)241-250.
- Murthuzasab M. R, Rajashekhar M, Vijaykumar K, Haliked N. S. Seasonal variation in physico-chemical parameters of Hirahalla Reservoir, Koppal District Karnataka. Int J Syst Biol, 2010;2(2)1-16.
- Verma P. U, Chandawat D, Gupta U, Solanki H. A. Water quality analysis of an organically polluted lake by investigating different physical and chemical parameters. Int J Res Chem Environ 2012;(2)105-111.
- Bouslah S, Djemili L, Houichi L. Water quality index assessment of Koudiat Medouar Reservoir, northeast Algeria using weighted arithmetic index method. J Water Land Dev 2017;(35)221-228. https://doi.org/10.1515/jwld-2017-0087
- He S, Li P, Su F, Wang D, Ren X. Identification and apportionment of shallow groundwater nitrate pollution in Weining Plain, northwest China, using hydrochemical indices, nitrate stable isotopes, and the new Bayesian stable isotope mixing model (MixSIAR). Environ pollut 2022;(298)118852. https://doi.org/10.1016/j.envpol.2022.118852
- Gupta N, Pandey P, Hussain J. Effect of physicochemical and biological parameters on the quality of river water of Narmada, Madhya Pradesh, India. Water Sci 2017;31(1)11-23. https://doi.org/10.1016/j.wsj.2017.03.002
- Solanki M, Saraswat H. Analysis of water quality using physico-chemical parameters of river Narmada, Madhya Pradesh, India. Int J Adv Res 2021;9(1)754-757.
- Wu J, Zhang Y, Zhou H. Groundwater chemistry and groundwater quality index incorporating health risk weighting in Dingbian County, Ordos basin of northwest China. Geochem 2020;80(4)125607. https://doi.org/10.1016/j.chemer.2020.125607
- Wei M, Wu J, Li W, Zhang Q, Su F, Wang Y. Groundwater geochemistry and its impacts on groundwater Arsenic Enrichment variation and health risks in Yougning country, Yinchuan plain of Northwest China. Expos Health 2022;(14)219-238. https://doi.org/10.1007/s12403-021-00391-y
- Kumar B, Singh U. K, Ojha S. N. Evaluation of geochemical data of Yamuna River using WQI and multivariate statistical analyses: a case study. Inter J of River Basin Manag 2018;1-13. https://doi.org/10.1080/15715124.2018.1437743
- Vieira J. S, Pires J, Martins F. G, Vilar V. J, Boaventura R. A, Botelho C. Surface water quality assessment of Lis river using multivariate statistical methods. Wat, Air, & Soil Poll 2012;223(9), 5549-5561. https://doi.org/10.1007/s11270-012-1267-5


