Assessment of Water Quality of Kulik River of Raiganj with Reference to Physicochemical Characteristics and Potability
Vivek Roy1
 , Barnan Kumar Saha1
, Jayanti Saha2
and Ayon Pal1
*
, Barnan Kumar Saha1
, Jayanti Saha2
and Ayon Pal1
*
1
Microbiology and Computational Biology Laboratory,
Department of Botany,
Raiganj University,
Raiganj,
West Bengal
India
2
Acharya Prafulla Chandra Roy Government College,
Matigara,
Siliguri,
West Bengal
India
http://dx.doi.org/10.12944/CWE.17.2.19
Copy the following to cite this article:
Roy V, Saha B. K, Saha J, Pal A. Assessment of Water Quality of Kulik River of Raiganj with Reference to Physicochemical Characteristics and Potability. Curr World Environ 2022;17(2). DOI:http://dx.doi.org/10.12944/CWE.17.2.19
Copy the following to cite this URL:
Roy V, Saha B. K, Saha J, Pal A. Assessment of Water Quality of Kulik River of Raiganj with Reference to Physicochemical Characteristics and Potability. Curr World Environ 2022;17(2).
Download article (pdf) Citation Manager Publish History

Introduction
In today's time of globalization and industrialization, one of our most essential renewable resources has become finite in terms of quality and availability. Water is a precious commodity1, and the life of our entire planet depends on it, both for its existence and maintenance. Every organism on this planet, from the tiny bacteria to the Antarctic blue whale, is directly or indirectly linked with water, whether for its habitat, food, reproduction, etc. The freshwater bodies are mainly classified into two groups- running water (lotic) and standing water (lentic) ecosystem2; besides being a source for drinking, water is also used for multiple purposes3.
The Kulik river is a trans-boundary river that flows through the Indian states of West Bengal and Bihar, and neighbouring country Bangladesh. Trans-boundary river is a river that crosses at least one political border, either a border within a nation or an international boundary. A relatively small and narrow stream, Kulik river emerges from a wetland, locally called Morar Beel, meaning 'a water body of the dead' in Raipur area of Baliadangi upazila in the Thakurgaon district of Bangladesh. It enters India through the southern part of Uttar Dinajpur, West Bengal. It flows southwest through Raiganj city and joins with Nagar River to its west. Both the river finally meets with the Mahananda River, south of Raiganj4. Raiganj Wildlife Sanctuary, aka Kulik Bird Sanctuary is situated near Raiganj, Uttar Dinajpur of West Bengal and is the second largest bird sanctuary in Asia5. The Kulik river bounds the eastern and southern parts of the sanctuary. The sanctuary also has a network of artificial canals connected with the river6. The sanctuary is home to about 164 species of birds, and some 70,000 to 80,000 migratory birds visit every year from South Asian countries and coastal areas. Thus, it clearly shows the importance of river Kulik for this area, which renders support and maintains the ecological balance of the region.
Water quality can be defined as "the chemical, physical and biological characteristics of water, usually in respect to its suitability for a designated use." Water can be used in various ways for recreation, drinking, aquaculture, agricultural practices and industry. Each of these has its own set of chemical, physical and biological standards necessary to support that use7. Over the last few centuries, tremendous degradation in the water quality of freshwater sources like ponds, rivers, lakes, and wetlands has been witnessed8. The water bodies within or flowing through the towns, cities and human habitats are more susceptible to water quality degradation9. There are multifactorial sources responsible for the degradation processes such as population growth, industrialization and subsequent urbanization10, high encroachment rate, discharge of domestic, municipal sewage and industrial wastes9, indiscriminate and large-scale deforestation, overgrazing, and soil erosion. The biological and abiotic factors, viz., physical and chemical, are the most influencing parameters which directly or indirectly affect the life of aquatic organisms. Even a minor fluctuation in anyone of these factors or when a factor becomes limiting, could create a hostile environment for the survival of the organism. Nature by its manifold regulatory mechanism has kept equilibrium and controls these physico-chemical characteristics and the types and distribution of biota in an aquatic ecosystem. Nevertheless, the instability in the aquatic ecosystem has been hastened and the ultimate consequences are changes in physico-chemical characteristics, depletion of biota, fish kill, etc. These man made changes might one day reach a phase when freshwater and its useful resources may not persist or are no longer safe for our use3.
For drinking water quality standards, three main parameters are generally considered: physical, chemical and microbiological11. The physicochemical and biological characteristic of a water body determines how healthy its ecosystem is12. Assessment of these parameters is not only indispensable12 but also helps to pinpoint the load, types of contaminants and its probable source of genesis. When a contaminant or pollutant deliberately or indeliberately enters into a water body or system, it first affects the physicochemical quality and later gradually enters into the trophic level and ruins not only the ecological balance of food chain13 but also the total economic value of the ecosystem. Like any other tests, qualitative and quantitative measures are also used in case of water. So to determine the ecological status of any water body, it is essential to evaluate its physical and chemical characteristics12. Among the aforementioned parameters, microbial contamination is predominantly responsible for water-borne diseases and poses the most major health threat globally. The microbiological quality of drinking water is examined using faecal coliform bacteria rather than identifying pathogens directly, as recommended by the World Health Organization (WHO)11. E. coli functions as an indicator and determines the risk of pathogenic contamination from faecal origin14. However, the presence of E. coli in test water samples indicates the possibility of faecal pollution and the occurrence of diseases, but not the actual existence of faecal pathogens11. Coliforms are a commonly used term for rod-shaped, Gram-negative, non-spore-forming microbes, some of which can ferment lactose as well as produce acid and gas when incubated at a specified temperature15. As the coliform bacteria are faecal indicator bacteria, they are quite important in microbiological water testing. The United States Environmental Protection Agency (EPA) and other organizations monitor the levels of coliforms in the drinking water supply. Waters are monitored using different methods, such as the presence-absence test and the most probable number (MPN) technique16.
To date, no systematic studies have been conducted on the physico-chemical parameters nor the quality control assessment of Kulik river, Raiganj. No information is available in the public domain. Therefore, in this study, an effort was made for the first time to assess the water quality of the Kulik river. The main objective of this study was to a) assess the various physicochemical parameters across different sites of the river all through the year, b) to check for the existence of statistically significant differences among the sampling sites for a specific season, and at a particular sampling site seasonally, c) to estimate the total count of faecal coliform and d) lastly to pin down measures based on the physicochemical parameters of Kulik river water for its better management and conservation.
Material and Methods
Sampling sites
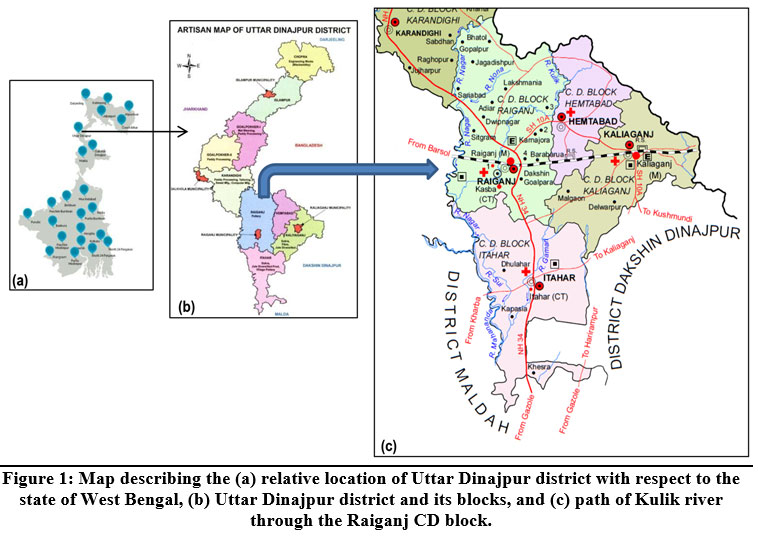
The study area is located in the district of Uttar Dinajpur, which lies between 25º11'N to 26º49'N latitude and 87º49'E to 90º00'E longitude occupying an area of 3142 square km. The district has been subdivided into two sub-divisions viz. Raiganj and Islampur with nine blocks17, 18. Our study area, Raiganj, is a community development (CD) block that forms an administrative division in Raiganj sub-division of Uttar Dinajpur district in the Indian state of West Bengal. Raiganj CD block lies between 25°37?N to 25°62'N latitude and 88°07?E to 88°12'E longitude. It is bounded by Haripur Upazila in Thakurgaon district of Bangladesh on the north, Itahar CD Block on the south, Hemtabad and Kaliaganj CD Blocks on the east and Barsoi CD Block in Katihar district of Bihar on the west19. Raiganj CD Block has an area of 472.13 square km with 222 mouzas and 221 inhabited villages20. Kulik river within the study area is used for multiple purposes like settlement, cultivation, irrigation, fishing and various primary activities21 such as cleaning, washing, and bathing. The river Kulik flowing through the Raiganj CD Block is shown in Figure 1.
 | Figure 1: Map describing the (a) relative location of Uttar Dinajpur district with respect to the state of West Bengal, (b) Uttar Dinajpur district and its blocks, and (c) path of Kulik river through the Raiganj CD block.
|
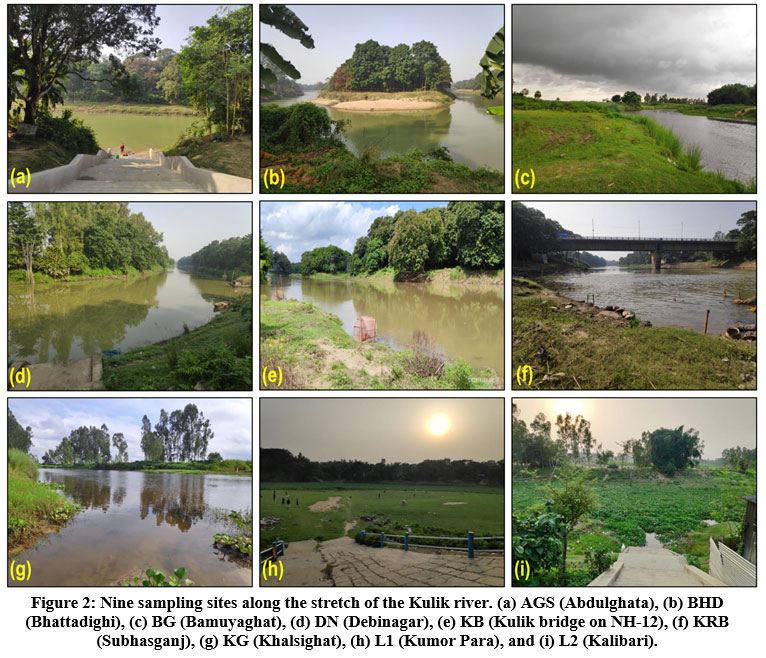
The landscape and physiography of the study area is alluvium plain, with a nearly level to very gentle slope, cultivated and rain-fed 22. Since water is a dynamic medium and its quality varies spatially and temporally, so to characterize its quality, nine sampling sites along the stretch of the Kulik river (Figure 2) were chosen in and around the town of Raiganj. The sites BG, KG, and BHD get runoff from the agricultural field throughout the year.
 | Figure 2: Nine sampling sites along the stretch of the Kulik river. (a) AGS (Abdulghata), (b) BHD (Bhattadighi), (c) BG (Bamuyaghat), (d) DN (Debinagar), (e) KB (Kulik bridge on NH-12), (f) KRB (Subhasganj), (g) KG (Khalsighat), (h) L1 (Kumor Para), and (i) L2 (Kalibari).
|
The sites AGS, KB, KRB, L1, L2, and DN are highly disturbed sites that receive continuous wastewater from encroachments situated just beside them. Daily use of soap and detergents for bathing, washing utensils and clothes, and dumping of solid waste by locals are the common anthropogenic disturbances recorded at these sites. The details of the sampling sites are given in Table 1.
Table 1: Geo-coordinates of the nine sampling sites along the stretch of Kulik river.
Sl. No. | Sampling sites | Name of the locality | Latitude | Longitude |
DN | Debinagar | 25º 36' 10" N | 88º 06' 41´´E | |
L1 | Kumor Para | 25º 36' 45´´N | 88º 07' 09´´E | |
L2 | Kalibari | 25º 36' 14´´N | 88º 07' 20´´E | |
KRB | Subhasganj | 25º 37´ 11´´N | 88º 06´ 46´´E | |
KB | Kulik bridge (on NH-12) | 25º 38´ 06.7´´N | 88º 07´ 19.9´´E | |
AGS | Abdulghata | 25º 38´ 10´´N | 88º 07´ 25´´E | |
BHD | Bhattadighi | 25º 39´ 09´´N | 88º 08´ 37´´E | |
BG | Bamuyaghat | 25º 40´ 26´´N | 88º 09´ 06´´E | |
KG | Khalsighat | 25º 41´ 41´´N | 88º 09´ 30´´E |
Collection of samples
Water samples were collected from the Kulik river from January–December 2020 in the first week of every month. The samples were collected in the morning between 7.30 am - 8.30 am. The samples were collected from a depth of 5-10 cm below the water surface, in 500 ml autoclaved glass containers and acid-washed 5-6 litres plastic containers. The grab or catch sampling method was generally applied during the sampling. All samples were correctly labelled. Samples were preserved in cold condition and transported to the laboratory within two hours of collection for analyses23.
Determination of pH and temperature
Water temperature and pH were measured on the collection sites24. Centigrade Mercury thermometer (0–110?C) was used to measure water temperature. The pH of water samples was measured using a portable pH meter. The pH meter was calibrated using pH 4.0 and 7.0 buffer before taking measurements.
Determination of different physicochemical parameters
Different physicochemical parameters such as dissolved oxygen (DO) (mg/L), free carbon dioxide (CO2) (mg/L), total alkalinity (mg/L), total hardness (mg/L) and chlorides (mg/L) were determined according to the standard methods outlined in APHA, 201725. These have been tabulated in Table 2.
Table 2: Summary of different physicochemical parameters studied.
Sl. No. | Parameter studied | Method used | A brief outline of the method used |
1. | Dissolved Oxygen | Winkler's method with Azide modification25 | 1 ml of MnSO4 and 1 ml alkali-iodide-azide were added and mixed to the test samples, then 1 ml of conc. H2SO4 and a few drops of starch were added; finally titrated until the disappearance of the blue colour. |
2. | Free CO2 | NaOH titration method25 | Phenolphthalein was added and titrated against NaOH till the appearance of pink colour. |
3. | Chlorides | Argentometric method25 | 1.0 mL K2CrO4 was added to the test sample and titrated against AgNO3 until the appearance of a pinkish-yellow hue. |
4. | Total alkalinity | Standard titrimetric method using phenolphthalein and methyl orange25 | Few drops of phenolphthalein were added to the test samples; if colourless, methyl orange was added and titrated against H2SO4 till the appearance of a permanent orange colour. |
5. | Total hardness | EDTA titrimetric method25 | 1 ml ammonia buffer and 1-2 drops of Eriochrome Black-T (EBT) indicator were added to 50 ml of the test water sample and titrated against EDTA until the colour changed into steel blue. |
MPN method
This multiple-tube fermentation (MTF) technique consists of inoculating a series of tubes containing a suitable selective broth culture medium for bacterial growth and then, after a specific incubation period, is examined for gas formation. Production of gas and abundant growth in the tube is regarded as "presumptive positive" since the gas represents the possible presence of coliforms. However, other organisms may also produce gases, so a subsequent confirmatory test is necessary. This technique is known as the MPN method. The results of the MTF technique are expressed in terms of the MPN of the microorganism present. This number is a statistical estimate of the mean number of coliforms in sample26. For highly contaminated water, the inoculation volumes are made by a ten times dilution step27. The following inoculations are typically made: 10 ml of a test sample to each of 5 tubes containing 10 ml of double-strength medium, 1.0 ml of sample to each of 5 tubes containing 10 ml of single-strength medium, and 0.1 ml of sample to each of 5 tubes containing 10 ml of single-strength medium. MPN method was conducted in three steps - a) presumptive test, b) confirmed test and c) completed test28.
Statistical analysis based on the different physicochemical parameters for detecting season-wise and site-wise variation in water quality
All the parameters viz., DO, free CO2, total, alkalinity, total hardness and chloride were compared both seasonally and sampling site-wise, for significant differences. Owing to the non-normal distribution of most data, the normality test was carried out using Shapiro-Wilk test. The comparisons were considered statistically significant at p ? 0.0129. One Way Analysis of Variance (1-ANOVA) or Kruswal-Wallis One Way Analysis of Variance on Ranks (KWA) was carried out, and in all cases, a p-value ? 0.05 were treated as highly significant30. To isolate the group or groups that differ from the others, pairwise multiple comparisons were also carried out using Tukey Test or Holm-Sidak method.
Results and Discussion
The present study consists of three periods, namely post-monsoon, pre-monsoon and monsoon. The post-monsoon period extends from October to February; the pre-monsoon period extends from March to May, and the monsoon period extends from June to September. The climate of this district and specifically Raiganj, is characterized by hot summer with high humidity, abundant rainfall and cold winter. December and January are the coldest months. Table 3 shows the temperature and pH for different periods for the nine sites. A well-marked seasonal fluctuation in all five parameters has been found during the investigation. The drinking water guidelines set by Bureau of Indian Standards (BIS) were used to compare the results obtained from the physicochemical and microbiological attributes31.
Table 3: Recorded values of temperature and pH at different sampling stations for different periods.
Sl. No. | Sampling sites | Water temperature (ºC) | pH | ||||
Pre-monsoon period | Monsoon period | Post-monsoon period | Pre-monsoon period | Monsoon period | Post-monsoon period | ||
1 | DN | 26 | 32 | 18 | 7.22 | 6.81 | 7.13 |
2 | L1 | 25 | 32 | 18 | 6.99 | 6.66 | 6.95 |
3 | L2 | 25 | 32 | 18 | 6.95 | 6.88 | 7.01 |
4 | KRB | 25 | 32 | 18 | 7.32 | 7.06 | 7.4 |
5 | KB | 25 | 33 | 18 | 7.27 | 7.41 | 7.21 |
6 | AGS | 26 | 33 | 18 | 7.36 | 7.19 | 7.31 |
7 | BHD | 24 | 33 | 18 | 7.39 | 7.28 | 7.35 |
8 | BG | 26 | 31 | 19 | 7.58 | 6.79 | 7.55 |
9 | KG | 26 | 31 | 19 | 7.37 | 6.83 | 7.49 |
Water temperature
In this study, the water temperature recorded ranged from 18 °C to 33 °C in different seasons. The lowest water temperature was recorded (18 °C) post-monsoon and the highest (33 °C) during the monsoon season. The temperature readings for the different periods of all the sampling sites are provided in Table 4.
Water temperature is an important parameter that directly influences the biota of a water body by affecting its various activities such as behaviour, respiration, breeding and metabolism. The temperature of the water is influenced by different factors like latitude, altitude, season, air circulation, cloud cover, solar radiation, air temperatures, water level, water flow and depth of water body12. The water temperature of an aquatic body is also responsible for directly influencing the amount of DO present in it9.
Table 4: Recorded values of temperature (in ºC) at different sampling stations seasonally.
Sampling Sites | DN | L1 | L2 | KRB | KB | AGS | BHD | BG | KG |
Pre-monsoon period | 26 | 25 | 25 | 25 | 25 | 26 | 24 | 26 | 26 |
Post-monsoon period | 18 | 18 | 18 | 18 | 18 | 18 | 18 | 19 | 19 |
Monsoon period | 32 | 32 | 32 | 32 | 33 | 33 | 33 | 31 | 31 |
In this study, higher water temperature during the monsoon period and lower during the post-monsoon period in all the sampling sites indicate a sharp seasonal variation. The lower water temperature in all the sampling sites during the post-monsoon period may be associated with the lower atmospheric temperature32. High water temperature during monsoon may be related to surface water heating33 and also due to the low water velocity of the Kulik river. Moreover, the density of shading stream bank vegetation, urban groundwater, etc., may cause the temperature fluctuation in the studied site34.
pH
The pH, one of the most important parameters of water quality, measures how acidic or basic the water is. To determine the corrosive nature of test water samples, it is very significant. A lower value indicates highly corrosive water34. In this study, the pH of the water varied from 6.95 to 7.55 in post-monsoon, 6.95 to 7.58 in pre-monsoon and 6.66 to 7.41 during the monsoon. The water was slightly acidic to alkaline throughout the study period. Table 5 depicts the pH of the water from the different sampling sites. pH ranging from 5 to 8.5 is best for plankton growth35, and most aquatic animals prefer a range of 6.5-8.012. The presence of carbonates in sufficient quantities renders alkalinity to natural water bodies most of the time35. In the study, lower pH during the monsoon period may be associated with the dilution effect of monsoon rain29.
Table 5: Recorded values of pH at different sampling stations seasonally.
Sampling Sites | DN | L1 | L2 | KRB | KB | AGS | BHD | BG | KG |
Pre-monsoon period | 7.22 | 6.99 | 6.95 | 7.32 | 7.27 | 7.36 | 7.39 | 7.58 | 7.37 |
Post-monsoon period | 7.13 | 6.95 | 7.01 | 7.4 | 7.21 | 7.31 | 7.35 | 7.55 | 7.49 |
Monsoon period | 6.81 | 6.66 | 6.88 | 7.06 | 7.41 | 7.19 | 7.28 | 6.79 | 6.83 |
Free CO2
The values recorded during the post-monsoon season were 4.33 to 6.0 mg/L; in pre-monsoon period, it was 5.0 to 8.67 mg/L, and 4.0 to 7.33 mg/L during the monsoon period. The free CO2 level of different seasonal periods for all the sampling sites is provided in Table 6.
CO2, a by-product of respiration, is highly soluble in water. Its value is larger in polluted water as compared to freshwater bodies3. The CO2 concentration in water depends upon certain factors like temperature of the water body, depth, respiration rate, amount of organic matter and decomposition rate9. Free CO2 was recorded with its maximum concentration in the pre-monsoon and minimum in the post-monsoon period.
Table 6: The free CO2 level of different seasonal periods for all the sampling sites
Post-monsoon period (value in mg/L) | |||||||||
Sampling Sites | DN | L1 | L2 | KRB | KB | AGS | BHD | BG | KG |
1 | 4 | 6 | 4 | 4 | 6 | 4 | 6 | 6 | 6 |
2 | 6 | 6 | 6 | 6 | 4 | 6 | 6 | 4 | 4 |
3 | 6 | 8 | 6 | 6 | 4 | 6 | 4 | 6 | 4 |
4 | 6 | 6 | 6 | 6 | 6 | 4 | 6 | 6 | 4 |
5 | 8 | 6 | 4 | 6 | 6 | 4 | 4 | 6 | 4 |
6 | 6 | 4 | 6 | 4 | 2 | 8 | 6 | 4 | 4 |
Mean | 6 | 6 | 5.33 | 5.33 | 4.67 | 5.33 | 5.33 | 5.33 | 4.33 |
SD | 1.15 | 1.15 | 0.94 | 0.94 | 1.49 | 1.49 | 0.94 | 0.94 | 0.75 |
Pre-monsoon period (value in mg/L) | |||||||||
Sampling Sites | DN | L1 | L2 | KRB | KB | AGS | BHD | BG | KG |
1 | 8 | 10 | 10 | 6 | 8 | 8 | 6 | 8 | 6 |
2 | 8 | 8 | 8 | 6 | 8 | 10 | 6 | 6 | 4 |
3 | 10 | 8 | 8 | 4 | 8 | 8 | 6 | 6 | 6 |
4 | 10 | 8 | 10 | 4 | 10 | 10 | 6 | 6 | 4 |
5 | 8 | 6 | 8 | 4 | 6 | 8 | 8 | 6 | 6 |
6 | 8 | 8 | 8 | 6 | 8 | 8 | 6 | 6 | 6 |
Mean | 8.67 | 8 | 8.67 | 5 | 8 | 8.67 | 6.33 | 6.33 | 5.33 |
SD | 0.94 | 1.15 | 0.94 | 1 | 1.15 | 0.94 | 0.75 | 0.75 | 0.94 |
Monsoon period (value in mg/L) | |||||||||
Sampling Sites | DN | L1 | L2 | KRB | KB | AGS | BHD | BG | KG |
1 | 6 | 4 | 4 | 4 | 4 | 4 | 2 | 8 | 6 |
2 | 6 | 4 | 4 | 6 | 4 | 6 | 4 | 6 | 8 |
3 | 4 | 6 | 4 | 4 | 4 | 4 | 4 | 8 | 6 |
4 | 4 | 6 | 6 | 4 | 4 | 4 | 6 | 6 | 8 |
5 | 6 | 4 | 4 | 4 | 6 | 4 | 4 | 6 | 8 |
6 | 6 | 4 | 4 | 4 | 4 | 4 | 4 | 6 | 8 |
Mean | 5.33 | 4.67 | 4.33 | 4.33 | 4.33 | 4.33 | 4 | 6.67 | 7.33 |
SD | 0.94 | 0.94 | 0.75 | 0.75 | 0.75 | 0.75 | 1.15 | 0.94 | 0.94 |
DO
In this study, the DO varied from 7.33 to 9.17 mg/L during the post-monsoon period, from 4.33 to 5.93 mg/L in pre-monsoon period and 4.93 to 5.97 mg/L during the monsoon period. Table 7 depicts the DO content of the water from the different sampling sites seasonally.
One of the most vital parameters of water quality in a flowing water system, viz., streams, rivers, and lakes, is the amount of DO. To check the pollution of a water body, it is considered to be a key test25. For example, the higher the concentration of DO better the water quality. As compared to CO2, oxygen is slightly soluble in water and is temperature sensitive36. The amount of oxygen decreases in the water for the following reasons: respiration by fauna, organic matter and its decomposition rate, high temperature, oxygen-demanding wastes etc.10.
The higher DO value recorded during the post-monsoon period may be due to lower water temperature; since DO is inversely related to temperature33.
Table 7: The DO content of the water from the different sampling sites shown seasonally.
Post-monsoon period (value in mg/L) | |||||||||
Sampling Sites | DN | L1 | L2 | KRB | KB | AGS | BHD | BG | KG |
1 | 7.8 | 8.6 | 8.6 | 8.6 | 7.8 | 7.4 | 8.6 | 9.2 | 8.8 |
2 | 7.8 | 8.8 | 8.8 | 9 | 7.8 | 7.2 | 8.6 | 9.2 | 8.6 |
3 | 8.2 | 8.4 | 8.6 | 8.6 | 7.8 | 7.4 | 9 | 9 | 8.6 |
4 | 8 | 8.4 | 8.4 | 8.8 | 7.6 | 7.4 | 8.8 | 9.2 | 8.8 |
5 | 7.6 | 8.6 | 8.8 | 8.8 | 8 | 7.4 | 8.6 | 9.2 | 8.6 |
6 | 7.6 | 8.2 | 8.8 | 8.6 | 7.8 | 7.2 | 8.8 | 9.2 | 8.6 |
Mean | 7.83 | 8.5 | 8.67 | 8.73 | 7.8 | 7.33 | 8.73 | 9.17 | 8.67 |
SD | 0.21 | 0.19 | 0.15 | 0.15 | 0.12 | 0.09 | 0.15 | 0.07 | 0.09 |
Pre-monsoon period (value in mg/L) | |||||||||
Sampling Sites | DN | L1 | L2 | KRB | KB | AGS | BHD | BG | KG |
1 | 4.6 | 4.8 | 4.6 | 5 | 5.6 | 5.4 | 5.8 | 5 | 5.2 |
2 | 4 | 4.8 | 4.2 | 5.4 | 5.6 | 5.2 | 6 | 5.2 | 5.2 |
3 | 4.2 | 4.6 | 4.6 | 5 | 5 | 5.2 | 5.6 | 5.4 | 4.8 |
4 | 4.4 | 5 | 4.4 | 5 | 6 | 5.6 | 6 | 5.6 | 5.4 |
5 | 4.4 | 4.8 | 4.8 | 5 | 5.4 | 5.8 | 6.2 | 5.4 | 5.6 |
6 | 4.4 | 4.8 | 4.6 | 5.2 | 5.6 | 5.6 | 6 | 5.6 | 5.6 |
Mean | 4.33 | 4.8 | 4.53 | 5.1 | 5.53 | 5.47 | 5.93 | 5.37 | 5.3 |
SD | 0.19 | 0.12 | 0.19 | 0.15 | 0.29 | 0.22 | 0.19 | 0.21 | 0.28 |
Monsoon period (value in mg/L) | |||||||||
Sampling Sites | DN | L1 | L2 | KRB | KB | AGS | BHD | BG | KG |
1 | 4.6 | 5.4 | 5 | 4.8 | 6.4 | 6 | 5.6 | 5.8 | 5.6 |
2 | 5 | 4.8 | 5 | 5.2 | 5.8 | 5.8 | 5.4 | 5.6 | 5.6 |
3 | 5 | 5 | 5 | 5 | 5.8 | 5.6 | 5.4 | 5.6 | 6 |
4 | 5 | 4.8 | 5.2 | 5.4 | 6 | 5.6 | 5.6 | 5.8 | 6.6 |
5 | 5 | 5 | 4.8 | 5.4 | 5.8 | 5.4 | 5.6 | 5.8 | 5.8 |
6 | 5 | 4.8 | 4.8 | 5.2 | 6 | 5.6 | 5.6 | 5.6 | 5.8 |
Mean | 4.93 | 4.97 | 4.97 | 5.17 | 5.97 | 5.67 | 5.53 | 5.7 | 5.9 |
SD | 0.15 | 0.21 | 0.14 | 0.21 | 0.21 | 0.19 | 0.09 | 0.1 | 0.34 |
Total alkalinity
During the present study, alkalinity ranged from 65.33 to 72.67 mg/L during post-monsoon, from 78 to 96 mg/L during pre-monsoon, and 23.67 to 36.67 mg/L in monsoon. Data on the alkalinity of the water samples are tabulated in Table 8.
The acid-neutralizing capacity of a water body denotes its alkalinity36. The key reasons for alkalinity in water are hydroxide ions (OH?), bicarbonate ions (HCO3?), and carbonate ions (CO32?)37, or a mixture of both of these ions in water. Bicarbonates and carbonates generally get interchanged depending upon the pH and temperature of the water body38. Alkalinity is directly related to productivity 12 because it determines the availability of free CO2 required for photosynthesis3 and thus promotes high primary productivity35.
Table 8: Total alkalinity of different sampling sites seasonally.
Post-monsoon period (value in mg/L) | |||||||||
Sampling Sites | DN | L1 | L2 | KRB | KB | AGS | BHD | BG | KG |
1 | 66 | 68 | 72 | 68 | 66 | 64 | 64 | 64 | 66 |
2 | 68 | 70 | 72 | 66 | 68 | 66 | 70 | 66 | 64 |
3 | 72 | 68 | 74 | 72 | 68 | 66 | 68 | 68 | 64 |
4 | 68 | 72 | 70 | 70 | 66 | 68 | 68 | 70 | 66 |
5 | 66 | 62 | 74 | 68 | 70 | 64 | 68 | 62 | 66 |
6 | 68 | 68 | 74 | 68 | 66 | 64 | 66 | 66 | 70 |
Mean | 68 | 68 | 72.67 | 68.67 | 67.33 | 65.33 | 67.33 | 66 | 66 |
SD | 2 | 3.06 | 1.49 | 1.88 | 1.49 | 1.49 | 1.88 | 2.58 | 2 |
Pre-monsoon period (value in mg/L) | |||||||||
Sampling Sites | DN | L1 | L2 | KRB | KB | AGS | BHD | BG | KG |
1 | 90 | 90 | 94 | 84 | 78 | 86 | 80 | 88 | 78 |
2 | 90 | 94 | 106 | 86 | 82 | 80 | 78 | 92 | 78 |
3 | 92 | 92 | 90 | 86 | 82 | 80 | 80 | 92 | 76 |
4 | 88 | 92 | 96 | 84 | 78 | 84 | 80 | 92 | 80 |
5 | 90 | 94 | 94 | 86 | 82 | 86 | 78 | 92 | 78 |
6 | 90 | 92 | 96 | 86 | 80 | 84 | 78 | 92 | 78 |
Mean | 90 | 92.33 | 96 | 85.33 | 80.33 | 83.33 | 79 | 91.33 | 78 |
SD | 1.15 | 1.37 | 4.89 | 0.94 | 1.79 | 2.49 | 1 | 1.49 | 1.15 |
Monsoon period (value in mg/L) | |||||||||
Sampling Sites | DN | L1 | L2 | KRB | KB | AGS | BHD | BG | KG |
1 | 36 | 32 | 28 | 24 | 28 | 26 | 24 | 34 | 34 |
2 | 34 | 24 | 26 | 22 | 28 | 26 | 28 | 36 | 36 |
3 | 24 | 28 | 30 | 26 | 30 | 30 | 30 | 40 | 36 |
4 | 34 | 26 | 30 | 22 | 26 | 28 | 30 | 38 | 34 |
5 | 32 | 26 | 28 | 24 | 28 | 26 | 28 | 36 | 36 |
6 | 36 | 28 | 26 | 24 | 32 | 28 | 28 | 36 | 36 |
Mean | 32.67 | 27.33 | 28 | 23.67 | 28.67 | 27.33 | 28 | 36.67 | 35.33 |
SD | 4.10 | 2.49 | 1.63 | 1.37 | 1.88 | 1.49 | 2 | 1.88 | 0.94 |
Total hardness
The value of hardness recorded from the different sites was found to range from 48.0 to 58 mg/L in the post-monsoon period, 60.67 to 92 mg/L during pre-monsoon and 22.33 to 38.33 mg/L in the monsoon period. Data about the hardness of the water samples are given in Table 9.
Hardness is a term used to denote the capacity of water to react with detergent37. Hardness is predominantly imparted by calcium and magnesium ions. Hardness, like DO, is an indicator of water quality and depends mainly upon these two ions, which exist as bicarbonates, sulfates, and sometimes as chlorides and nitrates12, 36. The total hardness is the sum of calcium and magnesium ions concentrations, expressed as CaCO3 in mg/L.
The higher value of total hardness in our study during the pre-monsoon period can be attributed to the decrease in water volume and the increased rate of evaporation32, 39. The hardness of any water body also depends upon the local geology as the water percolates through rocks40.
Table 9: Total hardness of different seasons for all the sampling sites.
Post-monsoon period (value in mg/L) | |||||||||
Sampling Sites | DN | L1 | L2 | KRB | KB | AGS | BHD | BG | KG |
1 | 56 | 58 | 66 | 50 | 54 | 60 | 52 | 46 | 48 |
2 | 58 | 56 | 62 | 54 | 54 | 56 | 52 | 46 | 48 |
3 | 60 | 58 | 62 | 56 | 60 | 52 | 56 | 50 | 50 |
4 | 58 | 58 | 62 | 56 | 56 | 54 | 52 | 52 | 50 |
5 | 58 | 58 | 64 | 56 | 56 | 56 | 54 | 46 | 48 |
6 | 58 | 56 | 62 | 54 | 56 | 56 | 54 | 48 | 48 |
Mean | 58 | 57.33 | 63 | 54.33 | 56 | 55.67 | 53.33 | 48 | 48.67 |
SD | 1.15 | 0.94 | 1.52 | 2.13 | 2 | 2.42 | 1.49 | 2.30 | 0.94 |
Pre-monsoon period (value in mg/L) | |||||||||
Sampling Sites | DN | L1 | L2 | KRB | KB | AGS | BHD | BG | KG |
1 | 84 | 80 | 94 | 96 | 72 | 70 | 66 | 60 | 70 |
2 | 86 | 82 | 94 | 90 | 72 | 72 | 68 | 60 | 72 |
3 | 82 | 82 | 90 | 86 | 70 | 74 | 68 | 62 | 66 |
4 | 82 | 80 | 90 | 94 | 74 | 72 | 68 | 60 | 70 |
5 | 84 | 80 | 90 | 94 | 72 | 72 | 68 | 62 | 74 |
6 | 84 | 80 | 92 | 92 | 72 | 72 | 68 | 60 | 70 |
Mean | 83.67 | 80.67 | 91.67 | 92 | 72 | 72 | 67.67 | 60.67 | 70.33 |
SD | 1.37 | 0.94 | 1.79 | 3.26 | 1.15 | 1.15 | 0.74 | 0.94 | 2.42 |
Monsoon period \(value in mg/L) | |||||||||
Sampling Sites | DN | L1 | L2 | KRB | KB | AGS | BHD | BG | KG |
1 | 30 | 24 | 38 | 22 | 26 | 28 | 30 | 34 | 38 |
2 | 32 | 20 | 36 | 24 | 30 | 26 | 30 | 36 | 30 |
3 | 30 | 22 | 42 | 24 | 30 | 28 | 32 | 38 | 34 |
4 | 32 | 24 | 36 | 22 | 28 | 28 | 24 | 32 | 38 |
5 | 32 | 22 | 40 | 24 | 32 | 28 | 28 | 34 | 36 |
6 | 32 | 22 | 38 | 24 | 28 | 28 | 30 | 34 | 36 |
Mean | 31.33 | 22.33 | 38.33 | 23.33 | 29 | 27.67 | 29 | 34.67 | 35.33 |
SD | 0.94 | 1.37 | 2.13 | 0.94 | 1.91 | 0.74 | 2.51 | 1.88 | 2.74 |
Chloride
In the present investigation, the chloride ion concentration was found to range from 15.68 to 20.02 mg/L in the post-monsoon period, 20.02 to 40.88 mg/L in pre-monsoon and 18.68 to 43.88 mg/L during the monsoon period. The concentration of chloride was found to be higher in the following sites: AGS> DN> KRB=L2> L1=KB> BHD> BG> KG, during the post-monsoon period. Whereas during the pre-monsoon period, the sites with a high chloride concentration are: L2> DN> L1> KRB> AGS> KB> BHD> KG> BG. Lastly, in the monsoon period, the following was observed: KG> BHD> L2> DN> BG> KRB> KB> L1>AGS. The data pertaining to chloride ion concentration is given in Table 10.
Chlorides are found in most natural fresh waters, in the form of salts of sodium or calcium12, but at a very low concentration37. It is highly soluble in water9 and imparts a salty taste to water mainly when the associated cation is sodium, but calcium or potassium chloride also tastes salty when detected at a very high concentration41.
Table 10: The chloride content of different seasons for all the sampling sites.
Post-monsoon period (value in mg/L) | |||||||||
Sampling Sites | DN | L1 | L2 | KRB | KB | AGS | BHD | BG | KG |
1 | 19.02 | 18.02 | 19.02 | 19.02 | 19.02 | 18.02 | 17.02 | 16.02 | 16.02 |
2 | 20.02 | 18.02 | 19.02 | 18.02 | 20.02 | 21.02 | 16.02 | 16.02 | 16.02 |
3 | 20.02 | 20.02 | 19.02 | 20.02 | 17.02 | 20.02 | 17.02 | 16.02 | 15.02 |
4 | 19.02 | 18.02 | 18.02 | 19.02 | 18.02 | 21.02 | 17.02 | 17.02 | 15.02 |
5 | 19.02 | 19.02 | 20.02 | 19.02 | 20.02 | 20.02 | 17.02 | 16.02 | 16.02 |
6 | 21.02 | 19.02 | 19.02 | 19.02 | 18.02 | 20.02 | 16.02 | 15.02 | 16.02 |
Mean | 19.68 | 18.68 | 19.02 | 19.02 | 18.68 | 20.02 | 16.68 | 16.02 | 15.68 |
SD | 0.74 | 0.74 | 0.57 | 0.57 | 1.10 | 1 | 0.47 | 0.57 | 0.47 |
Pre-monsoon period (value in mg/L) | |||||||||
Sampling Sites | DN | L1 | L2 | KRB | KB | AGS | BHD | BG | KG |
1 | 40.04 | 35.04 | 40.04 | 29.03 | 26.03 | 25.03 | 25.03 | 22.02 | 21.02 |
2 | 39.04 | 36.04 | 42.05 | 28.03 | 25.03 | 27.03 | 24.03 | 21.02 | 19.02 |
3 | 40.04 | 37.04 | 40.04 | 26.03 | 25.03 | 27.03 | 25.03 | 19.02 | 21.02 |
4 | 40.04 | 37.04 | 41.05 | 28.03 | 24.03 | 25.03 | 24.03 | 20.02 | 20.02 |
5 | 39.04 | 36.04 | 41.05 | 28.03 | 24.03 | 27.03 | 24.03 | 18.02 | 21.02 |
6 | 40.04 | 36.04 | 41.05 | 28.03 | 25.03 | 26.03 | 24.03 | 20.02 | 21.02 |
Mean | 39.70 | 36.20 | 40.88 | 27.86 | 24.86 | 26.19 | 24.36 | 20.02 | 20.52 |
SD | 0.47 | 0.68 | 0.69 | 0.89 | 0.68 | 0.89 | 0.47 | 1.29 | 0.76 |
Monsoon period (value in mg/L) | |||||||||
Sampling Sites | DN | L1 | L2 | KRB | KB | AGS | BHD | BG | KG |
1 | 36.04 | 21.02 | 44.05 | 30.03 | 24.03 | 18.02 | 45.05 | 32.04 | 43.05 |
2 | 35.04 | 21.02 | 38.04 | 31.03 | 23.02 | 19.02 | 44.05 | 33.04 | 43.05 |
3 | 34.04 | 17.02 | 40.04 | 29.03 | 22.02 | 19.02 | 42.05 | 35.04 | 45.05 |
4 | 35.04 | 21.02 | 41.05 | 30.03 | 19.02 | 19.02 | 40.04 | 33.04 | 43.05 |
5 | 33.04 | 18.02 | 43.05 | 28.03 | 19.02 | 18.02 | 42.05 | 35.04 | 44.05 |
6 | 34.04 | 20.02 | 40.04 | 29.03 | 20.02 | 19.02 | 38.04 | 35.04 | 45.05 |
Mean | 34.54 | 19.68 | 41.04 | 29.53 | 21.18 | 18.68 | 41.88 | 33.87 | 43.88 |
SD | 0.95 | 1.59 | 2 | 0.95 | 1.95 | 0.47 | 2.34 | 1.21 | 0.89 |
Statistical analysis of the different physicochemical parameters
During the study, the parameters viz., DO, free CO2, total hardness, total alkalinity and chloride content of surface waters of different sites of Kulik River were analyzed both season-wise and sampling site-wise. It was observed that various parameters depicted significant differences between seasons for a particular site and among sampling sites for a specific season. 1-ANOVA and KWA, along with an appropriate post-hoc test, gave a significant F or H value for almost all the comparisons (at p<0.01 level).
Season-wise analysis of DO for the different sampling sites
A 1-ANOVA using DO data of the nine sampling sites during the post-monsoon period showed a statistically significant difference (F=84.214 with df=8, p<0.01). Pairwise multiple comparisons using the Holm-Sidak method showed that in terms of DO, the majority of the sites have significant differences (p<0.01) except the following: KRB vs. L1, BHD vs. L1, L2 vs. L1, KG vs. L1, BHD vs. L2, KRB vs. L2, KRB vs. KG, BHD vs. KG, DN vs. KB, BHD vs. KRB and KG vs. L2. During the pre-monsoon period, 1-ANOVA on DO depict significant differences between the different sampling sites (F=29.322, df=8, p<0.01). Holm-Sidak method depicted significant differences between most of the sampling sites at p<0.01. The KWA on DO for the monsoon period also showed a significant difference (H= 44.473, df =8, p <0.01). Pairwise multiple comparisons on ranks using Tukey test detected significant differences in DO at p<0.01 level. The considerable differences between the sites, along with their t or q values, are provided in Supplementary Table S1.
Season-wise analysis of total alkalinity for the different sampling sites
The 1-ANOVA for total alkalinity using the data of the nine sampling sites during the post-monsoon period showed a significant difference (F= 5.574 with 8 df, p<0.01). Pairwise multiple comparisons using the Holm-Sidak method showed that the site L2 has a significant difference with five different sites, at p< 0.01, in terms of total alkalinity. The KWA on total alkalinity during the pre-monsoon period also showed a significant difference (H= 42.265, df =8, p <0.01). Pairwise multiple comparisons on ranks using the Tukey test detected significant differences for some of the sampling sites at p<0.05 level. The KWA for total alkalinity during the monsoon period showed a statistically significant difference (H = 37.734 with 8 df, p <0.01). To find out the differences between the groups, multiple pairwise comparisons on ranks using the Tukey test demonstrated two sampling sites, BG vs KRB and KG vs KRB, showing significant differences, at p<0.01, in terms of total alkalinity. The considerable differences between the sites and their t or q values, are provided in Supplementary Table S2.
Season-wise analysis of chloride for the different sampling sites
The KWA on chloride, during the post-monsoon period, showed a significant difference (H = 40.660 with 8 df, p<0.01). Significant differences in terms of chloride were found between a few sites using the post-hoc Tukey test at p< 0.01 level. The 1-ANOVA on chloride, during the pre-monsoon period also showed a statistically significant difference (F= 498.82 with 8 df, p<0.01). The post-hoc analysis using Holm-Sidak showed that except between the following sites, AGS vs KB, L2 vs DN, KB vs BHD and KG vs BG, all the other site pairs showed significant differences. During the monsoon period, 1-ANOVA for chloride showed significant differences between the different sampling sites (F= 217.340 with 8 df, p<0.01). Pairwise multiple comparisons using the Holm-Sidak method depicted substantial differences between most of the sampling sites at p<0.01 level, except KG vs L2, KB vs AGS, KG vs BHD, KB vs L1, L1 vs AGS, BHD vs L2 and DN vs BG. The significant differences between the sites and their t or q values are provided in Supplementary Table S3.
Season-wise analysis of free CO2 for the different sampling sites
The KWA on free CO2 during the post-monsoon period showed that the differences (H = 8.881 with 8 df, p=0.352) in the median values among the treatment groups are not significant enough to exclude the possibility that the difference is due to random sampling variability. Hence there is not a statistically significant difference. But during the pre-monsoon period, the KWA test for free CO2 showed a significant difference among the sites (H = 37.986, df = 8, p<0.01) and similar was the case during the monsoon period (H = 30.429, df = 8, p<0.01) too.
Season-wise analysis of total hardness for the different sampling sites
During the post-monsoon period, the 1-ANOVA on total hardness depicted significant differences among the different sites (F= 35.288, df = 8, p<0.01). Pairwise multiple comparisons using the Holm-Sidak test showed that most sites showed significant differences at an overall significant level of p<0.01. The KWA for total hardness during the pre-monsoon period showed a statistically significant difference (H = 50.374 with df= 8, p<0.01). In the pairwise multiple comparisons on ranks using the Tukey test, only a few sites showed significant differences, at p< 0.01. During the monsoon period, the KWA for total hardness showed that the differences among the sites are significant (H = 34.822 with 8 df, p<0.01). The significant differences between the sites along with their t or q values, are provided in Supplementary Table S4.
Site-wise analysis of total alkalinity during different seasonal periods
KWA for the sites AGS, DN, KG and L2 showed statistically significant differences in total alkalinity (H= 15.364, 15.429, 15.576 and 15.316, respectively) at p<0.01. In the pairwise multiple comparison using the Tukey test for all the sites mentioned above a significant difference was only observed in total alkalinity between the pre-monsoon and monsoon period (q= 5.506, p<0.05). For sites BG, BHD, KB, KRB and L1, the 1-ANOVA showed significant differences (F= 902.143, 1251.883, 1203.765, 2410.088 and 927.357 respectively, df =2, p<0.01). The post hoc test using Holm-Sidak showed significant differences for all the sites for the three different seasonal periods. The significant differences between the sites and their t or q values for respective seasons, are provided in Supplementary Table S5.
Site-wise analysis of chloride during different seasonal periods
KWA for the site BHD, KB and L2 showed significant differences in chloride content (H= 15.526, 12.798, 11.735, respectively) at p<0.01. Pairwise multiple comparison on ranks using the Tukey test for the site BHD showed a significant difference only between the monsoon and post-monsoon period (q= 5.506, p<0.01). Whereas, for the sites, KB and L2, the post hoc test showed a significant difference between the pre-monsoon and post-monsoon period (q= 4.791 and 4.168 respectively, p<0.01). The 1-ANOVA for the sites AGS, BG, DN, KG, KRB and L1 also showed significant differences (F= 118.762, 379.193, 956.237, 2116.953, 232.835 and 405.252 respectively, at p<0.01). The results of the multiple pairwise comparisons using the Holm-Sidak method between the sites along with their t or q values for the respective seasonal periods are provided in Supplementary Table S6.
Site-wise analysis of free CO2 during different seasonal periods
A KWA test for the site AGS, L1 and KG showed significant differences in free CO2 (H= 12.167, 10.632, and 11.119, df =2 at p<0.01). A post hoc test using the Tukey test detected a significant difference between pre-monsoon and monsoon for AGS and L1; between monsoon and post-monsoon for site KG. In contrast, the sites BG, BHD, DN, KB, KRB and L2 gave significant differences when the 1-ANOVA test was carried out (F= 3.095, 7.400, 15.00, 15.00, 1.591 and 33.095 respectively, with df =2, p<0.01). The post-hoc analysis using Holm-Sidak showed that except for BG and KRB, the remaining sites BHD, DN, KB, and L2 showed significant differences. The considerable differences between the sites and their t or q values for respective seasons are provided in Supplementary Table S7.
Site-wise analysis of DO during different seasonal periods
KWA for the site BHD showed statistically significant differences (H= 14.821, df =2 at p<0.01). Post hoc analysis using the Tukey test detected a significant difference between post-monsoon and monsoon (q= 5.353, p<0.01). For sites AGS, BG, DN, KB, KG, KRB, L1 and L2, the 1-ANOVA analysis showed a significant difference of (F= 168.810, 1086.909, 508.548, 146.955, 239.203, 711.402, 685.523 and 1009.638 respectively, at p<0.01). Post-hoc test using the Holm-Sidak test depicted that all the sites showed significant differences at an overall significant level of p<0.01. The significant differences between the sites and their t or q values for their respective seasons are provided in Supplementary Table S8.
Site-wise analysis of total hardness during different seasonal periods
For site AGS and BHD, the KWA showed a significant difference of H= 15.709 and 15.626, p<0.01). Pairwise Multiple Comparison on ranks using the Tukey test also showed a statistically significant difference between pre-monsoon and monsoon (q= 5.506) at p<0.01. Through 1-ANOVA, it was found that seven of the sites BG, DN, KB, KG, KRB, L1 and L2 showed significant differences (F=259.318, 2498.514, 787.222, 326.550, 1100.931, 3526.515 and 1056.923, df =2, p<0.01). A Holm-Sidak test depicted substantial differences between most of the sampling sites at p<0.01 level between all the three seasonal periods. The significant differences between the sites and their t or q values for their respective seasons are provided in Supplementary Table S9.
Total coliform count by MPN method
For the presence and total count of faecal coliform bacteria in the aquatic environment, the MPN method was applied. All the sampling sites depicted positive results for the presumptive, confirmatory, and completed test. The results of the presumptive test from the bacteriological analysis revealed that the nine sites are contaminated with coliform bacteria. According to the guidelines for drinking water quality by WHO, drinking water must be free of coliform bacteria (0 coliform/100ml). But the results of the presumptive tests showed all nine sites were unsuitable for drinking. Most of the sampling sites showed a high total coliform count seasonally (Supplementary Table S10). During the post-monsoon period, the sampling sites AGS, BG, BHD, DN, KRB and L2 showed a high coliform count (?2400 MPN/100 ml). For sites KG and L1 the MPN index value was found to be 540 MPN/100 ml. Unlike the post-monsoon period, total coliform count during the pre-monsoon period increased in a few more sampling sites. The sites AGS, DN, KB, KRB, L1 and L2 were found to have a count of 2400 MPN/100 ml. For BG and KG the count was 1600 MPN/100 ml and 920 MPN/100 ml, respectively. Whereas during the monsoon period, the scenario changed; there was a decrease in the coliform count in the sampling sites. AGS, BG, DN, KG, and L2 showed a count of 2400 MPN/100 ml. For KB, BHD and L1 the values were 920 MPN/100 ml, 540 MPN/100 ml and 350 MPN/100 ml, respectively.
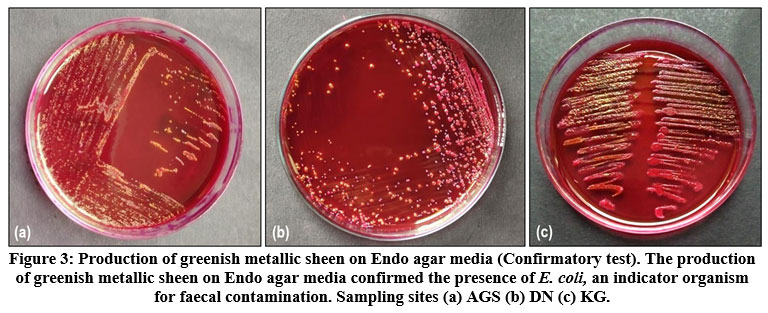
The sites AGS, DN and L2 are used for settlement purposes and receive faecal contamination directly or indirectly from the houses. This indicates that the river water is unsafe and below the standard quality for drinking. During the completed and confirmatory test, it was found that all the sites were contaminated with E. coli. The production of greenish metallic sheen on Endo agar media confirmed the presence of E. coli, an indicator organism for faecal contamination (Figure 3). When isolates from Endo agar were transferred and subjected to Gram staining, they showed well-defined rod-shaped, Gram-negative bacteria. From this present investigation, faecal contamination was found to be widespread in the river.
 | Figure 3: Production of greenish metallic sheen on Endo agar media (Confirmatory test). The production of greenish metallic sheen on Endo agar media confirmed the presence of E. coli, an indicator organism for faecal contamination. Sampling sites (a) AGS (b) DN (c) KG.
|
Conclusions
The above study, a pioneer one, summarizes the seasonal and site-wise variations of physicochemical parameters and potability of Kulik river water. Based on the results, it can be concluded that the river water is unfit for human consumption. The concentration of most of the analyzed parameters showed seasonal fluctuations, and statistical analyses revealed significant differences between the periods and sampling stations. However, the sites with human encroachment and activities showed maximum disturbances reflected in terms of high concentration of free CO2, total alkalinity, total hardness, chloride, and low DO concentration and also the presence of pathogenic faecal coliform bacteria. As this river is considered a lifeline for the entire region and of the Kulik Wildlife Sanctuary and its faunal diversity, this prevailing condition must be controlled; otherwise, it may cause a severe ecological imbalance in the near future.
Acknowledgment
The authors would like to appreciate Mr. Souvik Saha, Mr. Minhaj Ahamed and Mr. Russel Sarkar for their active cooperation during sampling.
Conflict of Interest
The authors declare no conflict of interest.
Funding Sources
The authors received no financial support for the research, authorship, and /or publication of this article.
References
- Melosi MV. Precious Commodity Providing Water for America’s Cities. University of Pittsburgh Press, 2011.
CrossRef - Balasubramanian A. AQUATIC ECOSYSTEMS-FRESHWATER TYPES. 2011.
- Matta G, Rana R, Ashraf J, et al. Analysis of water quality of Paniyala state fish pond with special reference to physico-chemical characteristics. Journal of Comparative toxicology and Physiology 2009; 6: 18-29.
- Nishat B. Rivers Beyond Borders: India Bangladesh Trans-boundary River Atlas. Drik Publications, 2014.
- Roy PB and Sah R. Causes of Temporal Variation in the Arrival of Asian Open Bill Stork Population: A Case Study of Kulik Wildlife Sanctuary, West Bengal, India. Int Res J Environment Sci 2013; 2: 39-43
- Pramanik A, Santra KB and Manna C. Abundance and Diversity of Plants and Animals in the Kulik Bird Sanctuary, Raiganj, West Bengal, India. Journal of Biodiversity 2010; 1. DOI: 10.1080/09766901.2010.11884714.
CrossRef - Roy R. An Introduction to Water Quality Analysis. International Journal for Environmental Rehabilitation and Conservation 2019; IX: 94-100. DOI: 10.31786/09756272.18.9.2.214
CrossRef - Singh J, Yadav P, Pal A, et al. Water Pollutants: Origin and Status. In: Pooja D. KP, Singh P., Patil S. (ed) Sensors in Water Pollutants Monitoring: Role of Material. Springer Singapore, 2020, pp.5-20.
CrossRef - Rama K and Parmanand K. Assessment of aquatic ecological health: a case study of Lake Rewalsar, Himachal Pradesh. Journal of AgriSearch 2020; 7: 12-17.
CrossRef - Javed N, Prajapati D, Singh J, et al. Assessment of Physico-chemical Properties of River Ramganga Water Quality in Moradabad and Bareilly Region of Uttar Pradesh, India. International Journal of Pharmaceutical Science and Research 2020; 11: 5741-5746.
- Sandar S, May Phyo S, Yu S, et al. Bacteriological Examination of Bottled Drinking Water by MPN Method. Saudi J Biol Sci 2019; 4: 227-232. DOI: 10.21276/haya.2019.4.7.2.
- Mohammad M, Krishna P, Lamma O, et al. Analysis of water quality using limnological studies of Wyra reservoir, Khammam district, Telangana, India. International Journal of Current Microbiology and Applied Sciences 2015; 4: 880-895.
- Joshi DM, Kumar A and Agrawal N. Studies on physicochemical parameters to assess the water quality of river Ganga for drinking purpose in Haridwar district. Rasayan journal of chemistry 2009; 2: 195-203.
- Gronewold AD and Wolpert RL. Modeling the relationship between most probable number (MPN) and colony-forming unit (CFU) estimates of fecal coliform concentration. Water Res 2008; 42: 3327-3334. 2008/05/21. DOI: 10.1016/j.watres.2008.04.011.
CrossRef - Jha SN. Chapter 4 - Basic Detection Techniques. In: Jha SN (ed) Rapid Detection of Food Adulterants and Contaminants. San Diego: Academic Press, 2016, pp.107-123.
CrossRef - Colclasure VJ, Soderquist TJ, Lynch T, et al. Coliform bacteria, fabrics, and the environment. Am J Infect Control 2015; 43: 154-158. 2014/12/23. DOI: 10.1016/j.ajic.2014.11.001.
CrossRef - Das D and Ghosh P. Phytodiversity of Raiganj Wildlife Sanctuary (Kulik Bird Sancturay) of Uttar Dinajpur District in West Bengal, India. IOSR-JESTFT 2014; 8: 79-99.
CrossRef - Bose A, Mandal G and Roy Chowdhury I. A Study on Inter-Block Level Regional Disparity Analysis of Uttar Dinajpur District, West Bengal, India. 2020, pp.225-248.
- Roy Chowdhury I. Level of Human Development of Raiganj C.D Block, Uttar Dinajpur District, West Bengal: A Geographical Analysis. 2018.
- Saha S and Mondal P. A Catastrophic Flooding Event in North Bengal, 2017 and its Impact Assessment: A Case Study of Raiganj C.D Block Uttar Dinajpur, West Bengal. 2020.
- Debnath MJ. Evolution and Function of Wetlands in a portion of Raiganj CD Block, Uttar Dinajpur District, West Bengal: A Case Study.
- (SLUSI) SaLUSoI. Inventory of Soil Resources of North Dinajpur District, West Bengal Using Remote Sensing and GIS Techniques, https://slusi.dacnet.nic.in/srm/srmabstracts/SRM_44_North_Dinajpur.pdf (2020).
- Evans TM, Waarvick CE, Seidler RJ, et al. Failure of the most-probable-number technique to detect coliforms in drinking water and raw water supplies. Appl Environ Microbiol 1981; 41: 130-138. 1981/01/01. DOI: 10.1128/aem.41.1.130-138.1981.
CrossRef - Mishra S and Kumar A. Estimation of physicochemical characteristics and associated metal contamination risk in the Narmada River, India. Environmental Engineering Research 2021; 26: 190521-190520. DOI: 10.4491/eer.2019.521.
CrossRef - Rice A, Baird E and Eaton R. APHA 2017 Standard Methods for Examination of Water and Wastewater (Washington: American Public Health Association, American Water Works Association, and Water Env. Federation ISBN). 2017.
- Rompré A, Servais P, Baudart J, et al. Detection and enumeration of coliforms in drinking water: current methods and emerging approaches. J Microbiol Methods 2002; 49: 31-54. DOI: https://doi.org/10.1016/S0167-7012(01)00351-7.
CrossRef - Chandrapati S and Williams MG. TOTAL VIABLE COUNTS | Most Probable Number (MPN). In: Batt CA and Tortorello ML (eds) Encyclopedia of Food Microbiology (Second Edition). Oxford: Academic Press, 2014, pp.621-624.
CrossRef - Cappuccino JG and Sherman N. Microbiology : A laboratory Manual. 10 ed.: Pearson Education Limited., 2014.
- Raut R and Bajracharya SSRM. Seasonal Variation of Water Chemistry of Panch Pokhari: A Case Study of an AlpineL Series in the Central Himalaya. In: Conference Organizing Committee 2014, p.272.
- Chaudhuri K, Manna S, Sarma KS, et al. Physicochemical and biological factors controlling water column metabolism in Sundarbans estuary, India. Aquatic biosystems 2012; 8: 26-26. DOI: 10.1186/2046-9063-8-26.
CrossRef - Bureau of Indian Standards. Drinking Water-Specifications. 2nd ed. New Delhi: BIS, 2012, p. 2-4.
- Ayoade AA and Agarwal N. Preliminary analyses of physical and chemical parameters of Tehri dam reservoir, Garhwal Himalaya, India. Zoology and Ecology 2012; 22: 72-77.
CrossRef - Ayoade A, Agarwal N and Chandola-Saklani A. Changes in physicochemical features and plankton of two regulated high altitude rivers Garhwal Himalaya, India. European Journal of Scientific Research 2009; 27: 77-92.
- Bhateria R and Jain D. Water quality assessment of lake water: a review. Sustainable Water Resources Management 2016; 2: 161-173. DOI: 10.1007/s40899-015-0014-7.
CrossRef - Sharma RC, Singh N and Chauhan A. The influence of physico-chemical parameters on phytoplankton distribution in a head water stream of Garhwal Himalayas: A case study. The Egyptian Journal of Aquatic Research 2016; 42: 11-21. DOI: https://doi.org/10.1016/j.ejar.2015.11.004.
CrossRef - Omer NH. Water Quality Parameters. In: Summers K (ed) Water Quality - Science, Assessments and Policy. IntechOpen, 2019.
- Singh AK and Jayakumar S. Water quality assessment of Kanwar Lake, Begusarai, Bihar, India. Imperial Journal of Interdisciplinary Research 2016; 2: 793-803.
- Taher MES, Ghoneium AM, Hopcroft RR, et al. Temporal and spatial variations of surface water quality in the Nile River of Damietta Region, Egypt. 2021; 193: 128. DOI: 10.1007/s10661-021-08919-0.
CrossRef - Lamma OA and Outhma AM. Analysis of Water Quality (Changes in Physico-chemical Parameters). International Journal of Current Research 2016; 8: 28150-28155.
- Jabbar-Lopez ZK, Craven J, Logan K, et al. Longitudinal analysis of the effect of water hardness on atopic eczema: evidence for gene–environment interaction. Br J Dermatol 2020; 183: 285-293. DOI: https://doi.org/10.1111/bjd.18597.
CrossRef - Guidelines for drinking-water quality: fourth edition incorporating the first addendum.Geneva: World Health Organization. 4th ed. 2017.


