Factor Analysis of Air Pollutants over Hyderabad-A Case Study
Nannaparaju Vasudha1
*
 and Polisetty Venkateswara Rao2
1
Department of Mathematics,
Vasavi College of Engineering,
Hyderabad,
India
2
Department of Physics,
Vasavi College of Engineering,
Hyderabad,
India
http://dx.doi.org/10.12944/CWE.17.2.21
Copy the following to cite this article:
Vasudha. N, Rao. P. V. Factor Analysis of Air Pollutants over Hyderabad-A Case Study. Curr World Environ 2022;17(2). DOI:http://dx.doi.org/10.12944/CWE.17.2.21
Copy the following to cite this URL:
Vasudha. N, Rao. P. V. Factor Analysis of Air Pollutants over Hyderabad-A Case Study. Curr World Environ 2022;17(2).
Download article (pdf)
Citation Manager
Publish History

Introduction
Hyderabad, being a fast-growing metropolitan city has various IT establishments, pharmaceuticals and manufacturing industries. The growth triggered a huge influx of population and thereby resulted in the exponential growth of high-rise buildings and vehicles. In addition, this of the growth enhanced the pollution levels of the city and air pollution in particular. This abnormal rise in air pollutant levels adversely affects the city habitants’ health. There is an immediate need to address this issue to save the environment and humanity.
In nature, air does not have barriers to remain isolated therefore, there is a need to analyze the impact of pollutants on global, national, and local-scale, so that measures can be taken to control the pollution1,2. According to the report of the World Health Organization (WHO) the premature deaths of more than two million people each year are attributed to the effect of air pollution during the 21st century. According to the National Institutes of Health, industrial and photochemical smog are the two major types of air pollution that can create health hazards25.
Urban environments typically have short-range sources of pollution, such as combustion, backup generators, constructions, demolition, and kitchen exhaust1,3,4,5. A complex mixture of organic and inorganic materials called airborne particulate matter (APM) can readily pass through human nose and throat filters, having a significant negative impact on health conditions such as chronic bronchitis, breathing difficulties, heart concerns, and asthma. Many studies have shown that industrial and emissions of vehicles majorly contributed to the atmospheric pollution6,7,8,9.
The air quality over Hyderabad has gradually declined due to the activities of the industrial and transport sectors10. The source contribution of particulate matter over Hyderabad was quantified, using a chemical mass balance receptor model, and reported that more than 60 % of pollution was dominated by vehicular exhaust and road dust11.
A statistical technique called factor analysis is employed to reduce the dimensions of the underlying components by linearly combining them into variables. In this paper, an attempt was made to highlight the major air pollutant contributors at different locations, including residential and industrial areas in Hyderabad by grouping them into factors.
Literature Survey
A simple statistical method-based Air Quality Index (AQI) has been proposed by12, 13 to address using Principal Component Analysis (PCA) employing the SPSS 10.0 software, the New Air Quality Index (NAQI) was created. Utilizing concentration of each pollutant's hourly average, the NAQI and AQI have been calculated. Indices thus calulated were also used to rate the seasons according to their air pollution levels. In proportional terms, a higher index value denotes greater pollution. The indices were also used to rate the seasons according to their air pollution levels. In proportional terms, a higher index value denotes greater pollution. Additionally, the index can be used to compare the amounts of daily and seasonal pollution at various sites.
The source of pollution caused by heavy metal was determined in the Zlatibor ecosystem in Serbia. Enrichment factor analysis and multivariate statistics were utilized by14 to calculate the source contribution to the pollution of areas far from industries. The seven heavy metals Cu, Cr, Cd, Ni, Mn, Zn and Pb quantified by atomic absorption spectrometry in samples of topsoil and moss. The outcomes of two statistical methods of multivariate analysis on the mosses; enrichment factor analysis, cluster analysis and principal component analysis identified the distinction between human-caused and lithologic origins of the heavy metals. In order to determine how human activities affected the amount of metal in moss, enrichment factors were examined.
From November 2003 to November 2004, areas in a Kolkata metropolitan area that were both residential (Kasba) and industrial (Cossipore) were observed for ambient PM10 levels by15. These locations were chosen for their level of anthropogenic activity. An inductively coupled plasma atomic emission spectrometer was used to identify the metal components of atmospheric PM10 deposited on glass fibre filter paper (ICP-AES). Seven dangerous trace elements like Cr, Zn, Pb, Cd, Ni, Mn, and Fe were found in the measured PM10 concentrations. To evaluate impact of air masses on wind speed, temperature, rainfall, relative humidity etc., a concurrent meteorology study was conducted. Major contributors of the PM10 have been identified using factor analysis.
In order to understand how the self perceives danger from environmental dangers, psychologists16 established the psychological components of ecological risk perception. Factor analysis was used to create a 20-item measure with three subscales using 159 university students’ responses on the scale of 26-items of perceived dangers in environment that was an adaption of the Environmental Appraisal Inventory (EAI) 17. The subscales, which were the first to be built on the EAI, reflected natural, technical, and human hazards. The psychometric characteristics of the tools and cultural variations in hazard identification are explored.
The correlation between indoor and outdoor (I/O) airborne contaminants, as well as the identification of the most likely season-specific source of contamination (winter, summer, rainy). I/O ratios were determined while concurrent measurements of air pollutants by18 were being made. Average ratios of winter with summer and winter with monsoon were computed to look at how the seasons affect both interior and outdoor air quality. To learn more about how outdoor concentrations of air pollution affect indoor concentrations, regression analysis was used. Using principal-component analysis, the kinds of sources for these pollutants that are most likely to exist have been found. Some actions are also suggested in light of this study's findings.
Materials and Methods
Daily data of ten major air pollutant components (Particulate matter, CO, O3, NOX, NH3, SO2, Benzene, Toluene, Xylene) was downloaded from the Kaggle website (https://www.kaggle.com/docs/datasets) for the period of 30 months (January 2018 to June 2020). Table 1 gives the significance of the localities under the study.
Table 1: Details of localities under the study.
S. No | Name | Significance of locality |
1 | Bollaram Industrial Area, Hyderabad | Industrial Area |
2 | Central University, Hyderabad | Residential Area |
3 | ICRISAT Patancheru, Hyderabad | Industrial cum Residential |
4 | IDA Pashamylaram, Hyderabad | Industrial Area |
5 | Zoo Park, Hyderabad | Industrial cum Residential |
Significant outliers were removed from the data before the analysis. The details of pollutant components studied for the purpose are given in Table-2
Table 2: Details of the air pollutants.
Air Pollutants | Abbreviation | Units of Measurements |
Particulate Matter 2.5 | PM2.5 | micro gram/meter3 |
Particulate Matter 10 | PM10 | micro gram/meter3 |
Nitric Oxide | NOx | micro gram/meter3 |
Ammonia | NH3 | micro gram/meter3 |
Sulfur dioxide | SO2 | micro gram/meter3 |
Carbon monoxide | CO | milli gram/meter3 |
Ozone | O3 | micro gram/meter3 |
Benzene | Benzene | micro gram/meter3 |
Toluene | Toluene | micro gram/meter3 |
Xylene | Xylene | micro gram/meter3 |
Karl Pearson's correlation coefficient was used to correlate the pre-processed data from the five places, and the results are shown in Tables 3a through 3e, respectively. The majority of the variables, which have been bolded for emphasis, are found to be moderate to highly correlated according to the correlation matrix.
Table3a: Correlation matrix of air pollutants at Bollaram.
| PM 2.5 | PM 10 | NOx | NH3 | CO | SO2 | O3 | Benzene | Toluene | Xylene |
PM 2.5 | 1 | .843** | .339** | -.114** | .616** | -.110** | .410** | .142** | .161** | .227** |
PM 10 |
| 1 | .473** | .033 | .590** | .043 | .432** | .258** | .262** | .344** |
NOx |
|
| 1 | .228** | .415** | .362** | .361** | .233** | .188** | .317** |
NH3 |
|
|
| 1 | -.024 | .414** | -.063 | .451** | .360** | .129** |
CO |
|
|
|
| 1 | -.048 | .399** | .136** | .092** | .340** |
SO2 |
|
|
|
|
| 1 | .162** | .245** | .197** | .085* |
O3 |
|
|
|
|
|
| 1 | .019 | -.101** | .223** |
Benzene |
|
|
|
|
|
|
| 1 | .740** | .415** |
Toluene |
|
|
|
|
|
|
|
| 1 | .443** |
Xylene |
|
|
|
|
|
|
|
|
| 1 |
Table3b: Correlation matrix of air pollutants at HCU
| PM 2.5 | PM 10 | NOx | NH3 | CO | SO2 | O3 | Benzene | Toluene | Xylene |
PM 2.5 | 1 | .902** | .688** | .550** | .498** | .513** | .494** | .524** | .462** | .461** |
PM 10 |
| 1 | .709** | .521** | .503** | .600** | .581** | .583** | .552** | .508** |
NOx |
|
| 1 | .579** | .522** | .553** | .344** | .658** | .619** | .608** |
NH3 |
|
|
| 1 | .193** | .258** | .281** | .354** | .307** | .324** |
CO |
|
|
|
| 1 | .301** | .506** | .576** | .524** | .545** |
SO2 |
|
|
|
|
| 1 | .402** | .564** | .570** | .443** |
O3 |
|
|
|
|
|
| 1 | .575** | .513** | .559** |
Benzene |
|
|
|
|
|
|
| 1 | .944** | .898** |
Toluene |
|
|
|
|
|
|
|
| 1 | .835** |
Xylene |
|
|
|
|
|
|
|
|
| 1 |
Table 3c: Correlation matrix of air pollutants at ICRISAT
| PM 2.5 | PM 10 | NOx | NH3 | CO | SO2 | O3 | Benzene | Toluene | Xylene |
PM 2.5 | 1 | .907** | .748** | .316** | .780** | .313** | .158** | .041 | .230** | .226** |
PM 10 |
| 1 | .769** | .320** | .774** | .410** | .252** | .094** | .284** | .290** |
NOx |
|
| 1 | .251** | .816** | .290** | .065 | .202** | .433** | .366** |
NH3 |
|
|
| 1 | .317** | .159** | .160** | .174** | .097** | .110** |
CO |
|
|
|
| 1 | .213** | .195** | .171** | .370** | .369** |
SO2 |
|
|
|
|
| 1 | .260** | -.042 | -.113** | .013 |
O3 |
|
|
|
|
|
| 1 | .023 | .071* | .101** |
Benzene |
|
|
|
|
|
|
| 1 | .382** | .252** |
Toluene |
|
|
|
|
|
|
|
| 1 | .615** |
Xylene |
|
|
|
|
|
|
|
|
| 1 |
Table 3d: Correlation matrix of air pollutants at Pashmylaram.
| PM 2.5 | PM 10 | NOx | NH3 | CO | SO2 | O3 | Benzene | Toluene | Xylene |
PM 2.5 | 1 | .923** | .379** | .110** | .361** | .513** | .405** | .535** | .505** | .297** |
PM 10 |
| 1 | .405** | .149** | .333** | .541** | .343** | .557** | .542** | .403** |
NOx |
|
| 1 | .141** | .162** | .330** | .114** | .328** | .364** | .335** |
NH3 |
|
|
| 1 | .247** | .091** | .002 | -.043 | .009 | .064 |
CO |
|
|
|
| 1 | .163** | .374** | .061 | .073* | .030 |
SO2 |
|
|
|
|
| 1 | .235** | .612** | .632** | .437** |
O3 |
|
|
|
|
|
| 1 | .046 | .010 | -.132** |
Benzene |
|
|
|
|
|
|
| 1 | .944** | .647** |
Toluene |
|
|
|
|
|
|
|
| 1 | .715** |
Xylene |
|
|
|
|
|
|
|
|
| 1 |
Table 3e: Correlation matrix of air pollutants at Zoo Park
| PM 2.5 | PM 10 | NOx | NH3 | CO | SO2 | O3 | Benzene | Toluene | Xylene |
PM 2.5 | 1 | .930** | .715** | .394** | .695** | .309** | .212** | .414** | .317** | .200** |
PM 10 |
| 1 | .748** | .432** | .723** | .472** | .280** | .481** | .383** | .244** |
NOx |
|
| 1 | .486** | .700** | .439** | .172** | .402** | .371** | .184** |
NH3 |
|
|
| 1 | .538** | .516** | .298** | .258** | .281** | .226** |
CO |
|
|
|
| 1 | .574** | .195** | .366** | .320** | .228** |
SO2 |
|
|
|
|
| 1 | .244** | .371** | .377** | .314** |
O3 |
|
|
|
|
|
| 1 | .247** | .230** | .134** |
Benzene |
|
|
|
|
|
|
| 1 | .915** | .768** |
Toluene |
|
|
|
|
|
|
|
| 1 | .738** |
Xylene |
|
|
|
|
|
|
|
|
| 1 |
** Correlation is significant at the 0.01 level (2-tailed).
KMO and Bartlett's Test were initially used to assess the data's suitability for factor analysis. It was discovered that a KMO value of >0.5 is suitable and acceptable. According to Bartlett's test, the correlation matrix is considerably distinct from the identity matrix, which is consistent with the matrix's factorability (Sig. 0.001 for Bartlett's test).
In factor analysis, we assume that the variable is generated from a factor. Suppose there are p variables and m < p factors represented by ƒ1, ƒ2 ….., ƒm. Then for a variable yi , i = 1,2, ….p , the model is
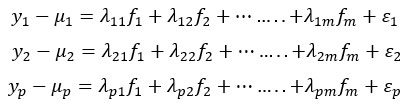
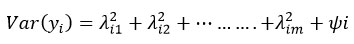
The factor loading indicates the importance of factor j to variable i. Although the factors are unknown, they are also considered random variables, and in the model we have E( ƒi ) = 0, Var(ƒi) = 1, Cov(ƒi, ƒj) = 0 So the factors are assumed to be independent. The model also assumes E(?i) = 0, Var(?i) = In other words, the error terms differ for each variable and it is assumed that Cov(?i , ƒj ) = 0 and Cov(?i , ?j) = 0. Hence variance of each variable yi , i = 1,2, ….p.
Results and Discussions
For data reduction, factor analysis using the Varimax approach was used. Table-4 compiles the five stations' rotated factor matrix.
Table 4: Rotated Factor Matrix of 5 Stations.
| Bollaram | HCU | ICRISAT | Pashmylaram | Zoo Park | |||||||||
| Factor | Factor | Factor | Factor | Factor | |||||||||
1 | 2 | 3 | 1 | 2 | 1 | 2 | 3 | 1 | 2 | 3 | 1 | 2 | 3 | |
PM 2.5 | .859 | .140 | -.191 | .316 | .858 | .921 | .024 | .167 | .553 | .703 | .114 | .905 | .150 | .030 |
PM 10 | .858 | .251 | -.002 | .419 | .821 | .898 | .085 | .283 | .617 | .627 | .169 | .892 | .205 | .184 |
NOx | .561 | .118 | .563 | .487 | .700 | .876 | .270 | .049 | .478 | .153 | .382 | .850 | .165 | .152 |
NH3 | -.159 | .462 | .609 | .051 | .784 | .237 | .161 | .508 | -.037 | .025 | .902 | .440 | .089 | .633 |
CO | .792 | .109 | -.044 | .633 | .251 | .856 | .255 | .148 | -.007 | .652 | .412 | .826 | .118 | .271 |
SO2 | -.021 | .078 | .875 | .495 | .451 | .344 | -.276 | .580 | .690 | .324 | .000 | .418 | .254 | .632 |
O3 | .671 | -.230 | .300 | .615 | .304 | -.013 | .096 | .825 | -.083 | .849 | -.147 | -.027 | .087 | .792 |
Benzene | .081 | .864 | .196 | .922 | .255 | -.040 | .688 | .157 | .919 | .095 | -.107 | .276 | .917 | .109 |
Toluene | .036 | .904 | .078 | .904 | .201 | .257 | .829 | -.072 | .943 | .048 | -.033 | .196 | .916 | .147 |
Xylene | .377 | .572 | .056 | .892 | .223 | .255 | .738 | .019 | .809 | -.172 | .134 | .055 | .893 | .117 |
% of Variance | 30.44 | 22.71 | 16.3 | 40.02 | 30.3 | 34.62 | 19.62 | 14.37 | 37.88 | 20.02 | 12.23 | 35.06 | 26.62 | 16.06 |
Cumulative % | 30.44 | 53.15 | 69.45 | 40.02 | 70.32 | 34.62 | 53.24 | 67.61 | 37.88 | 57.9 | 70.13 | 35.06 | 61.68 | 77.74 |
From Table-4 three factors are extracted from ten pollutant components at Bollaram, ICRISAT, Pashmylaram and Zoo Park but two factors were extracted at HCU as it is purely residential area with greenery resulting low pollution levels. Cumulative variability contributed by 10 pollutant components at Bollaram was 69.45%, at HCU was 70.32%, at ICRISAT was 67.61%, at Pashmylaram and at Zoo Park amounted to 70.13% and 77.74% of the total variability respectively. Rotation effectively preserves the cumulative percentage of variation, and the spread of variation is evenly distributed among the factors. The resulted factors are summarized in Table-5.
Table 5: Summary of resulted factors.
| Bollaram | HCU | ICRISAT | Pashmylaram | Zoo Park |
1 | PM2.5, PM10, CO, O3 | CO, SO2, O3, Benzene, Toluene, Xylene | PM2.5, PM10, NOx, CO | NOx, SO2, Benzene, Toluene, Xylene | PM2.5, PM10, NOx, CO |
2 | Benzene, Toluene, Xylene | PM2.5, PM10, NOx, NH3 | Benzene, Toluene, Xylene | PM2.5, PM10, CO, O3 | Benzene, Toluene, Xylene |
3 | NH3, NOx, SO2 |
| NH3, SO2, O3 | NH3 | NH3, SO2, O3 |
According to a report released by Telangana Pollution Control Board in 201919, Bollaram houses 26 Bulk Drug & Pharmaceutical Industries, out of the 17 industries are categorized as high pollution causing. Traffic contributes 25% of the urban ambient particulate matter pollution, and industrial activities contribute 15%20. The contribution of variability by PM2.5, PM10, CO and O3 is 30.44% of the total indicating that industries and traffic are the major contributors to air pollution in Bollaram. Volatile organic compounds (VOCs) are generally derived from benzene and a sub-group of this family of compounds. VOCs are the second-highest contributors amounting to 22.71% of the total variability due to the presence of pharmaceutical industries21. It was observed that NH3, NOx and SO2 have contributed 16.3% variance to the pollution contributed by vehicles10.
The air pollution at HCU rose due to its proximity to the IT corridor. As there is increase in the high-rise gated communities and vehicular traffic. The major variability of 40.02% at HCU is contributed by VOCs, CO, SO2 and O3. As most of the domestic heating systems release VOCs, they are the most common pollutant found in urban residential areas22. Variability of PM2.5, PM10, NOx and NH3 is 30.3% of the total due to construction activity and vehicular pollution.
PM2.5, PM10, NOx and CO are the highest contributors amounting to 34.62% of the variance at ICRISAT. Pollution generated by vehicular traffic and industry emissions is the major contributor. Also being a residential area the second highest contributor to atmospheric pollution is VOCs amounting to 19.62% of the total variance due to motor vehicles with internal combustion engines22,24. These large amounts of VOCs prohibit atmospheric ozone to decompose and hence a large amount of O3 along with NH3 and SO2 contributes to 14.37% of the variance.
Pashmylaram is a hub of chemical and pharmaceutical industries. Air pollutants generated by pharmaceutical industries predominantly constitute VOCs along with sulphur dioxide, nitrogen oxide, etc.21 and it was observed that VOCs, NOx and SO2 contribute to 37.88% of the total variation. Major chemical pollutants released in the air are in the form of smog with air-borne particulate matter23. It is evident from particulate matter PM2.5, PM10along with CO and O3 contributing to 20.02% of the total variance. It can be noted that the contribution of NH3 is 12.23% to the total variability as major sources of NH3 emissions in urban areas are due to industrial processes and vehicular emissions26.
35.06% of the total variability is contributed by the air pollutants PM2.5, PM10, NOx and CO at Zoo Park. This huge contribution can be attributed to Zoo Park being Industrial cum Residential area. Due to the dense population, VOCs are the second-highest contributors to the total variance, accounting for 26.62% of it. These emissions are caused by a variety of indoor sources, such as building materials, consumer products (fragrances, air fresheners), occupant activities (cleaning), and smoking27. NH3, SO2 and O3 contribute 16.06% of the total variability. The percentage of variance is depicted in Figure-1 indicates the dominance of different air pollutants at different localities. This figure helps to understand the number of factors and their percentage of contribution to air pollution at different locations. In addition, it also gives information of the air pollutants making up these factors, thereby one can understand the type of the pollutants affecting the individual residing in that locality. It was observed from Figure 1, that Zoo Park and ICRISAT which are industrial cum residential areas have same pollutants grouped into factors.
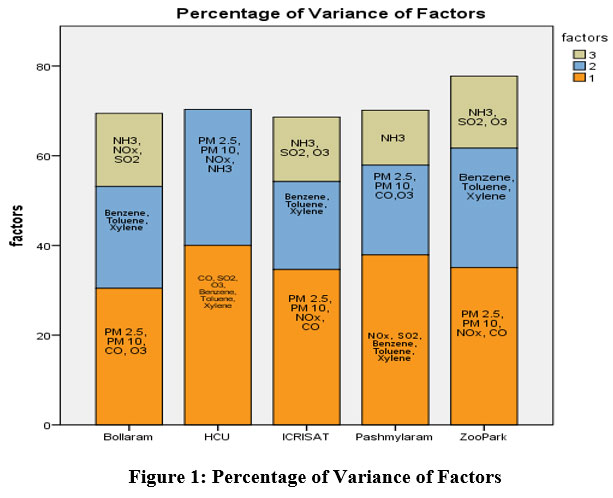 | Figure 1: Percentage of Variance of Factors.
|
Conclusion
It is clear from the current study that factor analysis was successful in simplifying the complexity of air pollution by effectively combining the 10 main air pollutants into fewer variables. According to the locality's characteristics, it was seen that the same set of variables was grouped into factors (factors consisting of similar variables are highlighted in bold in Table 5). Industrial cum Residential areas are found to have the same pollutants grouped into 3 factors. However, the residential area had two factors indicating a low level of air pollution. In both industrial and residential regions that are dominated by the chemical industry, VOCs are determined to be a factor one contributor.
The interdependency between air pollutants was very well brought in the form of factors which helps to reduce the overall pollution by reducing any one component in that factor. The authorities concerned can focus on economical and feasible measures to reduce air pollution. This study also helps to identify the major air pollutant contributors and hence implement appropriate measures depending on the locality to reduce the pollution levels and thereby improve the health of an individual.
Acknowledgment
The authors would like to express their heart felt gratitude to the Vasavi College of Engineering management, Hyderabad, India. Kaggle database for making the data available to users is acknowledged.
References
- Cichowicz R and Wielgosi?ski G. Effect of meteorological conditions and building location on CO2 concentration in the university campus. Ecological Chemistry and Engineering. 2015a; 22(4): 513–525. https://doi.org/10.1515/eces-2015-0030.
CrossRef - Ménard R, Deshaies-Jacques M and Gasset N. A comparison of correlation-length estimation methods for the objective analysis of surface pollutants at Environment and Climate Change Canada. Journal of the Air & Waste Management Association. 2016; 66(9): 9874–9895. https://doi.org/10.1080/10962247.2016.1177620
CrossRef - Gurney K. R, Razlivanov I, Song Y, Zhou Y, Benes B and Massih M. A. Quantification of fossil fuel CO2 emissions on the building/street scale for a large U.S. City. Environmental Science & Technology. 2012; 46(21): 12194–12202. 10.1021/es3011282
CrossRef - Lelieveld J, Evans J. S, Fnais M, Giannadaki D and Pozzer A. The contribution of outdoor air pollution sources to premature mortality on a global scale. Nature. 2015; 525: 367–371. 10.1038/nature15371
CrossRef - Nemitz E, Hargreaves K.J, McDonald A. G, Dorsey J. R and Fowler D. Micrometeorological measurements of the urban heat budget and CO2 emissions on a city scale. Environmental Science & Technology. 2002; 36(14): 3139–3146. 10.1021/es010277e
CrossRef - Kumar A.M. C, Kumar P.V and Rao P.V. Temporal Variations of PM2.5and PM10 Concentration over Hyderabad. Nature Environment and Pollution Technology. 2020; 19(5): 1871–1878. https://doi.org/10.46488/NEPT.2020.v19i05.011
CrossRef - Zhang K, Zhao C, Fan H, Yang Y and Sun Y. Toward understanding the differences of PM2.5 characteristics among five China urban cities. Asia-Pacific J. Atmos. Sci. 2019; 56(4): 493–502. 10.1016/j.scitotenv.2020.140214
CrossRef - Zhao C, Wang Y, Shi X, Zhang D, Wang C, Jiang J.H, Zhang Q and Fan H. Estimating the contribution of local primary emissions to particulate pollution using high-density station observations. J. Geophys. Res. Atmos. 2019; 124(3): 1648–1661. 10.1029/2018JD028888
CrossRef - Singh V, Biswal A, Kesarkar A.P, Mor S and Ravindra K. High resolution vehicular PM10 emissions over megacity Delhi: relative contributions of exhaust and non-exhaust sources. Sci. Total Environ. 2020a; 699: 134273. 10.1016/j.scitotenv.2019.134273
CrossRef - Guttikunda, S. K. and Ramani, V. K. 2014. Source emissions and health impacts of urban air pollution in Hyderabad, India. Air Qual Atmos Health, 7(2):195–207. https://doi.org/10.1007/s11869-013-0221-z
CrossRef - Rao P.V, Rao K, Raveendhar N, and Swamy A.V.V.S. Status of Air Pollution in Hyderabad City, Telangana State. International Journal of Innovative Research in Science, Engineering and Technology2016; 5(4): 4769 – 4780. https://www.ijirset.com/upload/2016/april/23_STATUS.pdf
- Bezuglaya, E.Yu., Shchutskaya, A.B. and Smirnova, I.V. (1993). Air Pollution Index and Interpretation of Measurements of Toxic Pollutant Concentrations. Atmos. Environ. 27: 773-779
CrossRef - Bishoi, Biswanath & Prakash, Amit & Jain, Vijay. (2009). A Comparative Study of Air Quality Index Based on Factor Analysis and US-EPA Methods for an Urban Environment. Aerosol Air Qual Res. 9. 1-17.
CrossRef - Dragovi?, S., Mihailovi?, N. Analysis of mosses and topsoils for detecting sources of heavy metal pollution: multivariate and enrichment factor analysis. Environ Monit Assess 157, 383–390 (2009). https://doi.org/10.1007/s10661-008-0543-8
CrossRef - Karar, Kakoli & Gupta, A.K. & Kumar, Animesh & Biswas, Arun. (2006). Characterization and Identification of the Sources of Chromium, Zinc, Lead, Cadmium, Nickel, Manganese and Iron in Pm10 Particulates at the Two Sites of Kolkata, India. Environmental monitoring and assessment. 120. 347-60. 10.1007/s10661-005-9067-7.
CrossRef - WALSH-DANESHMANDI, ANNE & Maclachlan, Malcolm. (2000). Environmental Risk to the Self: Factor Anaysis and Development of Subscales for the Environmental Appraisal Inventory (EAI) with an Irish Sample. Journal of Environmental Psychology. 20. 141-149. 10.1006/jevp.1999.0158.
CrossRef - Schmidt, F. N. & Gifford, R. (1989). A dispositional approach to hazard perception: preliminary development of the Environmental Appraisal Inventory. Journal of Environmental Psychology, 9, 57-67.
CrossRef - Taneja, Ajay & Saini, Renuka & Masih, Amit. (2008). Indoor Air Quality of Houses Located in the Urban Environment of Agra, India. Annals of the New York Academy of Sciences. 1140. 228-45. 10.1196/annals.1454.033.
CrossRef - Telangana Pollution Control Board in 2019. Action Plan for the restoration of environmental qualities with regard to the identified polluted industrial cluster of Patencheru-Bollaram; (https://cpcb.nic.in/ industrial_pollution/ New_Action_Plans/ CEPI_Action %20 Plan Patancheru-Bollaram.pdf)
- Karagulian F, Claudio A. B, Carlos Francisco, Dora C, Annette M. Prüss-Ustün, Bonjour S, Rohani H. A, and Amann M. Contributions to cities' ambient particulate matter (PM): A systematic review of local source contributions at global level. Atmospheric Environment. 2015; 120: 475-483. https://doi.org/10.1016/j.atmosenv.2015.08.087.
CrossRef - Yaqub G, Hamid A and Iqbal S. Pollutants Generated from Pharmaceutical Processes and Microwave Assisted Synthesis as Possible Solution for Their Reduction - A Mini Review. Nature Environment and Pollution Technology.2012; 11(1): 29-36.
- Mar? M, Namie?nik J and Zabiega?a B. BTEX concentration levels in urban air in the area of the Tri-City agglomeration (Gdansk, Gdynia, Sopot), Poland. Air Qual. Atmos. Health. 2014; 7: 489–504. https://doi.org/10.1007/s11869-014-0247-x
CrossRef - Naidu R, Biswas B, Ian R. W, Cribb J, Singh B. K, Nathanail C. P, Coulon F, Semple K. T, Jonesi K. C, Barclay A and AitkenR. J. Chemical pollution: A growing peril and potential catastrophic risk to humanity. Environment International. 2021; 156. https://doi.org/10.1016/j.envint.2021.106616.
CrossRef - Khandar, C., & Kosankar, S. (2014). A review of vehicular pollution in urban India and its effects on human health. Journal of Advanced Laboratory Research in Biology, 5(3), 54–61. Retrieved from https://e-journal.sospublication.co.in/index.php/jalrb/article/view/187
- Cai H, Wang C. Surviving with Smog and Smoke: Precision Interventions? Chest. 2017 Nov;152(5):925-929. doi: 10.1016/j.chest.2017.06.030. Epub 2017 Jul 8. PMID: 28694198; PMCID: PMC5812760.
CrossRef - Behera SN, Sharma M, Aneja VP, Balasubramanian R. Ammonia in the atmosphere: a review on emission sources, atmospheric chemistry and deposition on terrestrial bodies. Environ Sci Pollut Res Int. 2013 Nov;20(11):8092-131. doi: 10.1007/s11356-013-2051-9. Epub 2013 Aug 28. PMID: 23982822.
CrossRef - Dimitrios Kotzias. Built environment and indoor air quality: The case of volatile organic compounds[J]. AIMS Environmental Science, 2021, 8(2): 135-147. doi: 10.3934/environsci.2021010
CrossRef


