Land Use/Cover Mapping and Change Detection Using Remote Sensing Techniques: A Case of Upper Kullu Valley, Himachal Pradesh.
Vivek Negi
 and Mohammad Irfan
1
Department of Geography,
Panjab University,
Chandigarh,
India
http://dx.doi.org/10.12944/CWE.17.2.13
Copy the following to cite this article:
Negi V, Irfan M. Land Use/Cover Mapping and Change Detection Using Remote Sensing Techniques: A Case of Upper Kullu Valley, Himachal Pradesh. Curr World Environ 2022;17(2). DOI:http://dx.doi.org/10.12944/CWE.17.2.13
Copy the following to cite this URL:
Negi V, Irfan M. Land Use/Cover Mapping and Change Detection Using Remote Sensing Techniques: A Case of Upper Kullu Valley, Himachal Pradesh. Curr World Environ 2022;17(2).
Download article (pdf)
Citation Manager
Publish History

Introduction
The land use/cover change is one of the most important components in planning and strategies for natural resource management and monitoring.1 Land cover refers to the biophysical condition of a region and land use is the human modification of land to meet their resource needs.2 The recent period has seen exponential increase of human influence on land as a result of accelerated population growth leading to changes in the land cover.3 These changes in land use/cover have multiple implications on global environment,4,5 including biodiversity loss, soil degradation and change in hydrological processes at global as well as local level.2,6 Therefore, it is necessary to understand these processes in a temporal context.7
Recently, large number of studies have been done to understand the pattern of LULC change, its drivers and impact on nature as well as human.8 The remote sensing technology has been widely used to analyse land use dynamics due to its vast area coverage, resolution and database.9 Remote sensing, in contrast to the conventional methods, provides useful information instantly at a very low cost,3 while GIS offers a flexible environment for presenting, storing and evaluating digital data.10 From the early 1970s, the satellite images of Lansat Programs have remained vital dataset for remote sensing technology that is widely used by scientist to analyse land use/cover change.11 The images provide significant spatial and spectral resolution with wide areal and temporal extent. The remote sensing technology integrated with Geographical Information System (GIS) has resulted into regular and consistent monitoring of land use/cover pattern.12 In India, various researchers have analysed land use/cover change in the GIS environment with the help of remotely sensed data.13,14,15,16 The western Himalayan region has also been explored to examine the land use/cover dynamics and their imprints on forest ecology, hydrological setup, extreme natural events and local climatic behaviour.17,18,19,20,21
The present study is an attempt to analyse land use/cover dynamics in the Western Himalayan region using satellite images and GIS applications. The Upper Kullu Valley has witnessed increasing growth of horticulture, tourism and related developments in the past 50 years. However, the traces of these developments were fully visible only after 1991 where construction activities had taken place to a large extent. The previous studies done on this region shows that change in LULC have resulted into increase in natural hazards, hydrological disturbances and natural resource depletion affecting the environmental sustainability of the region.17,18 The high degree of horticultural development and urbanisation call for systematic assessment of land use pattern in these Himalayan regions. Therefore, the main objective of this paper is to examine the changing pattern of land use/cover in the period of 1991-2020 using Landsat images and change detection analysis.
Material and Method
Study Area
The Upper Kullu Valley lies in the Kullu district of Himachal Pradesh. With an area of 990.09 Km2, the study area is extended between 32° 3' 10" N - 32° 24' 56" N and 76° 58' 44" E - 77° 23' 32" E covering whole Manali tehsil and a small portion of Kullu tehsil in the district (Fig. 1). The basin has a minimum elevation of 1358 meters at the base of Beas River and maximum elevation of 5500 in the mountains. Most of the area is covered with two major rock types i.e., biotite schist with foliated micaceous quartzite and fine-grained banded gneiss. The four distinctive geomorphological characteristics of the study area are highly and moderately dissected structural hills and valleys, younger alluvial plain and snow cover. The vegetation cover is occupied by the forests of pine and cedars on the higher slopes while lower valley is abundant with alder and poplar forests. The gentle slopes along the river form terrace fields used for agricultural and horticultural activities. The settlements in the higher altitude are located in the cluster form while settlements along the river show linear pattern. The only urban settlement lies on the northern side of the region covering 3 km2 of the area. The diverse natural conditions and growing urbanisation create opportunity to monitor the changing pattern of land use/cover in the study area.
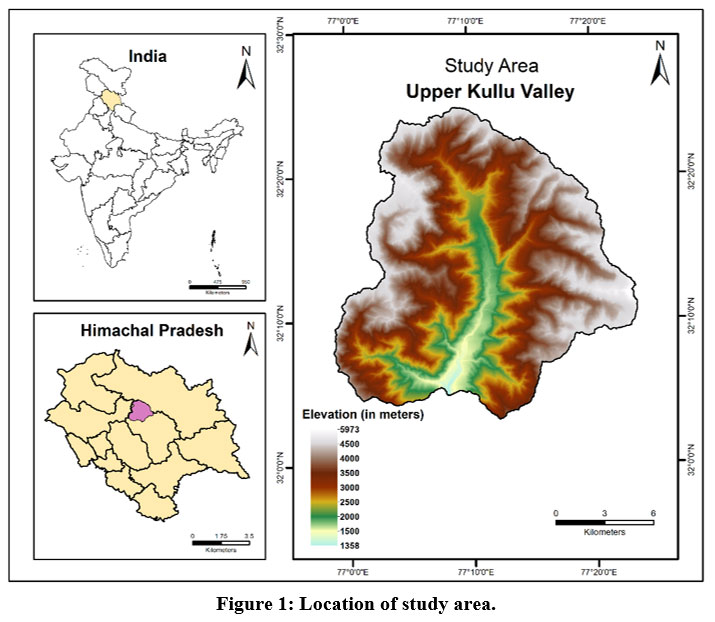 | Figure 1: Location of study area. Click here to view Figure |
Data collection and Data Processing
In order to analyse the land use/cover change in the Upper Kullu Valley, three multispectral satellite images that is Landsat 5 (TM), Landsat 7 (ETM+) and Landsat 8 were accessed from USGS for the time period 1991, 2005 and 2020 respectively. The spatial resolution of visible bands for all the images are 30 meters while spatial resolution of panchromatic band for 2005 and 2020 images are 15 meters which provides detailed in-depth information. In order to reduce the effect of cloud cover, all images are collected for the month of October/November. The specifications of the satellite data are given in the table 1. In addition to the satellite images, some ancillary data were also collected including topographical sheets (1:50000) and digital elevation model (DEM). The digital elevation is used to avoid misclassification of agricultural/horticultural land above 2600 meters from the mean sea level.
Table 1: Details of satellite data used in the study.
Year | Satellite/Sensor | Acquisition date | Path/Row | Spatial Resolution | Source |
1991 | Landsat 5 (TM) | 16/11/1991 | 147/38 | 30 | USGS |
2005 | Landsat 7 (ETM+) | 13/10/2005 | 147/38 | 30 | USGS |
2020 | Landsat 8 (OLI/TIRS) | 14/10/2020 | 147/38 | 30 | USGS |
Source: Landsat 5 (TM), Landsat 7 (ETM+) and Landsat 8 (OLI/TIRS); USGS.
The delineated classes were snow cover, forest, agricultural/horticultural land, built-up area, sandy surface, water and barren area. Each land use/cover was assigned unique identity by assigning training samples for different images. The signatures generated from training samples were used to train the classifier. The images were classified by applying maximum likelihood algorithm which is the most commonly used method for image processing.22 After the LULC classification, both maps were compared to analyse the changes in the land use/cover type. The post processing was also done to show the LULC dynamics during the period of 1991-2020. In order to maintain the similar resolution, the images of 2005 and 2020 were resampled to 30 meters with nearest neighbour algorithm. By using the change detection technique, a transition matrix was prepared to display the distribution and magnitude of change in LULC classes.
Results and Discussion
The land use/cover pattern of years 1991, 2005 and 2020 are shown in Figures respectively. The distribution of different classes is presented in Table 2 and magnitude of LULC change is given in Table 3.
Land use/cover pattern in 1991
The land use/cover map of 1991 is drawn from Landsat 5 (TM) divided into eight major categories (Fig. 2). The land use/cover of 1991 was characterised by the predominance of forest and pasture land with small area for cultivation and settlements due to the steep and rugged topography. The largest part of the study area was occupied by forest cover 347.39 Km2 constituting35.09 per cent of the total area. The forest cover mainly included forests of deodar and pine at the higher elevation and trees of alder and poplar at the lower elevation along the river and small tributaries. The area under pasture/open land was 256 Km2 covering (25.93 per cent) of the study area followed by snow cover (202.30 Km2) and barren land (119.50 Km2) that covered 20.43 per cent and 12.07 per cent of the study area. Snow cover was stretched in both side of the valley above 3000 meters above mean sea level. The water body and sandy surface covered 0.78 Km2 and 2.42 Km2 respectively. The agricultural land occupied 53.95 Km2 (5.45 per cent) of the study area. The low-lying river terraces were used for cultivation with a maximum elevation of 2700 meters from MSL. The built-up land occupied 6.99 Km2 (0.71 per cent) of the study area situated along the river and its tributaries. The traditional settlements were mostly clustered at the higher elevation while some settlements along the river and roads were organised in linear form. The LULC of 1991 showed the dominance of natural cover with less impact of anthropogenic activities.
Table 2: Land Use/Cover Pattern (1991-2020).
| 1991 | 2005 | 2020 | |||
LULC Classes | Area (Km²) | Areas (%) | Area (Km²) | Areas (%) | Area (Km²) | Areas (%) |
Agricultural/Horticultural Land | 53.95 | 5.45 | 55.14 | 5.57 | 82.20 | 8.30 |
Barren Land | 119.50 | 12.07 | 139.65 | 14.11 | 239.10 | 24.15 |
Built-up land | 6.99 | 0.71 | 8.40 | 0.85 | 12.95 | 1.31 |
Forest Cover | 347.39 | 35.09 | 323.00 | 32.62 | 296.94 | 29.99 |
Pasture/Open Land | 256.76 | 25.93 | 370.82 | 37.45 | 296.75 | 29.97 |
River/ Water Body | 0.78 | 0.08 | 1.31 | 0.13 | 1.03 | 0.10 |
Sandy surface | 2.42 | 0.24 | 3.23 | 0.33 | 5.14 | 0.52 |
Snow Cover | 202.30 | 20.43 | 88.54 | 8.94 | 55.97 | 5.65 |
Total | 990.09 | 100.00 | 990.09 | 100.00 | 990.09 | 100.00 |
Source: Landsat-5 (TM), Landsat-7 (ETM+) and Landsat-8 (OLI/TIRS), USGS.
Land use/cover pattern in 2005
Landsat 7 (ETM+) was used to prepare LULC map for the year 2005 shown in Table 2 and Figure 2. The largest part of the area was shared by three major land cover including pasture land, forest cover and barren land covering 370.82 km2 (37.45 per cent), 323.00 km2 (32.62 per cent) and 139.65 km2 (14.11 per cent) respectively. The data illustrated that the area of snow cover had shrunk remarkably and only covered an area of 88.54 km2 (8.94 per cent) with a minimum elevation of 3800 meters from MSL. Agricultural land occupied 55.14 Km2 (5.57 per cent) of the study area with an elevation not more than 2800 meters from MSL. The area of built-up land was 8.40 km2 attributing to 0.85 per cent of the study area. During this period, the region experienced various infrastructure development and construction activities and road networks were extended to support the tourist spots and hydro-power projects. The settlements on the right side of the river Beas showed linear pattern along the main highway. The river and sandy surface covered 4.54 Km2 (0.46 per cent) together in which river and sandy surface occupied 1.31 Km2 (0.13 per cent) and 3.23 Km2 (0.33 per cent) respectively.
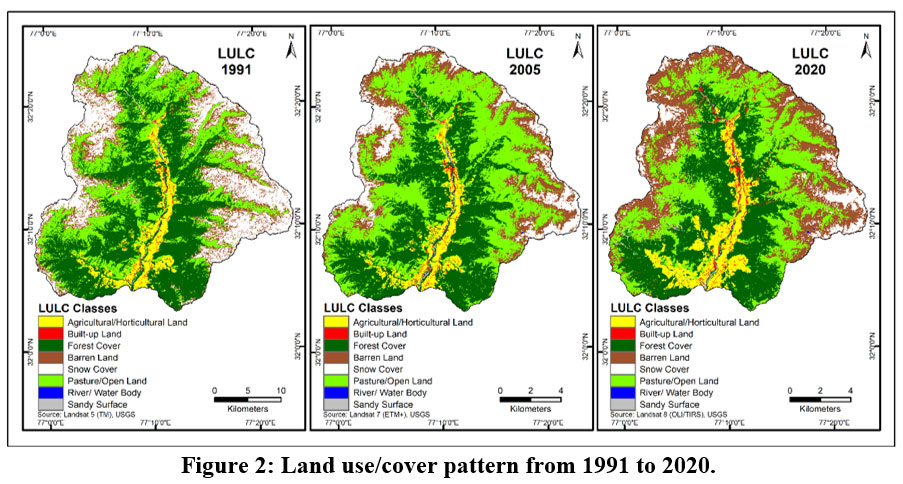 | Figure 2: Land use/cover pattern from 1991 to 2020. Click here to view Figure |
Land use/cover pattern in 2020
The land use/cover map of 2020 prepared from Landsat 8 (OLI/TIRS) showed that about 60 per cent of the study area was covered by forest area and pasture land contributing to 296.94 Km2 and 296.75 Km2 respectively. The area covered by barren land was 239.10 Km2 (24.15 per cent) followed by snow cover that covers 55.97 Km2 (5.65 per cent) with an elevation not less than 3900 meters from MSL. The river and sandy surface covered 1.03 Km2 and 5.14 Km2 of the study area respectively. The area under agriculture land was 82.20 Km2 comprising 8.30 per cent of the area. The patches of the agricultural land were visible up to 3000 meters from MSL. A total of 12.95 Km2 (8.30 per cent) of the study area was covered by built-up land. The settlements were extended up to the elevation of 2800 meters from the MSL. The new patches of settlements could be seen developed within the agricultural fields connected by road network. The results of LULC during 2020 are shown in Fig. 2 and Table. 2.
Land use/cover change from 1991 to 2020
All three images of Landsat satellite have been compared to examine the changes in LULC during 1991-2020 (Table 3). The change detection analysis has been done on the images and the time period is divided into two epochs i.e., 1991-2005 and 2005-2020. The first epoch is characterised by the increase in barren land, pasture land, agricultural land, built up, river and sandy surface and a decrease in forest area and snow cover. During the epoch (1991-2005), the maximum loss is experienced by snow cover which reduced 113.76 Km2 (56.24 per cent) from 1991. The snow cover was transformed to barren land 73.92 km2 and pastures land 49.87 km2 as a result of massive climatic variability. Forest cover has also decreased 24.39 Km2 attributing to 7.02 per cent of the total forest area. There has been seen interchange between forest cover and pasture land where 53.64 km2 area of forest cover transformed to pasture land and 21.87 km2 area of pasture land was converted into forest cover. A small amount of forest land was converted into barren land (2.63km2) and agriculture (0.81 km2) as a result of deforestation and horticultural expansion. The pasture land has increased 114.07 km2 (44.43 per cent) during the period. The shift is also noticeable between barren land and pasture land in which 22.12 km2 of pasture land converted to barren land and 57.21 km2 area converted to pasture land. The increase is also visible in barren land (20.15 km2) due to reduction in snow cover in the adjacent areas. The river body and sandy surface have also witness increase of 0.53 km2 and 0.81 km2 respectively.
Table 3: Land Use/Cover Change (1991-2020)
| 1991-2005 | 2005-2020 | ||
LULC Classes | Change | Percent | Change | Percent |
Agricultural/Horticultural Land | 1.18 | 2.19 | 27.06 | 49.09 |
Barren Land | 20.15 | 16.86 | 99.45 | 71.21 |
Built-up land | 1.40 | 20.02 | 4.56 | 54.26 |
Forest Cover | -24.39 | -7.02 | -26.05 | -8.07 |
Pasture/Open Land | 114.07 | 44.43 | -74.08 | -19.98 |
River/ Water Body | 0.53 | 68.60 | -0.28 | -21.44 |
Sandy surface | 0.81 | 33.61 | 1.91 | 59.03 |
Snow Cover | -113.76 | -56.24 | -32.56 | -36.78 |
During this period, the horticultural activities started expanding and various paddy fields were converted into apple orchards. As a result, a small amount of agricultural land (1.18 km2) increased in this epoch despite being the dominant activity in the region.
Table 4: Land Use/Cover Transformation Matrix (1991-2005).
A/HL | Barren Land | Built-up land | Forest Cover | Pasture/ OL | River/ WB | Sandy surface | Snow Cover | Total Transfer | ||
(Loss) | Year 1991 | |||||||||
A/HL | 53.01 | 0.00 | 0.89 | 0.01 | 0.05 | 0.00 | 0.00 | 0.00 | 0.95 | 53.95 |
Barren Land | 0.02 | 40.58 | 0.00 | 9.89 | 57.21 | 0.00 | 0.13 | 11.66 | 78.91 | 119.50 |
Built-up land | 0.00 | 0.00 | 6.99 | 0.00 | 0.00 | 0.00 | 0.00 | 0.00 | 0.00 | 6.99 |
Forest Cover | 0.81 | 2.63 | 0.24 | 288.38 | 53.64 | 0.55 | 1.10 | 0.03 | 59.01 | 347.39 |
Pasture/OL | 1.30 | 22.12 | 0.25 | 21.87 | 209.22 | 0.27 | 0.78 | 0.95 | 47.54 | 256.76 |
River/WB | 0.00 | 0.11 | 0.00 | 0.22 | 0.03 | 0.21 | 0.19 | 0.00 | 0.57 | 0.78 |
Sandy surface | 0.00 | 0.29 | 0.02 | 0.11 | 0.80 | 0.22 | 0.98 | 0.00 | 1.44 | 2.42 |
Snow Cover | 0.00 | 73.92 | 0.00 | 2.51 | 49.87 | 0.06 | 0.05 | 75.90 | 126.40 | 202.30 |
(Gain) | 2.13 | 99.07 | 1.40 | 34.62 | 161.61 | 1.09 | 2.25 | 12.64 | ||
Year 2005 | 55.14 | 139.65 | 8.40 | 323.00 | 370.82 | 1.31 | 3.23 | 88.54 | 990.09 | |
Abbreviations: A/HL: Agricultural Horticultural Land; OL: Open Land; WB: Water Body.
Table 5: Land Use/Cover Transformation Matrix (2005-2020).
A/HL | Barren Land | Built-up land | Forest Cover | Pasture/ OL | River/ WB | Sandy surface | Snow Cover | Total Transfer | ||
(Loss) | Year 2005 | |||||||||
A/HL | 48.61 | 0.11 | 4.04 | 1.78 | 0.52 | 0.01 | 0.06 | 0.00 | 6.53 | 55.14 |
Barren Land | 0.03 | 121.05 | 0.08 | 0.30 | 6.83 | 0.28 | 0.60 | 10.49 | 18.61 | 139.65 |
Built-up land | 2.65 | 0.21 | 4.99 | 0.28 | 0.22 | 0.01 | 0.03 | 0.00 | 3.40 | 8.40 |
Forest Cover | 18.32 | 8.79 | 1.34 | 264.58 | 28.70 | 0.05 | 1.16 | 0.07 | 58.42 | 323.00 |
Pasture/OL | 12.22 | 64.12 | 2.16 | 29.45 | 259.59 | 0.08 | 1.84 | 1.36 | 111.23 | 370.82 |
River/ WB | 0.13 | 0.17 | 0.11 | 0.14 | 0.06 | 0.36 | 0.36 | 0.00 | 0.96 | 1.31 |
Sandy surface | 0.24 | 0.90 | 0.23 | 0.40 | 0.18 | 0.20 | 1.08 | 0.01 | 2.15 | 3.23 |
Snow Cover | 0.01 | 43.75 | 0.01 | 0.02 | 0.66 | 0.05 | 0.01 | 44.04 | 44.50 | 88.54 |
(Gain) | 33.60 | 118.05 | 7.96 | 32.36 | 37.16 | 0.68 | 4.06 | 11.93 | ||
Year 2020 | 82.20 | 239.10 | 12.95 | 296.94 | 296.75 | 1.03 | 5.14 | 55.97 | 990.09 | |
Abbreviations: A/HL: Agricultural Horticultural Land; OL: Open Land; WB: Water Body.
Still, the minor intrusion of agricultural land is evident on natural cover as forest cover (0.81 km2) and pasture land (1.30 km2) were shifted to agricultural land. The built-up land has seen an increase of 20.02 per cent from 1991. The increase of settlement area has put huge pressure on the nearby agricultural land due to the fact that 63.57 per cent of the total gain in built-up class has come from agricultural land. The well flattened agricultural land becomes more suitable for constructing houses/buildings and roads.
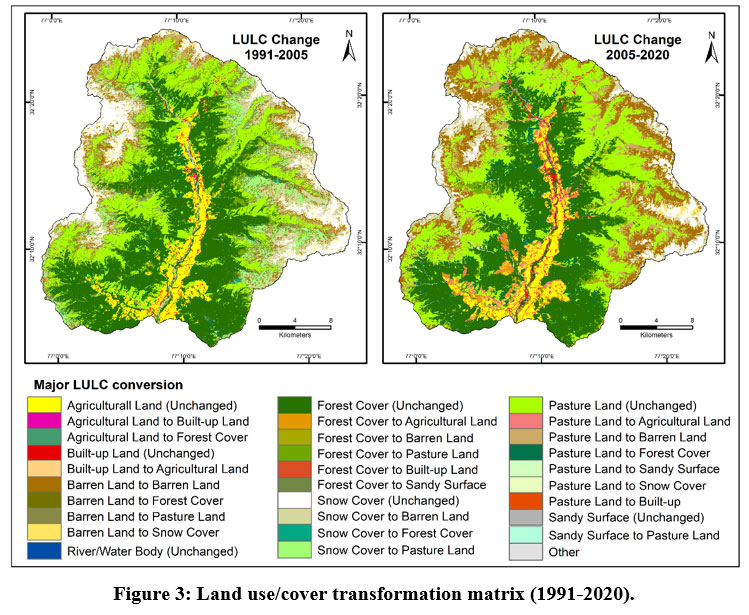 | Figure 3: Land use/cover transformation matrix (1991-2020). Click here to view Figure |
The second epoch (2005-2020) has witnessed significant decline in snow cover, pasture land and forest cover. The snow cover, like the previous epoch, has seen decline of 32.56 km2 (36.78 per cent). Most of the snow cover has been converted to barren land (43.75 km2) while some patches of barren land have shifted to snow cover (10.49 km2). The continuous decline of snow cover is posing threat to the natural condition of the region. In contrast to the previous period, pasture land has observed considerable decline in this epoch and 64.12 km2 area of pasture land has transferred to barren land. The pasture land has also converted to forest cover (29.45 km2) in the higher elevation and adjacent to the villages. The period has seen emergence of various forest development programmes and a large portion of area has taken under tree farming. The increase in the forest cover at the higher elevations shows the decline in the human involvement resulting into the ecological succession in these areas. On the other side, the loss of forest cover near the agricultural land shows the deforestation activities for the community uses and 28.70 km2 area of forest land has been converted to pasture land. The river area has declined by 21.44 per cent while sandy surface has increased significantly with an increase of 59.03 per cent. The increase in sandy surface is attributed to flash floods in the river Beas and its tributaries during 2018-19 where a large portion of land along river was eroded. The area occupied by sandy surface mostly came from forest cover (1.16 km2) and pasture land (1.84 km2).
The period has also witnessed significant increase in the area under agriculture/horticulture and human settlements. The agricultural land has increased 27.06 km2 from 1991, an increase of 49.09 per cent. The period is characterised by expansion of horticultural activities in new areas where most of the available agricultural land is utilized for fruit cultivation. The forest and pasture land close to human settlements have been removed for horticultural development by taking 18.32 km2 and 12.22 km2 respectively. The other noticeable change in land use is associated with built-up land that has increased tremendously by 54.26 per cent during the period. The built-up land has been spreading over agricultural land and 4.04 km2 of area is converted to built-up land from 2005-2020. The terraced field is being populated with the clusters of human settlements joined by numerous link roads. The region has also experienced change in settlement displacements and 2.65 km2 area of built-up land has been converted to agricultural land. During the period, various traditional houses were vanished or abandoned so that people could make their home along the road. The high elevated open land is also utilized for development activities such as tourism, hydro-power projects and tunnels. As a result, 2.16 km2 area has been transferred to built-up land. In addition to this, forests have been also removed for road widening and construction activities and 1.34 per cent area has been converted to built-up land.
Conclusion
The present study is an attempt to analyse the land use/cover change from 1991 to 2020. The Upper Kullu Valley has experienced tremendous growth of horticultural and tourism related developments from the early 1970s. The inflow of population from outside the region and developmental activities have provided an incredible economic boost but still, their increasing pressure on natural resources and bio-capacity cannot be denied. The study area experienced increase in barren land, agricultural land and built-up area and decrease in forest cover and snow cover. The analyses show that there has been continuous decline in snow cover and the snow line is retreating. As a result, barren land is increasing significantly affecting the forest and pasture land, and allowing for soil degradation and loss of water bodies. The increasing anthropogenic activities has led to the increase in built-up area and farming land. The growing urban settlements in the north of the study region have already disturbed the agricultural setup of nearby villages and it is likely to expand further. Despite the existing plans already functioning for urban development, there is need to have a farsighted plan for the whole region where possibility of expanding cultivated area is negligible and urban space is certain to eliminate the adjoining farming land. Even though the human occupancy of land expands, there can be a serious threat to the natural resources such as forests and fodder on which the local population is fully dependent. The study tries to demonstrate the changing nature of human occupancy in the mountainous landscape and role of geospatial technology to help in monitoring those changes over a period of time. The pattern and trend of LULC analysed in the study area can help decision maker in formulating future plans associated to land use and natural resource management.
Acknowledgement
This work was supported by research grant (UGC/JRF) from the University Grants Commission, India
Conflict of Interest
There is no conflict of interest.
Funding Sources
There is no funding source.
References
- Sinha S, Sharma LK, Nathawat MS. Improved land-use/land-cover classification of semi-arid deciduous forest landscape using thermal remote sensing. Egypt J Remote Sens Space Sci. 2015;18(2):217-233. doi:10.1016/j.ejrs.2015.09.005.
CrossRef - Meyer WB, Turner BL. Land-use/land-cover change: challenges for geographers. Geo J. 1996;39(3):237-240. doi:10.1007/bf00188373.
CrossRef - Vivekananda GN, Swathi R, Sujith AVLN. Multi-temporal image analysis for LULC classification and change detection. Eur J Remote Sens. 2020;54(sup2):189-199. doi:10.1080/22797254.2020.1771215.
CrossRef - Turner B, Meyer WB, Skole DL. Global land-use/land-cover change: towards an integrated study. Ambio. 1994;23(1):91-95.
- Riebsame WE, Meyer WB, Turner BL. Modelling land use and cover as part of global environmental change. Clim Change. 1994;28(1-2):45-64. doi:10.1007/bf01094100.
CrossRef - Chhabra A, Geist H, Houghton RA, et al. Multiple impacts of land-use/cover change. In: Lambin EF, Geist HJ, eds. Land-Use and Land-Cover Change: Local Processes and Global Impacts. Berlin: Springer; 2006:71-116. doi: 10.1007/3-540-32202-7_4.
CrossRef - Gregrio A, Jansen J. Land Cover Classification System (LCCS); Classification Concepts and User Manual for Software Version 1. Rome: FAO; 2000.
- Mustard JF, Defries RS, Fisher T, Moran E. Land-use and land-cover change pathways and impacts. In: Gutman et al., eds. Land Change Science: Observing, Monitoring, and Understanding Trajectories of Change on Earth’s Surface. Netherlands: Kluwer Academic Publishers;2004:411-429. https://doi.org/10.1007/978-1-4020-2562-4_24. Accessed March 03, 2022.
CrossRef - Erasu D. Remote sensing-based urban land use/land cover change detection and monitoring. J Remote Sens & GIS. 2017;6(2):1-5. doi: 10.4172/2469-4134.1000196.
CrossRef - Wu Q, Li HQ, Wang RS, et al. Monitoring and predicting land use change in Beijing using remote sensing and GIS. Landsc Urban Plan. 2006;78(4):322-333. doi:10.1016/j.landurbplan.2005.10.002.
CrossRef - Cohen WB, Goward SN. Landsat's role in ecological applications of remote sensing. Bioscience. 2004;54(6):535-545. Doi: 10.1641/0006-3568(2004)054[0535:lrieao]2.0.co;2.
CrossRef - Rawat JS, Kumar M. Monitoring land use/cover change using remote sensing and GIS techniques: a case study of Hawalbagh block, district Almora, Uttarakhand, India. Egypt J Remote Sens Space Sci. 2015;18(1):77-84. doi: 10.1016/j.ejrs.2015.02.002.
CrossRef - Tiwari P. Land use changes in Himalaya and their impacts on environment, society and economy: a study of the lake region in Kumaon Himalaya, India. Adv Atmos Sci. 2008;25(6):1029-1042. doi: 10.1007/s00376-008-1029-x.
CrossRef - Raman R, Punia M. Land use dynamics and landscape fragmentation in higher Garhwal Himalaya, India. Asian J Geoinformatics. 2012;12(1):1-12.
- Misra A, Balaji R. Decadal changes in the land use/land cover and shoreline along the coastal districts of Southern Gujarat, India. Environ Monit Assess. 2015;187(7):1-13. doi: 10.1007/s10661-015-4684-2.
CrossRef - Fayaz A, Shafiq M, Singh H, Ahmed P. Assessment of spatiotemporal changes in land use/land cover of North Kashmir Himalayas from 1992 to 2018. Model Earth Syst Environ. 2020;6(2):1189–1200. doi: 10.1007/s40808-020-00750-9.
CrossRef - Singh RB. Land use/cover changes, extreme events and ecohydrological responses in the Himalayan region. Hydrol Process. 1998;12(13-14):2043-2055. doi: 10.1002/(SICI)1099-1085(19981030)12:13/14<2043::AID-HYP718>3.0.CO;2-0
CrossRef - Vishwa CB, Kaur BK, Simrit K. Land use/cover change and its implications for Kullu district of Himachal Pradesh, India. Int J Geomat Geosci. 2013;3(3):538-551.
- Singh SK, Chandel V, Kumar H, Gupta H. RS & GIS based urban land use change and site suitability analysis for future urban expansion of Parwanoo planning area, Solan, Himachal Pradesh (India). Int J Dev Res. 2014;4(8):1491-1503.
- Shah S, Sharma DP. Land use change detection in Solan forest division, Himachal Pradesh, India. For Ecosyst. 2015;2(1):1-12. doi: 10.1186/s40663-015-0050-7.
CrossRef - Thakur N, Rishi M, Keesari T, Sharma DA, Singh R. Assessment of changes in land use and land cover patterns using RS and GIS: a case study of upper Beas Basin of Kullu Valley in Western Himalayas, India. Anusandhan. 2018;7(14):1-10. doi: 10.29070/AUJ-AN
- Lu D, Weng Q. A survey of image classification methods and techniques for improving classification performance. Int J Remote Sens. 2007;28(5):823-870. doi: 10.1080/01431160600746456.
CrossRef


