Spatial-Temporal Distribution and Trend Analysis of Groundwater Level at Ghazipur District, Uttar Pradesh, India.
Pushpendra Kumar1
*
 , Gopal Krishan2
, Anupam Kumar Nema1
, Anil Kumar Lohani2
and Aradhana Thakur2
, Gopal Krishan2
, Anupam Kumar Nema1
, Anil Kumar Lohani2
and Aradhana Thakur2
1
Department of Farm Engineering,
Banaras Hindu University,
Varanasi,
Uttar Pradesh
India
2
National Institute of Hydrology,
Roorkee,
Uttarakhand
India
http://dx.doi.org/10.12944/CWE.17.2.7
Copy the following to cite this article:
Kumar P, Krishan G, Nema A. K, Lohani A. K, Thakur A. Spatial-Temporal Distribution and Trend Analysis of Groundwater Level at Ghazipur District, Uttar Pradesh, India. Curr World Environ 2022;17(2). DOI:http://dx.doi.org/10.12944/CWE.17.2.7
Copy the following to cite this URL:
Kumar P, Krishan G, Nema A. K, Lohani A. K, Thakur A. Spatial-Temporal Distribution and Trend Analysis of Groundwater Level at Ghazipur District, Uttar Pradesh, India. Curr World Environ 2022;17(2).
Download article (pdf) Citation Manager Publish History

Introduction
Groundwater is the major source of freshwater, which fulfils the domestic as well as industrial and irrigation requirements of water in many parts of the world 1,2,3,4. Alluvial aquifers are one of the most important sources of groundwater worldwide. The Indo-Gangetic basin (alluvial aquifer system) is considered to be one of the world's most valuable water resources, yet it is also the most heavily exploited 5,6. More than one-fourth of the world's groundwater is withdrawn from the Indo-Gangetic basins 7,8.
In India, due to excessive use of groundwater, the status of groundwater development is very high (more than 100 %) in the states like Delhi, Haryana and Punjab. In Tamil Nadu, Himachal Pradesh and Uttar Pradesh, the level of groundwater development is 70% and above 9. Large-scale groundwater development and use in large parts of India have led to a decrease in fresh groundwater (GW) resources and the spread of grey and dark areas across the country 10. Groundwater supplies in India from Indo-Gangetic Plains (IGP) have been stressed by intensive agriculture and rapid industrial expansion 11. The MK test has been used to find patterns and trends in daily groundwater level, annual temperature and precipitation12,13,14,15.
The parametric linear regression test and the MMK test were used to calculate trends in the GWL of the Sagar district. 16. Similar research has been done in Punjab, Uttar Pradesh and Chhattisgarh 17,18,19. The district is characterized by alluvium consisting of clay, sand kankar. Older, as well as Newer alluvium, are come across in the district. The area cuts the topographic contour of 68 to 77m amsl.
In general, the results of such studies revealed a negative and positive trend in the GWL time series. Groundwater management and protection, on the other hand, need the use of optimal management methods. However, groundwater management requires the application of effective management methods. So yet, no research has been conducted on the IGP(Indo-Gangetic plains) in India. As a result, the present study uses statistical and graphical methods to determine the spatial-temporal variation of groundwater levels based on data from the GWL of the Ghazipur district. The non-parametric test was used to find trends in groundwater levels. This study is helpful in the sustainable management and development of the water resources in the Ghazipur district, Uttar Pradesh
Material and Methods
Study area
In India, the IGP is regarded as the world's most fertile land for agriculture. The IGP (Indo-Gangetic Plain) encompasses the entire state of Uttar Pradesh. The majority of the soils in this study are deep silty-loam soils, which are favourable for agricultural purposes. This zone contributes a significant quantity of freshwater from the Himalayan snow which is important for groundwater recharge. The border of Uttar Pradesh touches Nepal, Himachal Pradesh, Haryana, Rajasthan, Madhya Pradesh and Bihar on the North, Northwest, West, Southwest, South & South-West, and East side, respectively. The present study was done for the Ghazipur district of Uttar Pradesh which is situated in the Eastern part of the Gangetic plain, having an areal extent from 25019’to 25054’N latitude and 8304’ to 83058’E longitude. In the current study, 39 sites were collected from the 13 blocks of the Ghazipur district to explore the spatial-temporal distribution and trend of groundwater levels. The location map is illustrated in Figure 1.
 | Figure 1: Study area.
|
Material and Methods
GWL data sets of PRM and PTM seasons for the period 1998-2018 have been taken from the State Groundwater Department, Uttar Pradesh. There are 39 ground Water Level (GWL) stations that are considered under 13 blocks of Ghazipur districts, which are situated in Uttar Pradesh. To detect the temporal trend, the MMK test was used while for spatial variation, the IDW method has opted.
Modified Mann–Kendall Test (MMK)
Bias-Corrected Pre-whitening (BCPW)
A time series Xt = x1, x2, . . . , xn, with a linear trend that follows a first ordered serial correlation process can be specified as

Where,
Xt and Xt?1 - data collected at time t and t?1
? - the serial correlation coefficient
? - constant intercept term
? - represents the trend slope related to time
?t - noise term that is uncorrelated
The matrix calculation shown below yields the calculated values of ?, ?, and ?.

Where, Z is the matrix of dimension (n ? 1)·3, in which the second column holds (n ? 1) values equal to 1, the third column contains the numbers 2 to n and y is a vector of dimension (n ? 1)·1 holding the data x2 to xn. The bias-corrected serial correlation coefficient ? ? 20,21 is estimated using the formula given in Equation (3). This value is used in BCPW and trend analysis.

Inverse Distance Weighted (IDW)
The IDW technique with ArcMap 10.4 environment was used to prepare spatial GWL variation maps for the PRM and PTM seasons. In the IDW technique, the weightage of the given point is specified to be in inverse relation to its distance from the calculated point. The formula is given below.:

where:
= value to be calculated
xi= known magnitude
d1, d2, d3,d4 …, dn = distance from the n observations points to the calculated point n.
Results and Discussion
The water table fluctuation trends can be studied using continuous records of PRM and PTM groundwater levels. The study highlights the groundwater level trend at 39 locations under 13 blocks of Ghazipur district. The GWL trend was detected from the Modified Mann-Kendall test (Bias-Corrected Pre-whitening ) at a 5 % significance level. In the trend analysis for 39 locations, there are four primary categories two show the negative trend i.e., negative significant and negative (Z-statistics values <-1.96 and -1.96 to 0) and the other two show positive trend i.e., positive and positive significant ( Z-statistics values 0 to 1.96 and >1.96). The value of the upward or downward trend was calculated by Sen's slope magnitudes.
Statistical Analysis
In the current study, during PRM and PTM seasons, 39 locations have been analysed using average, standard deviation (SD) and coefficient of variation (CV).In the PRM, the values of mean, SD and CV varied from 3.16 m (Ranipur) to 12.71 m (Rohipur ), 0.31 (Deoria ) to 3.68 (Kokilpura ) and 5.17 % (Tajpur) to 67.44 % (Rohipur), respectively. However, in the PTM season, it varied from 1.76 m (Deval) to 9.09 m (Ranipurt ), 0.53 (Daulatnagar ) to 2.95 (Dharvara) and 19.78 % (Karanda thana ) to 69.40 % (Dharvara) respectively. Table 1 shows station-by-station GWL fluctuations and their statistics.
Table 1: Statistics of GWL from 1998 to 2018.
Block | Station | PRM | PTM | ||||
Mean | SD | CV(%) | Mean | SD | CV(%) | ||
Barachaur | Barachaur | 5.26 | 0.75 | 14.35 | 3.01 | 1.05 | 34.88 |
Shermath | 6.13 | 1.57 | 25.59 | 4.81 | 1.58 | 32.87 | |
Kokilpura | 6.29 | 3.68 | 58.43 | 6.28 | 1.55 | 24.67 | |
Bhadaura | Baksada | 7.39 | 1.55 | 20.95 | 2.91 | 1.41 | 48.41 |
Deval | 3.91 | 1.12 | 28.73 | 1.76 | 0.73 | 41.47 | |
Gahmar thana | 4.8 | 0.9 | 18.66 | 2.5 | 0.69 | 27.46 | |
Bhawarkol | Beerpur | 4.96 | 1.72 | 34.67 | 2.23 | 0.78 | 34.77 |
Bhawarkol | 4.27 | 1.02 | 23.87 | 2.13 | 0.85 | 40.21 | |
Mirzabad | 6.58 | 1.01 | 15.37 | 4.34 | 1.39 | 32.1 | |
Virno | Dahebua | 5.51 | 1.11 | 20.17 | 2.91 | 0.97 | 33.28 |
Mohanpur | 6.55 | 1.25 | 19.06 | 3.75 | 1.55 | 41.24 | |
Tanti | 4.86 | 1.28 | 26.44 | 2.99 | 1.38 | 46.09 | |
Ghazipur | Faxganj | 12.12 | 1.01 | 8.32 | 6.94 | 1.51 | 21.76 |
Ranipurt | 12.71 | 0.95 | 7.5 | 9.09 | 1.92 | 21.08 | |
Rohipur | 3.16 | 2.13 | 67.44 | 2.04 | 1.04 | 51.12 | |
Zamania | Deoria | 5.67 | 0.31 | 5.41 | 2.57 | 0.78 | 30.29 |
Devaitha | 4.93 | 1.37 | 27.78 | 1.98 | 1.15 | 58.36 | |
Tajpur | 6.14 | 0.32 | 5.17 | 3.08 | 0.63 | 20.5 | |
Karanda | Chochakpur | 11.9 | 1.58 | 13.26 | 8.54 | 1.74 | 20.34 |
Gosandrapur | 8.67 | 1.57 | 18.16 | 6.65 | 1.51 | 22.68 | |
Karanda thana | 9.85 | 0.98 | 9.9 | 7.2 | 1.42 | 19.78 | |
Kasimabad | Dharvara | 6.58 | 2.51 | 38.19 | 4.25 | 2.95 | 69.4 |
Gangauli | 4.42 | 0.61 | 13.82 | 2.47 | 0.83 | 33.46 | |
Khajuha | 4.32 | 0.78 | 17.96 | 1.88 | 0.57 | 30.45 | |
Manihari | Hansrajpur | 6.33 | 1.3 | 20.48 | 2.94 | 1.12 | 38.07 |
Katghara | 5.17 | 0.96 | 18.59 | 2.87 | 1.27 | 44.26 | |
Madhuvan | 6.23 | 1.14 | 18.35 | 4.59 | 1.13 | 24.66 | |
Mardah | Bauri | 4.39 | 2.15 | 48.98 | 3.05 | 0.93 | 30.42 |
Gehurhi | 6.74 | 2.74 | 40.7 | 4.74 | 1.84 | 38.89 | |
Pirthipur | 3.8 | 1.69 | 44.65 | 1.98 | 1.34 | 67.77 | |
Mohammadabad | Pakka inara | 7.38 | 1.4 | 18.97 | 3.76 | 1.33 | 35.33 |
Parsa | 6.19 | 1.28 | 20.69 | 3.96 | 1.87 | 47.14 | |
Ichauli | 5.2 | 0.91 | 17.45 | 3.04 | 1.67 | 54.73 | |
Reotipur | Medanipur | 7.13 | 0.87 | 12.22 | 5.61 | 1.11 | 19.85 |
Reotipur | 6.28 | 1.58 | 25.17 | 4.87 | 1.43 | 29.39 | |
Utrauli | 6.81 | 1.05 | 15.39 | 4.59 | 1.23 | 26.89 | |
Sadat | Daulat Nagar | 5.14 | 0.58 | 11.2 | 2.32 | 0.53 | 22.98 |
Kaura | 3.45 | 1.11 | 32.15 | 2.12 | 1.24 | 58.61 | |
Ukraon | 5.1 | 2.02 | 39.61 | 2.89 | 1.38 | 47.75 | |
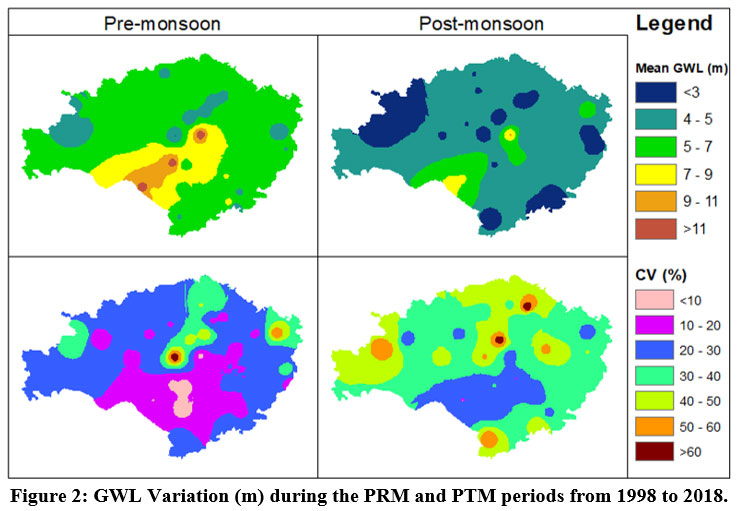
Spatial Variation of CV values of Groundwater level (GWL)
The spatial maps were generated using average GWL and CV (%) results from all stations from 1998 to 2018. Figure 2 shows a spatial map of GWL fluctuation based on CV (%) values during the PRM and PTM seasons.
 | Figure 2: GWL Variation (m) during the PRM and PTM periods from 1998 to 2018.
|
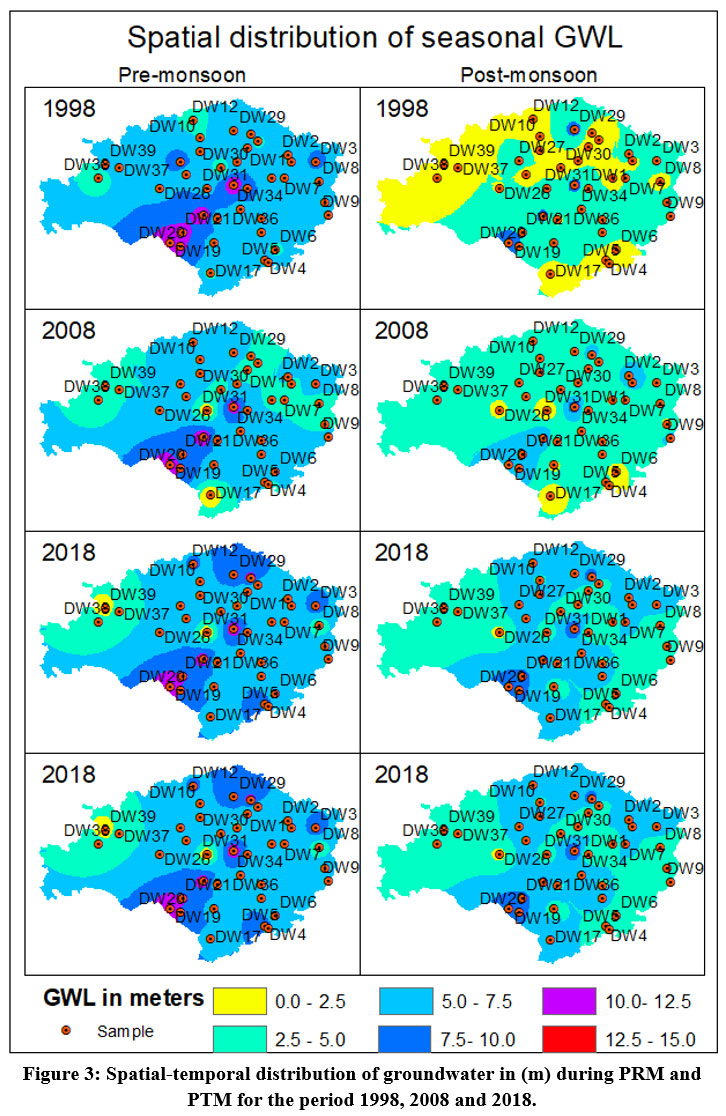
Analysis of Spatial-temporal distribution of Groundwater level during a period (1998, 2008 and 2018).
In the current study, the spatial-temporal distribution maps have been prepared for all the locations during the PRM and PTM seasons as shown in figure 3 for 1998, 2008 and 2018. In PRM season during the period of 1998, 2008 and 2018, the area varying from 6.26 % (10-12.5 mbgl) to 43% (2.5-5 mbgl ), 0.19 % (10-12.5 mbgl) to 66.30 (2.5-5 mbgl ), 2.25 % (10-12.5 mbgl) to 66.42 % (5-7.5 mbgl), respectively. Whereas, in PTM season of 1998, 2008 and 2018, the area varied from 2.15 % m (7.5-10 mbgl) to 53.78 (5-7.5 mbgl ), 0.40 % (7.5-10 mbgl ) to 84.48 % (2.5-5 mbgl), 0.15 %(10-12.5 mbgl) to 48.37 %(2.5-5 mbgl), respectively.
 | Figure 3: Spatial-temporal distribution of groundwater in (m) during PRM and PTM for the period 1998, 2008 and 2018.
|
GWL Trend Analysis during 1998-2018
Table 2: MMK test results for PRM and PTM during the period 1998-2018.
Block | Location | PRM(?) | Sen Slope values | PTM (?) | Sen Slope values |
Barachaur | Barachaur | 1.20 | 0.04 | 3.08b | 0.12 |
Shermath | 2.24b | 0.07 | 3.08b | 0.21 | |
Kokilpura | 0.39 | 0.02 | 2.17b | 0.12 | |
Bhadaura | Baksada | 1.01 | 0.06 | 1.46 | 0.08 |
Deval | 1.59 | 0.06 | -1.01 | -0.03 | |
Gahmar thana | 0.23 | 0.01 | 0.88 | 0.03 | |
Bhawarkol | Beerpur | 1.65 | 0.07 | 2.56b | 0.07 |
Bhawarkol | -1.91 | -0.05 | -0.03 | 0.00 | |
Mirzabad | -0.55 | -0.02 | -0.42 | -0.03 | |
Virno | Dahebua | 1.72 | 0.08 | 1.65 | 0.06 |
Mohanpur | 2.89b | 0.14 | 1.65 | 0.10 | |
Tanti | 2.89b | 0.14 | 2.76b | 0.14 | |
Ghazipur | Faxganj | 0.42 | 0.03 | 0.62 | 0.05 |
Ranipurt | 3.80b | 0.09 | 2.76b | 0.16 | |
Rohipur | -2.21a | -0.15 | 0.03 | 0.00 | |
Zamania | Deoria | 0.62 | 0.01 | -0.81 | -0.02 |
Devaitha | 2.30b | 0.11 | 0.55 | 0.01 | |
Tajpur | 0.16 | 0.00 | -2.50a | -0.08 | |
Karanda | Chochakpur | 0.94 | 0.04 | 0.55 | 0.05 |
Gosandrapur | 0.49 | 0.02 | 1.07 | 0.06 | |
Karanda thana | 0.94 | 0.04 | 0.29 | 0.03 | |
Kasimabad | Dharvara | 2.76b | 0.16 | 2.11b | 0.18 |
Gangauli | 2.50b | 0.06 | 1.52 | 0.05 | |
Khajuha | -0.10 | 0.00 | 1.01 | 0.02 | |
Manihari | Hansrajpur | 1.43 | 0.05 | 1.52 | 0.08 |
Katghara | -1.59 | -0.05 | 0.42 | 0.04 | |
Madhuvan | 1.40 | 0.04 | 1.52 | 0.07 | |
Mardah | Bauri | 0.36 | 0.05 | -0.55 | -0.03 |
Gehurhi | 0.42 | 0.04 | -0.10 | 0.00 | |
Pirthipur | 1.14 | 0.08 | 1.52 | 0.08 | |
Mohammadabad | Pakka inara | -0.23 | 0.00 | -1.65 | 0.00 |
Parsa | 2.50b | 0.13 | 2.69b | 0.22 | |
Ichauli | 2.63b | 0.10 | 1.01 | 0.06 | |
Reotipur | Medanipur | 0.29 | 0.00 | 1.72 | 0.07 |
Reotipur | 1.72 | 0.06 | 0.55 | 0.04 | |
Utrauli | 2.63b | 0.10 | 2.63b | 0.13 | |
Sadat | Daulat Nagar | -1.14 | -0.03 | -1.46 | -0.03 |
Kaura | 1.98b | 0.08 | 1.01 | 0.06 | |
Ukraon | 0.68 | 0.05 | 2.24b | 0.11 | |
Note: where, a and b indicate the significantly increasing & decreasing trend at 5% significant level, respectively. | |||||
In the current study, results are examined in two ways - PRM and PTM. In PRM season out of 39 stations, 31 stations are representing a positive trend of GWL and the remaining 8 are negative. However, the result of GWL varied from -0.15 m/yr (Rohipur site of Ghazipur block ) to 0.16 m/yr (Dharvara site of Kasimabad block). In the PTM period from total of 39 sites, 9 stations are representing a falling trend and for the remaining 30 stations, rising trend of GWL was observed. whereas, the result of GWL differs from -0.08 m/yr (Tajpur site of Zamania to 0.22 m/yr (Parsa site of Mohammadabad block ). The Z-statistics of the total 39 locations during the PRM period differ from -2.50 to 3.08 m/yr. In the PRM period, 31 stations are representing a downward trend and the remaining 8 are reflecting an upward trend. Although, from all of them, Rohipur stations have followed a significant falling trend, while Shermath, Mohanpur, Tanti, Ranipurt, Devaitha, Dharvara, Gangauli, Parsa, Ichauli, Utrauli and Kaura stations have followed significant upward trends at a 5% significance level, respectively. In the PTM season, 9 sites are representing a downward trend and the rest 30 are showing an upward trend. However, from all of them, the Tajpur site is representing a significant negative trend and, Barachaur, Shermath, Kokilpura, Beerpur, Tanti, Ranipurt, Dharvra, Parsa, Utrauli and Ukraon sites are representing significant positive trends at 5% significance level, respectively. The summarised result of the MMK Test (Bias corrected pre-whitening test) and Sen’s slope magnitude is detailed in Table 2. The average minimum and maximum GWL during the PRM season varied from 3.16 m to 12.71 m, and in the PTM season varied from 1.76 m to 9.09 m. Ghazipur, Karanda and Reotipur blocks of the Ghazipur district had the highest groundwater withdrawal in both PRM and PTM seasons. Hence, it ranged from 12.71to 9.09, 11.90 to 8.54 and 6.58 to 4.25 in PRM and PTM periods, respectively. The south and southwest areas of the Ghazipur district were determined to be groundwater depletion zones when compared to all of the stations in the district. As a result, the majority of locations in the Barachaur, Virno, Ghazipur, Kasimabad, Zamania, Mohammadabad, Reotipur, and Sadat blocks of the Ghazipur district show a considerable rising trend, indicating that the GWL is declining in these areas as a result of excessive groundwater extraction.
Conclusion
The Influence of groundwater extraction on fluctuations in the water contained in an aquifer is revealed by long-term groundwater fluctuation trends, which is critical for determining the usable groundwater potential. Pre-monsoon season GWL in Ghazipur district, Uttar Pradesh, revealed a significant rising trend from 1998 to 2018, and PTM season GWL showed a significant rising trend from 1998 to 2018. The value of GWL ranged from -0.15 m/yr (Rohipur ) to 0.16 m/yr (Dharvara ) during PRM and, the value of GWL ranged from -0.08 m/yr (Tajpur) to 0.22 m/yr (Parsa) during PTM seasons. Most of the stations (Shermath, mohanpur, Tanti, Ranipurt, Devaitha, Dharvara, Gangauli, Parsa, Ichauli, Utrauli and Kaura ) in the Ghazipur district showed a significant rising trend(s) which depicts the GWL is declining at these sites due to excessive of groundwater. Hence, effective management plans are required to conserve GW storage at specified locations. The MMK test was shown to be an appropriate method for identifying historical trends in GWL fluctuations. Outcomes revealed from study can be useful for ensuring sustainable groundwater management, agriculture & sustainable development of the district.
Acknowledgements
The authors would like to thank Banaras Hindu University, Varanasi for granting the PhD research work. The authors are also profoundly grateful to the National Institute of Hydrology Roorkee for providing the laboratory facility.
Conflict of interest
There is no conflict of interest in the publication of a manuscript by all the authors.
Funding source
There is no funding or financial support for this research work.
References
- Abdullahi M.G, Toriman M.E, Gasim M.B, Garba I . Trends Analysis of Groundwater: Using Non-Parametric Methods in Terengganu Malaysia. J Earth Sci Clim Change. 2015; 06(01).
CrossRef - Yilmaz A.G, Shanableh. A Al-Ruzouq RI, Kayemah N. Spatio-temporal trend analysis of groundwater levels in Sharjah, UAE. Int J Environ Sci Dev. 2020;11(1):9-14.
CrossRef - Mallon, A., Rauf, A. U., Daud, A., Hatta, M., Al-Madhoun, W., Amiruddin, R., ... & Astuti, R. D. P. (2022). Health risk assessment of potentially toxic elements in Maros karst groundwater: a Monte Carlo simulation approach. Geomatics, Natural Hazards and Risk, 13(1), 338-363.
CrossRef - Rauf, A. U., Mallongi, A., Daud, A., Hatta, M., & Astuti, R. D. P. (2021). Ecological risk assessment of hexavalent chromium and silicon dioxide in well water in Maros Regency, Indonesia. Gaceta Sanitaria, 35, S4-S8.
CrossRef - Bonsor H.C, MacDonald A. M, Ahmed K. M, W. Burgess W. G, Basharat M, Calow C.R, Dixit A, Foster S.S.D, Krishan G, Lapworth DJ, Moench M, Mukherjee A, Rao M.S, Shamsudduha M, Smith. Taylor R.G, Tucker. J, F. Van Steenbergen F, Yadav A.K, Zahid A. Hydrogeological typologies of the Indo-Gangetic basin alluvial aquifer, South Asia, Hydrogeol J . 2017; 25 (5)1377–1406
CrossRef - MacDonald A. M, Bonsor, H. C, Ahmed K. M, Burgess W. G, Basharat M, Calow R.C, Dixit A, Foster, S. S. D, Krishan G, Lapworth D. J, Lark R. M, Moench M, Rao, M. S, Shamsudduha M, Smith L, Taylor R. G, Tucker J, van Steenbergen F, Yadav S. K. Groundwater quality and depletion in the Indo-Gangetic Basin mapped from in situ observations. Nature Geoscience.2016, 762–766.
CrossRef - Wada Y, Van Beek L.P.H, Van Kempen C.M, Reckman J.W.TM, Vasak S, Bierkens M.F.P. Global depletion of groundwater resources. Geophys Res Lett;37:L20402
CrossRef - Siebert S, Feick S. (2007). Global map of irrigation areas versions 4.0.1. Johann Wolfgang Goethe University, Frankfurt am Main, Germany; FAO, Rome.
- Roopal S . Overview of groundwater in India.2016.1-12
- CGWB. Groundwater year book India. Central Ground Water Board Ministry of Water Resources Government of India Faridabad.2012; 1-63.
- Patle G.T, Singh D.K, Sarangi A, Rai A, Khanna M, Sahoo R.N. Time series analysis of groundwater levels and projection of future trends. J Geol Soc India. 2015;85(2):232-242.
CrossRef - Salam, R., Islam, T., Md, A. R., & Islam, S. (2020). Spatiotemporal distribution and prediction of groundwater level linked to ENSO teleconnection indices in the northwestern region of Bangladesh. Environment, Development and Sustainability, 22(5), 4509-4535.
CrossRef - Noori, A. R., & Singh, S. K. (2021). Spatial and temporal trend analysis of groundwater levels and regional groundwater drought assessment of Kabul, Afghanistan. Environmental Earth Sciences, 80(20), 1-16.
CrossRef - Gelebo, A. H., Kasiviswanathan, K. S., & Khare, D. (2022). Assessment of the spatial-temporal distribution of groundwater recharge in a data-scarce large-scale African river basin. Environmental Monitoring and Assessment, 194(3), 1-17.
CrossRef - Tabari H, Somee B.S, Zadeh M.R. Testing for long-term trends in climatic variables in Iran. Atmos Res. 2011;100(1):132-140.
CrossRef - Thakur G.S, Thomas T. Analysis of groundwater levels for detection of trend in Sagar district, Madhya Pradesh. J Geol Soc India. 2011;77(4):303-308.
CrossRef - Krishan G, Chandniha S.K, Lohani A.K. Rainfall trend analysis of Punjab, India using a statistical non-parametric test. Current World Environment. 2015;10(3): 792-800.
CrossRef - Kumar P, Chandniha S.K, Lohani A.K, Krishan G, Nema A.K (2018). Trend Analysis of Groundwater Level Using Non-Parametric Tests in Alluvial Aquifers of Uttar Pradesh, India. Current World Environment.2018; 13(1).44-54.
CrossRef - Dhruv G, Tripathi V.K, Dhankar B. Trend detection Analysis of Seasonal Groundwater Levels in Arpa River Basin, Bilaspur District, Chhattisgarh, India. Int J Curr Microbiol Appl Sci. 2020;9(6):1425-1436.
CrossRef - Hamed K.H. Enhancing the effectiveness of whitening in trend analysis of hydrologic data. J. Hydrol. 2009; 368, 143–155.
CrossRef - Van Giersbergen N.P.A. On the effect of deterministic terms on the bias in stable AR models. Econ. Lett. 2005;89, 75–82.
CrossRef


