Application of Vertical Electrical Sounding for Subsurface Characterization to Determine Slope Instability at Perizie, Nagaland
Meripeni Ezung1
 , Temsulemba Walling2
*
and C. Chelladura1
, Temsulemba Walling2
*
and C. Chelladura1
1
Department of Physics,
St. Joseph University, Ikishe model Village,
Virgin Town, Dimapur,
Nagaland
India
2
Department of Geology,
Nagaland University,
Kohima campus,
Meriema,
Nagaland
India
http://dx.doi.org/10.12944/CWE.17.3.14
Copy the following to cite this article:
Ezung M, Walling T, Chelladurai C. Application of Vertical Electrical Sounding for Subsurface Characterization to Determine Slope Instability at Perizie, Nagaland. Curr World Environ 2022;17(3). DOI:http://dx.doi.org/10.12944/CWE.17.3.14
Copy the following to cite this URL:
Ezung M, Walling T, Chelladurai C. Application of Vertical Electrical Sounding for Subsurface Characterization to Determine Slope Instability at Perizie, Nagaland. Curr World Environ 2022;17(3).
Download article (pdf)
Citation Manager
Publish History

Introduction
Kohima, the administrative headquarter of Nagaland, often experiences natural disasters in the form of landslides, which poses a high risk to the residents of this city town. It is situated towards the south of the state hosting several major offices and institutions. It also facilitates the main artery for the state of Manipur and several other towns, as the Trans-Asian Highway, AH 1, and National Highway, NH 2 pass through this town. Geologically, Kohima town is made up predominantly of the Tertiary Disang Group of rocks consisting of shales with some siltstones and sandstones. These rocks are folded, faulted, highly crumpled, crushed, and weathered 1-4. The shale exposures are dark grey and splintery in nature and are found to be weathered to clay in many areas.
The interaction of such presumably weak rocks with water is one of the several factors responsible for the numerous slope instabilities in and around the city 5-9.
Kohima, by virtue of being situated in a hilly city town, experiences regular occurrence of landslides, that are often triggered by external factors like heavy rainfall, seismic and tectonic activities, changes in water level, stream erosion, etc 10-14. The town receives heavy rainfall, especially during the monsoon season, and the average rainfall recorded for the last 5 years (2017-2021) between the months of May to August ranges from 1000 mm to 1800 mm (Source: Department of Soil and Water conservation, Kohima, Nagaland). Some of the factors that mainly contribute to these mass movements are continuous heavy rainfall and conditions of the slope materials. There is easy infiltration of water specially on bare and exposed slopes hosting weak lithology contributing to weathering of the country rock. As a result of the weathering and erosion process taking place, the slope materials lose their shear strength which is considered an important factor in the occurrence of landslides 15. Landslides are common in areas dominated by rocks, that are jointed, faulted, and sheared. Shales often associated with landslides are mostly weathered shale, which has become clay-rich soil with very low shear strength, especially when saturated with water. Shale and mudstone that are intercalated with minor beds of sandstone are again observed to be more prone to partial or total weathering of the rock mass. The use of the geo-electric method to investigate the subsurface lithology helps in the identification of weakness zones and the possible mass movements in vulnerable areas that are prone to landslides. These movements are mostly due to the instability of rock masses from the slopes, whose main constituents are soil, fractured rocks, and weathered materials 16-23.
Weakness zones are those areas whose mechanical properties are considered as significantly lower compared to the surrounding rock masses. It can occur as fault zones, shear zones or weak rocks and most of these zones are the results of numerous ruptures undergoing over geological time. One significant activity which impacts the properties of the weak rocks is the ongoing weathering process of the rocks as a result of water penetration into these weak zones from the permeable layers. Due to the saturation, besides an increase in pore water pressure, the weight of the weathered materials also increases, disturbing the balance of the slopes and thereby causing instability of the slope materials 24-29.
The clay-bearing rocks exhibiting low resistivity on the other hand are the least permeable and considered a waterproof layer, which is capable of acting as the probable layer for the initiation and plane of movement of the weathered materials. This acts as one of the primary factors for the cause and further development of landslides 30--33.
The presence of high groundwater content on slope areas is another driving force that causes instabilities. The high-quantity rainfall which the area receives during the monsoon season along with favourable geologic conditions, facilitates easy infiltration of water into the weak rocks and leads to an increase of the groundwater table, consequently saturating the weak materials and reducing their shear strength. This allows a conducive condition that results in slope failures 34-37.
Case studies related to landslides in and around Kohima town were carried out by several past workers, employing various methods to determine the influence of geology on the occurrence of landslides. Sharda and Bhambay [38] prepared the slope classification maps of Kohima town and its geotechnical reports. Significant information was also generated for landslide hazard zonation maps by researchers for this town [39-41] along with literature relating to landslides in this region 9,15,39-48.
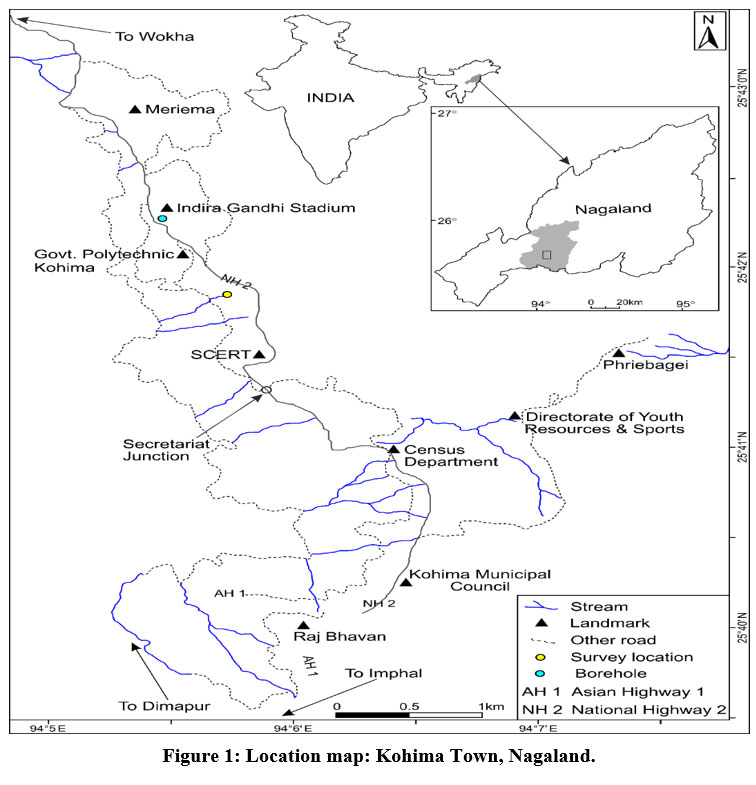
One area within Kohima town that is often plagued by landslides is Perizie colony. It is incorporated in the Survey of India topographic map, sheet number 83K/2, and lies between 25°41'48'' to 25°41'53'' North latitudes and 94°05'39'' to 94°05'46'' East longitudes (Fig.1). The study area is densely populated with several buildings, both residential and commercial, offices and roads, including the National Highway-2 (NH-2). The landslide has troubled this colony for the past few decades, damaging both kutcha houses as well as RCC buildings. Incessant rainfall during the monsoon season acts as the triggering factor for further movements, leading to road blockades, and affecting the colony resident’s travel to and from Kohima town.
Some researchers have carried out landslide studies in Nagaland. However, most of the earlier workers adopted a geological and geotechnical approach. The electrical resistivity methods for landslide investigations and the corresponding information on the subsurface conditions from such techniques are rare. The present study is probably the first of its kind in this area in which an attempt is made to utilise the non-invasive method to evaluate the causes of a landslide by determining the role of the inherent subsurface conditions of the slope materials. The results of this study will therefore contribute towards a better understanding of the causes of various land instabilities in this part of the country.
 | Figure 1: Location map: Kohima Town, Nagaland.
|
Lithology of the area
Major portion in the area of study consists pre-dominantly of the Disang shales, which are black in colour. The exposed rocks are sheared, crumpled, weathered, and fractured. Field photographs showing the exposed fractured and weathered shales are given in Fig. 2.
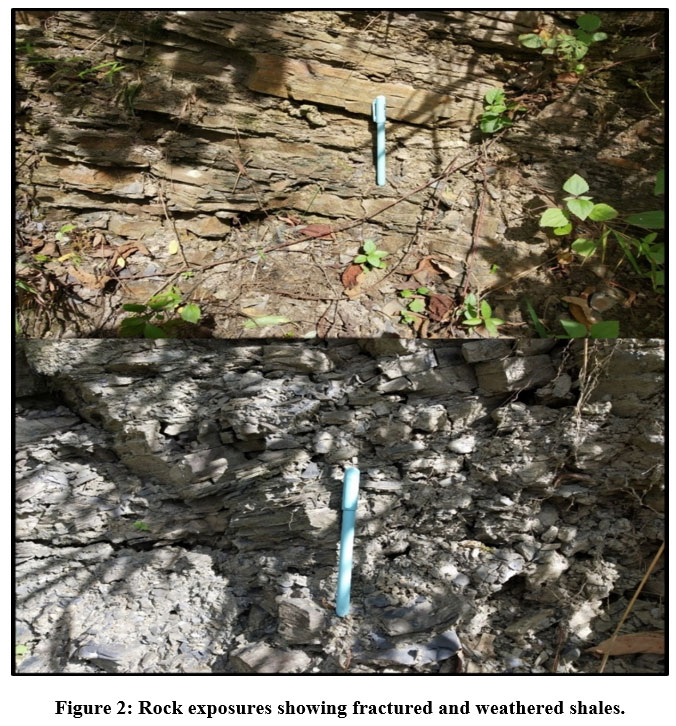 | Figure 2: Rock exposures showing fractured and weathered shales.
|
Materials and methods
The study utilized Vertical Electrical Sounding (VES) method, which gives the resistivity variations with depth. This method is used for assessing the existing subsurface conditions and is an effective method for identifying the complexity of the subsurface geology 49-53.
One dimensional (1D) VES method measures the electrical resistivity basing on the estimation of electrical conductivity or the resistivity of medium where a transmitting direct current is induced artificially inside the ground between an electrode pair, using galvanic batteries (DC) or low-frequency AC generators, gives the measure of the electric potential between the other electrode pair. The electrical characteristics variation with depth gives the apparent resistivity (Pa) of geologic formation, given as 54:

Here, five electrodes are used, where centre of the electrode is kept fixed and measurements are taken for various values of expanding current electrode. The two outer electrodes, the current electrode, act as the source and the other two inner electrodes, the potential electrode, serves as the receiver. The current (I) is introduced between the current electrodes pair, say, A and B and the potential difference (PV) produced is measured with the help of the potential electrodes pair, say, M and N. All the four electrodes are stretched along a straight line, with the current electrodes spacing kept large in comparison with potential electrodes spacing (Fig. 3). The present study employs the Schlumberger configuration [55] following the spacing of the current electrode and the potential electrode by order of 5, i.e., AB/2 p5 MN/2. This configuration gives a good resistivity contrast between the saturated and unsaturated layers for analysing the subsurface condition.
The electric topology of the geological bedding of the earth using sounding curves characteristics used for the analysis is classified into the four basic categories for subsurface layers with resistivity p1, p2, and p3, with p1 as the first resistivity value followed by p2 and p3 is given as:
p1 > p2 > p3: Q-type
p1 >p2 < p3: H-type
p1 < p2 > p3: K-type
p1 < p2 < p3: A-type
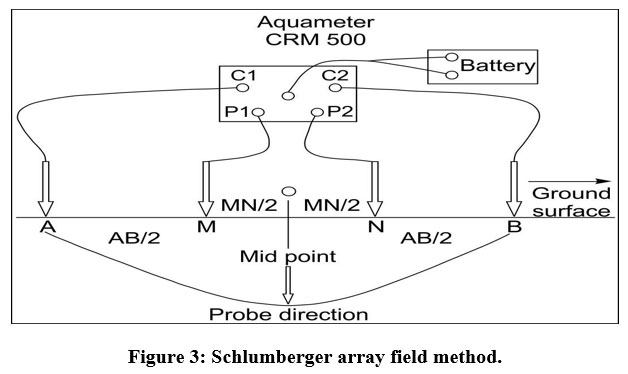 | Figure 3: Schlumberger array field method.
|
The field resistivity data was acquired by using a resistivity meter of the type, Aquameter CRM 500, with varying profile lengths for each VES location due to the surface restrictions (Table 1). The apparent resistivity values were computed using equation (1) and the field data was interpreted using the iterative resistivity sounding interpretation software IPI2win [56-57].
3 (three) VES locations were selected along the colony road to collect the field data (Fig. 4) and analysed for determining the resistivity layers.
Table 1: Geographical co-ordinates for the study area and borehole location.
Location | Geographical co-ordinates | Elevation | Borehole location | Geographical co-ordinates | |
Perizie | VES 1 | N 25°41'51.31'' E 94°05'44.42'' | 1404 m
| IG Stadium
| N 25°42'20.58'' E 94°05'29.37'' |
| VES 2 | N 25°41'51.42'' E 94°05'43.79'' | 1395 m
| |||
| VES 3 | N 25°41'49.28'' E 94°05'40.46'' | 1361 m
| |||
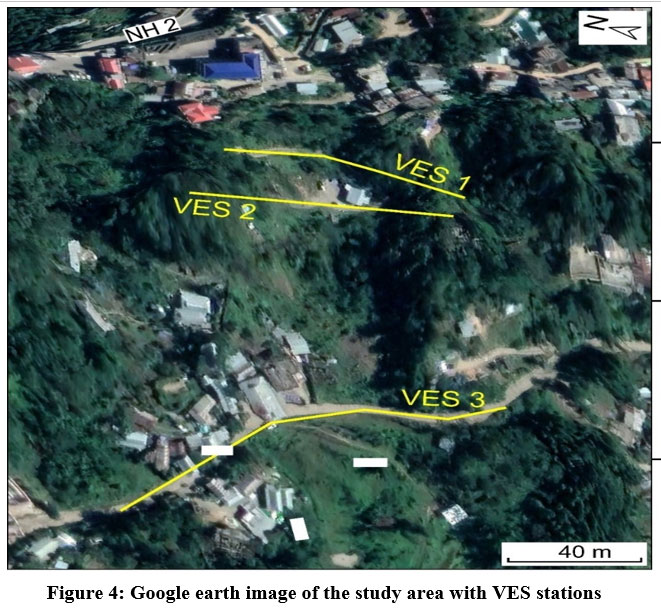 | Figure 4: Google earth image of the study area with VES stations.
|
Results and discussion
Sounding curves of the types K, KQ, and KHK delineate to show three to six layers for the VES survey locations (Fig. 5) [58-65]. KQ type at VES 1 show resistivity of the type p1 < p2 > p3 > p4. The topsoil thickness of the area is 0.498 m with a resistivity value 149 m, followed by a more compact rock layer comprising of shale or shale with sandstone intercalations with resistivity value 739 m. The third layer indicates the presence of weathered shale having resistivity value 112 m with thickness of 7.59 m, followed by the region with fractured shale at greater depth, which may be considered a suitable zone for groundwater reservoir.
K type curve is seen at VES 2 showing increasing resistivity to a maximum and then decreasing to lower resistivity values (p1 < p2 > p3). Shale or shale with sandstone intercalation is indicated between the top soil and the lower saturated fractured shale. The first layer resistivity comprising of the top soil or shale exposures is 122 m with a thickness of 0.9 m. Shale or shale with sandstone intercalations is seen in second layer, showing a high resistivity value of 405 m having a thickness of 1.26 m. The third layer has a lower resistivity value of 89.5 m at greater depths, which points to a zone of saturation of the rocks, containing the fractured rocks. These can be considered as a potential area for groundwater extraction.
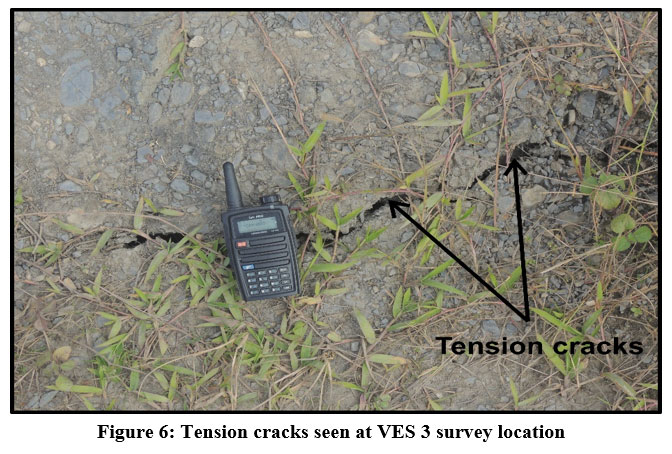
VES 3 shows KHK curves type with resistivity values given as p1 < p2 >p3 < p4 > p5 > p6. The top soil occupies the first layer as coverage with thickness of 0.691 m and resistivity value 85.48 m and a second layer containing shale is found with a resistivity value of 256.7 m and a thickness of 1.095 m. Weathered to highly weathered shale or clay is found at the third and the fifth layers showing resistivity values ranging between 20.79 m to 23.83 m. The fourth layer with resistivity values of 76.82 m with thickness 4.74 m indicates layers containing fractured shales. This layer points to the presence of groundwater (Table: 2). Development of tension cracks can be seen at the VES 3 survey location. These fissures act as the pathways for maximum water infiltration of surface water, thereby facilitating the increase in the saturation level of the subsurface materials. This leads to increased pore water pressure and reduced shear strength of the slope material (Fig. 6). The VES results are used to construct the subsurface lithologic description diagram, which shows a good correlation with the bore-hole data (Fig. 7)
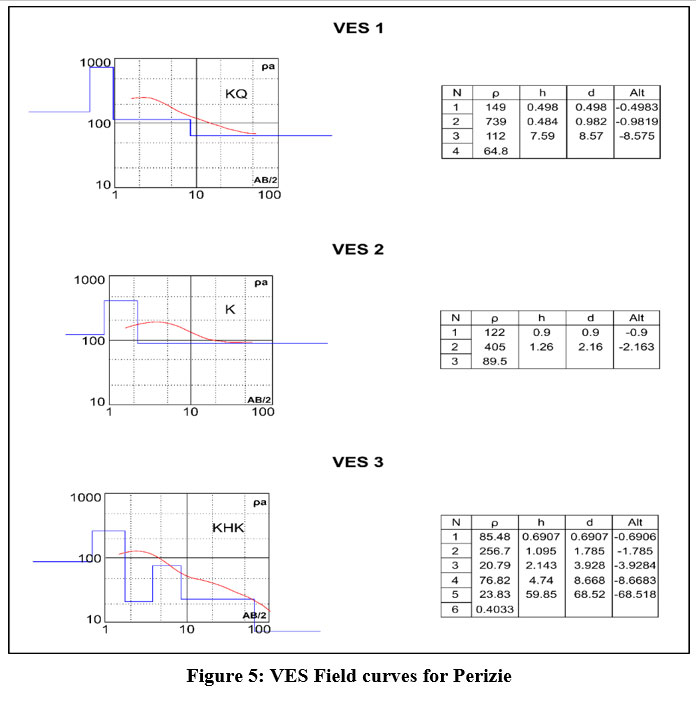 | Figure 5: VES Field curves for Perizie.
|
 | Figure 6: Tension cracks seen at VES 3 survey location.
|
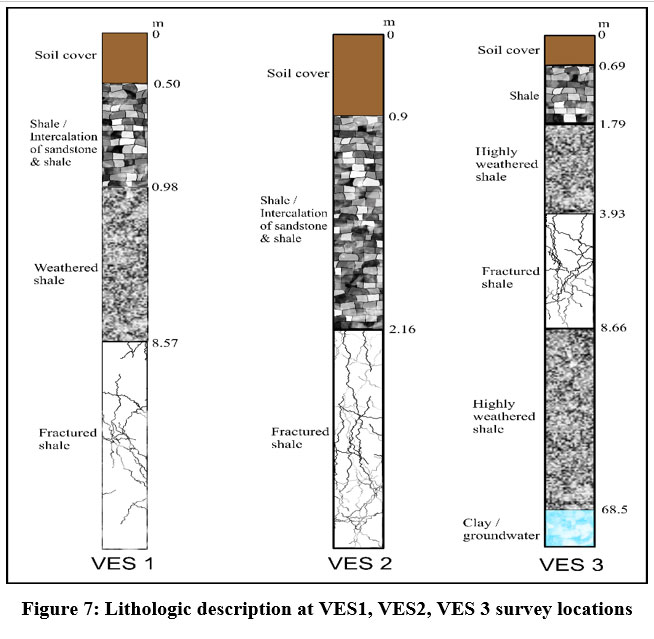 | Figure 7: Lithologic description at VES1, VES2, VES 3 survey locations.
|
During the fieldwork, three ring wells were found at different places in the vicinity of the VES survey stations. The following tabulation was made after an inquiry from the local residents (Table: 3).
The depth of water level observed for the three ring wells ranges between 1.5 m to 3 m (approx.) below the ground level, which is in consonance with the VES inferred layer parameters where the potential for groundwater is also inferred at a depth >8 m for VES 1, > 2.2 m for VES 2 and 8 m for VES 3 below the ground level. The comparison between the VES inferred layers at Perizie colony and borehole data at IG Stadium confirms the presence of fractured shale, weathered to highly weathered shale layer as the near-surface materials (Fig. 8).
Table 2: Layer parameters for the VES points.
VES station | Resistivity values (pm) | Thickness of the layers (m) | Depth of the layers (m) | Lithological Interpretation | Model curve Type |
VES 1 | p1= 149 | h1= 0.498 | d1= 0.498 | Topsoil/ shale exposures | KQ |
p2= 739 | h2= 0.484 | d2= 0.982 | Shale /shale with sandstone intercalation | ||
p3= 112 | h3= 7.59 | d3= 8.57 | Weathered shale | ||
p4 = 64.8 | - | - | Fractured shale | ||
VES 2 | p1= 122 | h1= 0.9 | d1= 0.9 | Topsoil/ shale exposures |
K
|
p2= 405 | h2= 1.26 | d2= 2.16 | Shale/shale with sandstone intercalation | ||
p3= 89.5 | - | - | Fractured shale | ||
VES 3 | p1= 85.48 | h1= 0.691 | d1= 0.691 | Topsoil/ shale exposures |
KHK |
p2= 256.7 | h2= 1.095 | d2= 1.785 | Shale with less moisture content | ||
p3= 20.79 | h3= 2.143 | d3= 3.928 | Highly weathered shale/clay | ||
p4= 76.82 | h4= 4.74 | d4= 8.668 | Fractured shale | ||
p5= 23.83 | h5= 59.85 | d5= 68.52 | Highly weathered shale/clay | ||
p6= 0.403 | - | - | Contaminated groundwater |
Table 3: Geographical co-ordinates for the ring wells with their water level depth
Ring well | Geographical coordinates | Elevation | Depth of water level |
1 | N 25°41'51.39'' E 94°05'40.42'' | 1224 m | 2.06 m |
2 | N 25°41'51.34'' E 94°05'41.04'' | 1226 m | 2.29m |
3 | N 25°41'50.90'' E 94°05'38.81'' | 1210 m | 1.53 m |
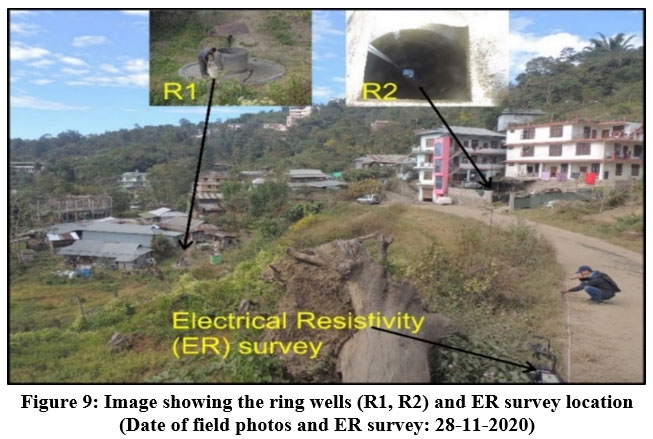
The resistivity survey was taken during the month of November, which is considered a dry season, and the existence of abundant water in the three ring wells during this season indicates that the area is well-saturated. The VES results have confirmed the presence of viable aquifers; that may be one of the factors for the country rocks to weather, besides generating water pressure in the pore spaces, leading to reduced strength of the slope materials (Fig. 9). Shallow landslides on the slopes are seen usually during monsoon season in the study area, when there is heavy precipitation, and saturated soils tend to mobilize as debris flows and weak rocks, such as shales that are easily weathered and weakened further, allows the slope to degrade further [66-68]. The analysis also shows the dominance of highly weathered and fractured shales, which can be another important factor for the slope failure.
The presence of these weak rocks and aquifers can be matched exactly with direct borehole data but since it was not available during the time of data analysis, the comparison was made with the existing borehole data at IG Stadium where the results were approximately matched and were field-confirmed.
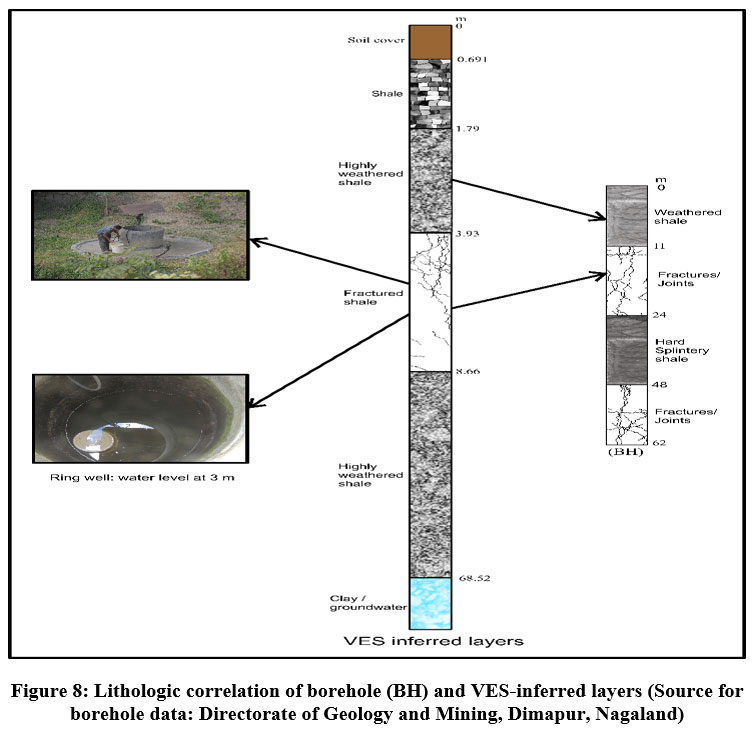 | Figure 8: Lithologic correlation of borehole (BH) and VES-inferred layers (Source for borehole data: Directorate of Geology and Mining, Dimapur, Nagaland).
|
 | Figure 9: Image showing the ring wells (R1, R2) and ER survey location (Date of field photos and ER survey: 28-11-2020).
|
The pseudo cross section obtained for the three VES locations indicates a low resistivity zone seen at VES 3, and continues towards VES 2, at a depth 30 m below the surface. A region of high resistivity zone (>250 m) at VES 1 indicates an area with less moisture content. Part of weakness zones consisting of soft materials between VES 1 and VES 3 is identified at a depth of about 10 m (approx.) from the surface. This is represented by the boundary contrast between the zones with moderately high resistivity values and low resistivity values. The presence of this weak zone indicates that the probable sliding of the slope materials might have initiated from this boundary, which led to the slope failure (Fig. 10).
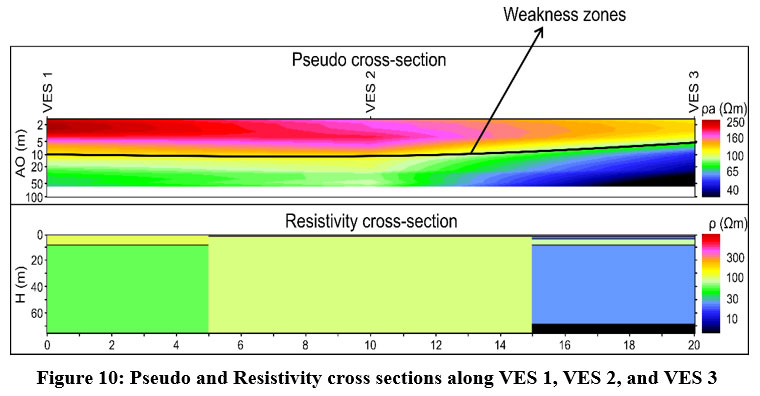 | Figure 10: Pseudo and Resistivity cross sections along VES 1, VES 2, and VES 3
|
Conclusion
The 1-D resistivity survey, utilizing the VES method and employing the Schlumberger configuration, was carried out at Perizie colony, Kohima. Three VES resistivity survey was conducted to determine the inherent subsurface condition of the slope materials and to correlate the cause of surface instabilities at Perizie colony. Results of the resistivity analysis indicate that the area consists of weathered and fractured rocks that are vulnerable to mass wasting. The weathered rocks were characterized by materials with low resistivity values, identified as the saturated zones.
The pseudo cross-section helped to identify the presence of the weak zone between VES 1 and VES 3 at depths of 10 m from the surface. During the monsoon season, the surface runoff can cause surface water infiltration into the weathered rock, which can easily seep in within the weakness zones, thereby increasing the weight of the weathered materials that can initiate slope failure.
The presence of abundant groundwater even during the dry season also points to the saturation level of the subsurface materials which can accelerate the weathering of the already weak subsurface materials.
Results obtained by the VES method are in consonance with local geology derived from available borehole data, which confirms the presence of fractured and weathered shale as the near-surface materials. The analysis also demonstrates that viable aquifers and depths of the water table can also be delineated by the VES method. Thus, the 1-D resistivity survey has provided valuable information about the subsurface conditions that might have caused the occurrence of landslides in the study area, and the results obtained may be helpful for future landslide investigations.
Acknowledgement
The authors wish to acknowledge the Department of Geology, Nagaland University, for providing the necessary logistics and equipment to carry out the investigation. The support given by Dr. C. Nokendangba Chang for preparing the base map and digitizing the VES curves is acknowledged. The help rendered by Mr. Mehilo Apon and Mr. Notoka, Research scholars, Department of Geology, during the fieldwork are also gratefully acknowledged.
Conflict of Interest
The authors declare no conflict of interest.
Funding Sources
The authors received no financial support for the research, authorship, and/or publication of this article.
References
- Directorate of Geology & Mining, Nagaland Miscellaneous Publication. 1978; No 1.
- Nandy DR. Geodynamics of Northeastern India and the adjoining region. ACB Publications, Dehradun. 2000.
- Geological Survey of India: Geology and Mineral resources of Manipur, Mizoram, Nagaland, and Tripura. Miscellaneous Publication. 2011; No. 30, Part IV, vol. 1(Part-2).
- Gogoi M., Mathur, N., Kumar, T.S., Walling, T., Pukan, S. Geochemical characterization of shales of the Eocene Disang Group Kohima Syncline India: Inferences to hydrocarbon potential and depositional environment. Pet. Res. 2021; 6(1): 42–56. https://doi.org/10.1016/j.ptlrs.2020.09.001
- Lotha K.A. A note on the geotechnical investigation on landslide at Cheipfutsiepfe, Lower AG colony, Kohima Town, Nagaland. Unpubl. Rep. Geoenvir. Cell, DGM, Nagaland (1994).
- Aier I., Supongtemjen., Khalo M., Thong G.T. Geotechnical assessment of the Mehrülietsa slide in Kohima, Nagaland. In: Kumar A., Kushwaha R.A.S., Thakur B. (Eds). Earth Syst. Sci. 2009; 1: 81– 88. Concept Publishing Company, New Delhi.
- Aier I., Thong G.T., Supongtemjen. Geological evaluation of surface instability along NH 39 (180 km), west of Raj Bhavan, Kohima, Nagaland. In: Singh T.N. and Sharma Y.C. (Eds), Slope stability - Nat. and Man-Made Slope. 2011; 192–201. Vayu Education of India, New Delhi.
- Aier I., Singh M.P., Thong G.T., Ibotombi S. Instability analyses of Merhülietsa slide, Kohima, Nagaland, Nat. Haz. 2012; 60: 1347–1363. https://doi.org/10.1007/s11069- 011-9913-6
- Chang C.N. Slope stability studies of some weak zones between hospital colony and Jotsoma bypass, Kohima, Nagaland. Unpublished Ph.D. thesis, Nagaland University, Kohima, 2022.
- Kumar C.R., Kesiezie N., Singh N., Maiti S. Seismic site response studies for microzonation and hazard assessment of Kohima, Nagaland, North Eastern Region of India, Indian J. Geosci. 2016; 71: 501–518.
- Jamir I., Gupta V., Kumar V., Thong G.T. Evaluation of potential surface instability using finite element method in Kharsali Village, Yamuna Valley, Northwest Himalaya. J. Mount. Sci. 2017; 14: 1666–1676. https://doi.org/10.1007/s11629-017- 4410-3.
- Jamir I., Gupta V., Thong G.T., Kumar V. Litho-tectonic and precipitation implications on landslides, Yamuna Valley, NW Himalaya. Phys. Geog. 2019; 41(4).https://doi.org/10.1080/ 02723646.2019.1672024.
- Roccati A., Faccini F., Luino F., Ciampalini A., Turconi L. Heavy rainfall triggering shallow landslides: A susceptibility assessment by a GIS-approach in a Ligurian Apennine Catchment (Italy). Water. 2019; 11(3): 605. https://doi.org/10.3390/w11030605.
- Yhoshu K., Krishnaiah Y.V. Assessing landslide vulnerability in Kohima city, Nagaland: A geospatial approach. NGJI. 2020; 66(3): 274-289. DOI: 10.48008/ngji.1747.
- Chang C.N., Ezung M., Apon M., Supongtemjen, Walling T., Thong G.T. Assessment of Landslides Along NH 29 in the Kevüza Area, Kohima, Nagaland. Indian Geotech. J. 2021; 51: 841–860. https://doi.org/10.1007/s40098-021-00566-z.
- Anbalagan R. Landslide hazard evaluation and zonation mapping in mountainous terrain. Engineering Geology. 1992; 32(4): 269-277.
- Anggraini R., Siregar R.N., Hendratno A., Sismanto. Identification of slip surface in mass movement zone in Kuantan Singingi regency province of Riau based on geoelectricity method and cone penetrating test. IOSR Journal of Applied Geology and Geophysics (IOSR-JAGG). 2016; 4(4): 60-65.
- Sandra S., Musa M D Th., Ulum M S., Lestari C M., Syamsiah L. Identification of the slip area of a landslide using resistivity geoelectric method. Journal of Physics:Conference Series. 2019; 1434 (2020): 012017.
- Sismanto., Erintina M.D., Wahyuni L.T. Identification of slip surface using resistivity and VLF-R mode in Goa Kiskendo Yogyakarta Indonesia. International Journal of GEOMATE. 2019; 16 (53): 177-183.
- Ashland F.X. Critical shallow and deep hydrologic conditions associated with widespread landslides during a series of storms between February and April 2018 in Pittsburgh and vicinity, western Pennsylvania, USA. Landslides. 2021; 18(6): 2159- 2174. https://doi.org/10.1007/s10346-021-01665-x
- Su M., Cheng K., Liu Y., Xue Y., Wang P., Zhang K., Li C. Combining Geophysical methods, drilling, and monitoring techniques to investigate carbonaceous shale landslide along a railway line: A case study on Jiheng railway, China. Bulletin of Engineering Geology and Environment. 2021; 80: 7493-7506. https://doi.org/10.1007/s10064-021-02365-5.
- Falae P.O., Kanungo D.P., Chauhan P.K.S., Dash R.K. Landslide investigation using Electrical Resistivity Tomography: A non-invasive technique. https://www.researcggate.net/publication/330854318.
- Wicki A., Hauck C. Monitoring critically saturated conditions for shallow landslide occurrence using electrical resistivity tomography. Vadose Zone Journal. 2022; 21(4), e20204. https://doi.org/10.1002/vzj2.20204
- Perrone A., Sabatino P., Vincenzo L. Electrical Resistivity Tomographies for landslide monitoring: a review. Beritch Geol. B-A; 93. ISSN 1017-8880.
- Varnes D.J. Slope Movement Types and Processes. In: Special report 176: Landslides Analysis and Control (eds: Schuster R.L & Krizek R.J). Transportation and Road Research Board, National Academy of Science, Washington D.C.: 11-13.
- Rahmani T.R., Sari D.P., Akmam A., Amir H., Putra A. Using the Schlumberger configuration resistivity geoelectric method to analyze the characteristics of slip surface at Solok. IOP Conf. Series: Journal of Physics: Conf. Series; 1481 (2020): 012030.
- Ling C., Xu Q., Zhang Q, Ran J., Lv H. Application of electrical resistivity tomography for investigating the internal structure of a translational landslide and characterizing its groundwater circulation (Kualiangzi landslide, Southwest China). Journal of Applied Geophysics. 2016; 131: 154-162.
- Feng W., Tang Y., Hong B. Landslide hazard assessment methods along fault zones based on multiple working conditions: A case study of the Lixian-Luojiabu fault zone in Gansu Province (China). Sustainability. 2022; 14: 8098. https://doi.org/10.3390/su14138098.
- Rahman G., Bacha A.S., Moazzam M.F.U., Rahman A.U., Mahmood S., Almohamad H., Dughairi A.A.A., Al-Mutiry M., Alrasheedi M., Abdo H.G. Assessment of landslide susceptibility, exposure, vulnerability, and risk in Shahpur valley, eastern hindu kush. Frontiers in Earth Science. 2022. DOI: 10.3389/feart. 2022.953627.
- Fransheri A., Ludyig K., Foto D. Geophysical landslide investigation and Prediction in the hydrotechnical works. Journal of the Balkan Geophysical Society. 1998; 1(3).
- Akmam., Irefia R.D., Silvia D.S., Jemmy R. Optimiton of Least-Squares Methods Smooth Constrain using Occam’s Inversion Geoelectric Resistivity Dipole-Dipole configuration for estimation of Slip Surface. Icomset. 2015; ISBN :978-602-29877-3-5.
- Cignetti M., Godone D., Giordan D. Shallow landslide susceptibility, Rupinaro catchment, Liguria (north-western Italy). J Maps. 2019; 15: 333-345.
- Trisnawati D., Najib., Hidayatillah. The relationship of lithology with landslide occurences in Banyumanik and Tembalang districts, Semarang city. IOP Conf. Series: Earth and Environmental Science. 2022; 1047: 012026. https://doi.org/10.1088/1755- 1315/1047/1/012026
- Zhang G., Wang R., Qian J.Y. Effect study of cracks on behaviour of soil slope under rainfall conditions. Soils Found. 2012; 52: 634-643.
- Lehmann P., GAmbazzi F., Suski B., Baron L., Askarinejad A., Springman S.M., Holliger K. or D. Evolution of soil wetting patterns preceding a hydrologically induced landslide inferred from electrical resistivity survey and point measurements of volumetric water content and pore water pressure. Water Resour Res. 2013; 49: 7992-8004.
- Carlini M., Chelli A., Vescovi P., Artoni A., Clemenzi L., Tellini C., Torelli L. Tectonic control on the development and distribution of large landslides in the Northern Apennines (Italy). Geomorphology. 2016; 253: 425-437.
- Farooq M., Nisar U.B., Khan S., Jalees T., Mughal M.R., Ali L., Ahmed T. Electrical resistivity tomography for delineating groundwater potential zones in fractured metasedimentary rocks, Lesser Himalayas, Pakistan. J. Earth Syst. Sci. 2022; 131(113). https://doi.org/10.1007/s12040-022-01863-8
- Sharda Y.P., Bhambay G.C. Kohima town, Nagaland. A decade of environmental geoscientific studies. GSI Sp. Publ. Series. 1980; No. 9.
- Walling T. Geological investigation of land instability in Kohima Town, Nagaland. Unpublished Ph.D. thesis, Nagaland University, Kohima (2005).
- Supongtemjen. Geological investigation of land instability between Kohima and Zhadima. Unpublished Ph.D. thesis, Nagaland University, Kohima (2013).
- Khalo M. Slope stability investigations between Kohima and Mao with special reference to NH-39. Unpublished Ph.D. thesis, Nagaland University, Kohima (2016).
- Kemas K., Thong G.T., Walling T. Chokidzü debris slide - A case study. Nagaland University Research Journal. 2004; 2: 89–94.
- Walling T., Lotha K.A., Thong G.T., Aier I. Chiepfütsiepfe slide, Kohima, Nagaland. Causes and mitigation measures. Proc. NRDMS (DST) Sem. Landslide Haz. Miti., NE Ind. 2005: 48–54.
- Aier I., Supongtemjen., Thong G.T. Slope mass rating and kinematic analyses along part of NH 61, Nagaland, NE India. Int. J. Earth Sci. Eng. 2009; 2: 520–526.
- Sothu H.N., Aier I., Thong G.T. Evaluation of two unstable sites along NH 150, SE of Kohima Town, Nagaland. Indian Landslides. 2009; 2: 27–30.
- Supongtemjen., Thong G.T. Risk analyses along part of NH 2, north of Kohima town, Nagaland. Indian Landslides. 2014; 7: 35–44.
- Supongtemjen., Walling T., Tep S., Thong G.T. Stability analyses of two fresh cut slopes along NH 2, Meriema, Nagaland. Proceedings of the National Seminar on Landslides: Management and Mitigation Strategies. J. Eng. Geol. 2015; vol. XL: 158–170.
- Walling T., Supongtemjen., Chang C.N., Thong G.T. Geotechnical analyses of debris slide near Secretariat junction, Kohima, Nagaland. In: Srivastava S.K. (Ed), Recent Trends in Earth Science Research with Special Reference to NE India, Today and Tomorrow Publishers, New Delhi, pp. 277–289 (2016).
- Griffiths D.H., Barker R.D. Two-dimensional resistivity imaging and modelling in areas of complex geology. Jour. Appl. Geophys. 1993; 29: 211-226.
- Loke M.H., Barker R.D. Practical techniques for 3D resistivity surveys and data inversion. Geophys. Prospect. 1996; 44: 499–523.
- Giano S. I., Lapenna V., Piscifelli S., Schiattarella M. Electrical imaging and self- potential surveys to study geological setting of the quaternary slope deposits in the agri-high valley. Annali de Geofisica. 2000; 43: 409-419
- Andews N.D., Aning A.A., Danuor S.K., Noye R.M. Geophysical investigations at the proposed site of the KNUST teaching hospital building using 2D and 3D resistivity imaging techniques. Int. Res. Jour. Geol. Min.2013; 3(3): 113-123.
- Ugwu G. Z. Electrical resistivity imaging for the investigation of the subsurface formations at Bethel Estate in Emene Industrial Layout, Enugu, southeastern Nigeria. ASUU-ESUT Jour. Sci. Tech. Human. 2012; 1(1): 112-119.
- Telford W.M., Geldart L.P., Sherrif R.E. Applied Geophysics. 2nd Ed. Cambridge University Press, (1990).
- Ganesh R., Gowtham B., Manive T., Senthilkumar S., Sundrajan M. Application of Resistivity methods in landslide investigations along Mettupalayam to Coonoor highway, Nilgiris District, Tamilnadu, India. Sch. J. Eng. Tech. 2017; 5(11): 661–667.
- Vender Velpen, B.P.A. A computer processing package for DC Resistivity interpretation for IBM compatibles. ITC J. 1998; 4: 1–4.
- Gopinath V.S.T., Vinodh K., Gowtham B., Arulprakasam V. Geolectrical characterization of substrata by using Geoelectrical Imaging Technique in Gagilam river sub basin, Tamilnadu, India. Int. J. Sci. Eng. Appl. Sci.2015; 1(6): 451–457.
- Sultan A.S., Santos F.A.M. 1D and 3D resistivity inversions for geotechnical investigation. J. Geophys. Eng. 2008; 5: 1–11.
- Gouet D.H., Meying A., Nkoungou H.L.E., Assembe S.P., Nouck P.N., Mbarga, T.N. Typology of sounding curves and lithological 1D models of mineral prospecting and groundwater survey within crystalline basement rocks in the east of Cameroon (Central Africa) using electrical resistivity method and Koefoed computation method. Int. J. Geophys.2020. https://doi.org/10.1155/2020/8630406
- Alile O.M., Amadasun C.V.O., Evbuomwan A.I. Application of vertical electrical sounding method to decipher the existing subsurface stratification and groundwater occurrence status in a location in Edo north of Nigeria. Int. J. Phys. Sci. 2008; 3(10): 245–249.
- Bairu A., G/her Y., G/her G. Application of vertical electrical sounding and horizontal profiling methods to decipher the existing subsurface in river Segan dam site, Tigray, Northern Ethiopia. J. Environ. Earth Sci. 2013; 3(10): ISSN 2224–3216.
- Kana J.D., Djongyang N., Dadjé A., Raïdandi D. Vertical electrical soundings for subsurface layers and groundwater investigations in the Mayo Kani area in Cameroon. Int. J. Sci. Res. 2015: ISSN (Online): 2319–7064.
- Hassan E., Rai J.K., Anekwe U.O. Geoelectrical survey of groundwater in some parts of Kebbi state, Nigeria, a case study of Federal Polytechnic bye-pass Birnin Kebbi and Magoro Primary health centre Fakai local Government. Geosci. J. 2017; 7(5): 141–149.
- Manimegalai M.K., Gowtham B., Vinodh K. Investigation of subsurface and groundwater state at Gadilam river sub-basin, Tamil Nadu, India. Int. J. Modn. Res. Revs. 2017; 5(10): 1632–1638.
- Umar D.U., Igwe O. Geo-electric method applied to groundwater protection of a granular sandstone aquifer. Appl. Water Sci. 2019; 9: 112.
- Lu N., Godt J. Infinite slope stability under steady unsaturated seepage conditions. Water Resour. Res. AGU J. 2008; 44: W11404.
- Iverson R.M., Reid M.E., LaHusen R.G. Debris-flow mobilization from landslides. Annu. Rev. Earth Planet. Sci. 1997; 25: 85-138.
- Carlini M., Chelli A., Vescovi P., Artoni A., Clemenzi L., Tellini C., Torelli L. Tectonic control on the development and distribution of large landslides in the Northern Apennines (Italy). Geomorphology. 2016; 253: 425-437.


